Market Seasonality Report – March 2025: Can the S&P 500 Get Back on Track?
Talking Points
- Both the S&P 500 and Nasdaq 100 have tended to strengthen in March, but lackluster performance so far in 2025 has bulls on edge
- March has historically seen the second-worst performance of all months for gold, which has recently pulled back from record highs
- The budding trade war and developments on the tariff front could well outweigh the long-term historical seasonal tendencies this month
The beginning of a new month marks a good opportunity to review the seasonal patterns that have influenced the markets since 1990. As always, these seasonal tendencies are just historical averages, and any individual month or year may vary from the historic average, so it’s important to complement these seasonal leans with alternative forms of analysis to create a long-term successful trading strategy. In other words, past performance is not necessarily indicative of future results.
S&P 500 Seasonality – S&P 500 (Price-Only)
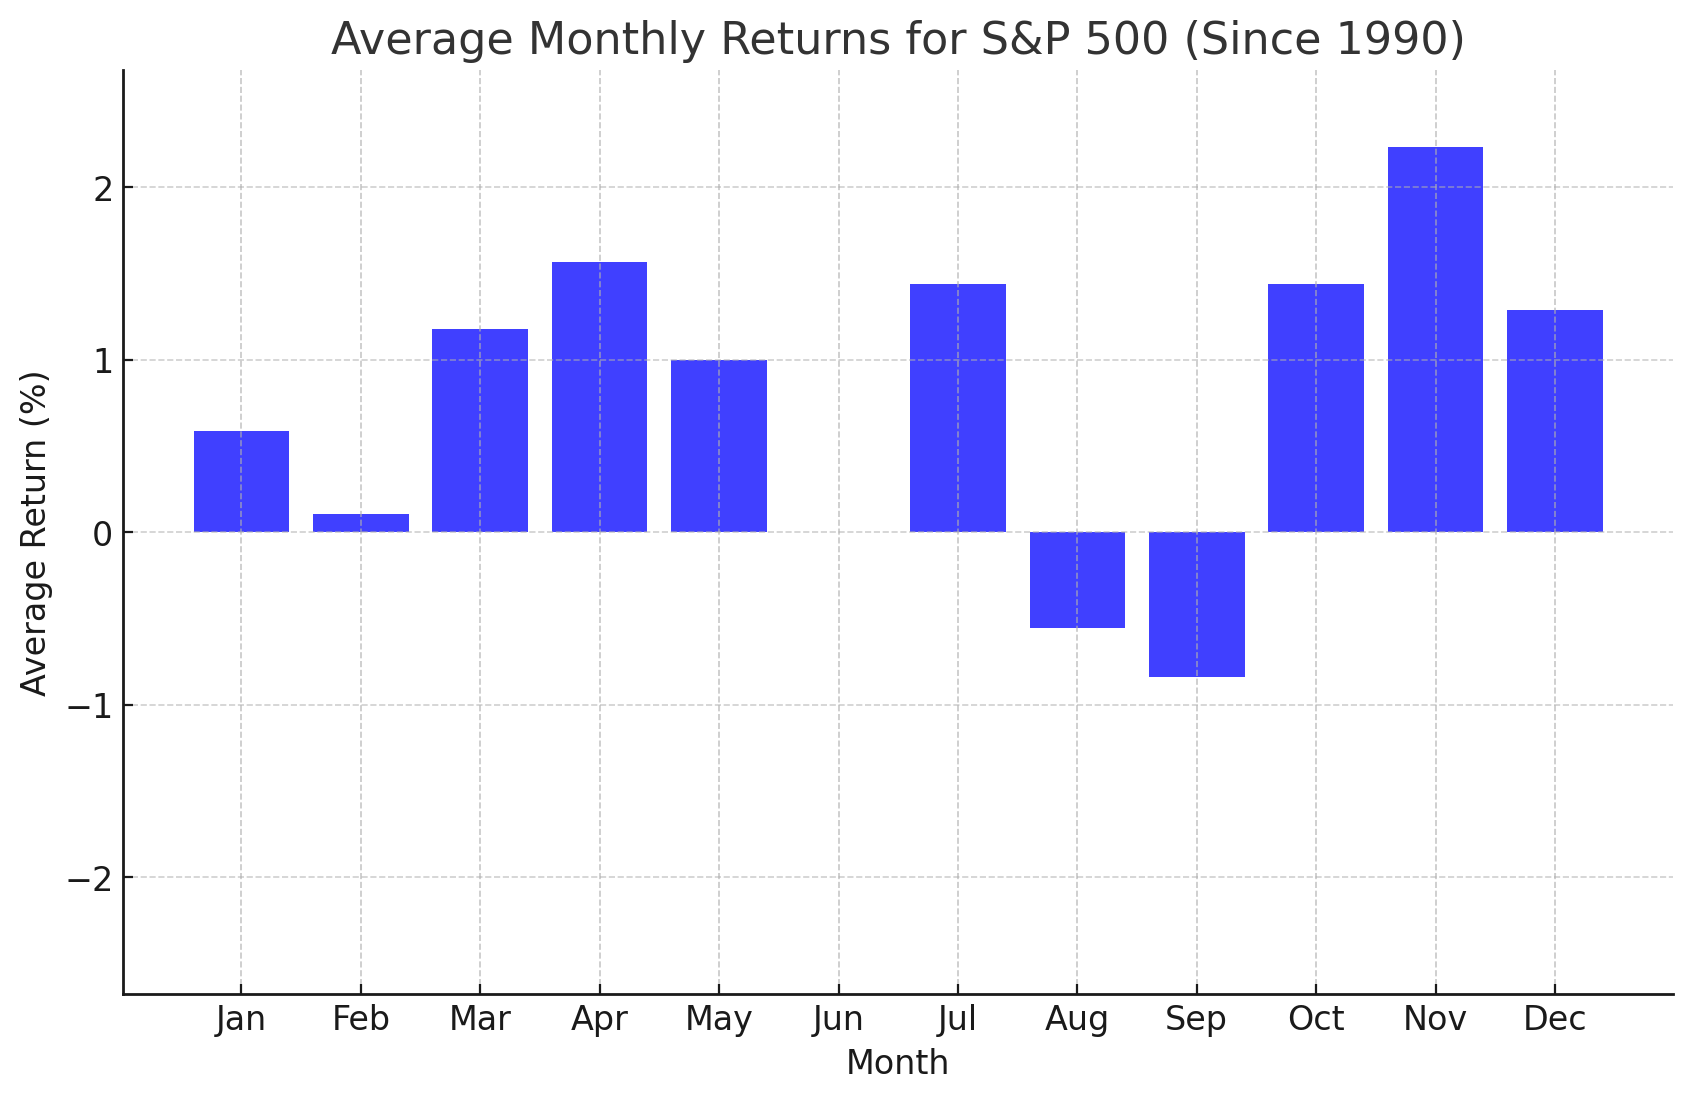
Chart Source: TradingView, StoneX. Please note that past performance is not necessarily indicative of future results.
Historically, March has been a relatively bullish month for the US stocks, with the broad S&P 500 index sporting an average (price-only) return of +1.2% over the last 35 years. After a lackluster start to the year (essentially flat since January 1st), investors will be hoping that the longer-term bullish trend kicks in ahead of the typical “summer doldrums.” Key storylines to watch for the stock market include the potential for US tariffs and any potential deterioration in the labor market, which has remained remarkably resilient over the last few years.
Nasdaq 100 Seasonality – NDX (Price-Only)
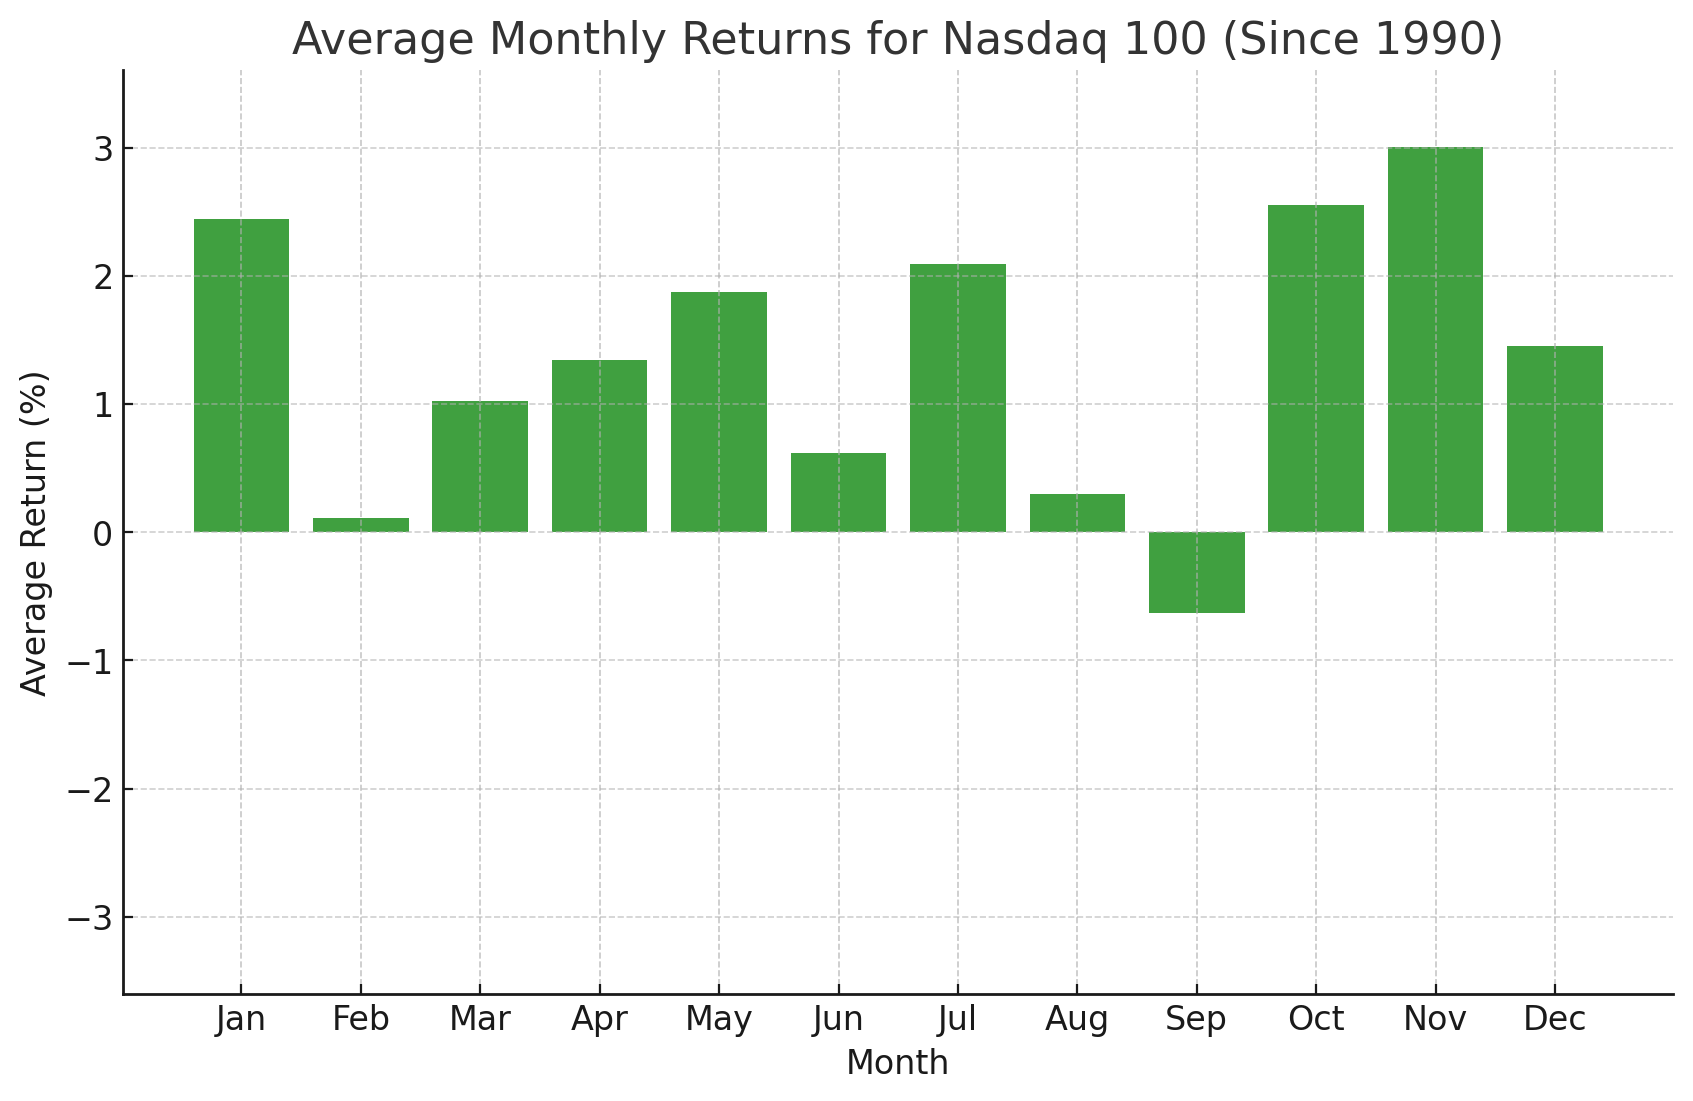
Chart Source: TradingView, StoneX. Please note that past performance is not necessarily indicative of future results.
Looking at the above chart, the Nasdaq 100 has historically gained a bit of ground in March, with an average return of +1.0% since 1990. Long the leader among the US indices, the Nasdaq 100 is hitting a speedbump so far in 2025 with traders apprehensive amidst high expectations (and accordingly high valuations) around the “AI Revolution” theme, highlighted by soft YTD performance in the quintessential AI darling, Nvidia.
Volatility Index Seasonality – VIX Chart
Source: TradingView, StoneX. Please note that past performance is not necessarily indicative of future results.
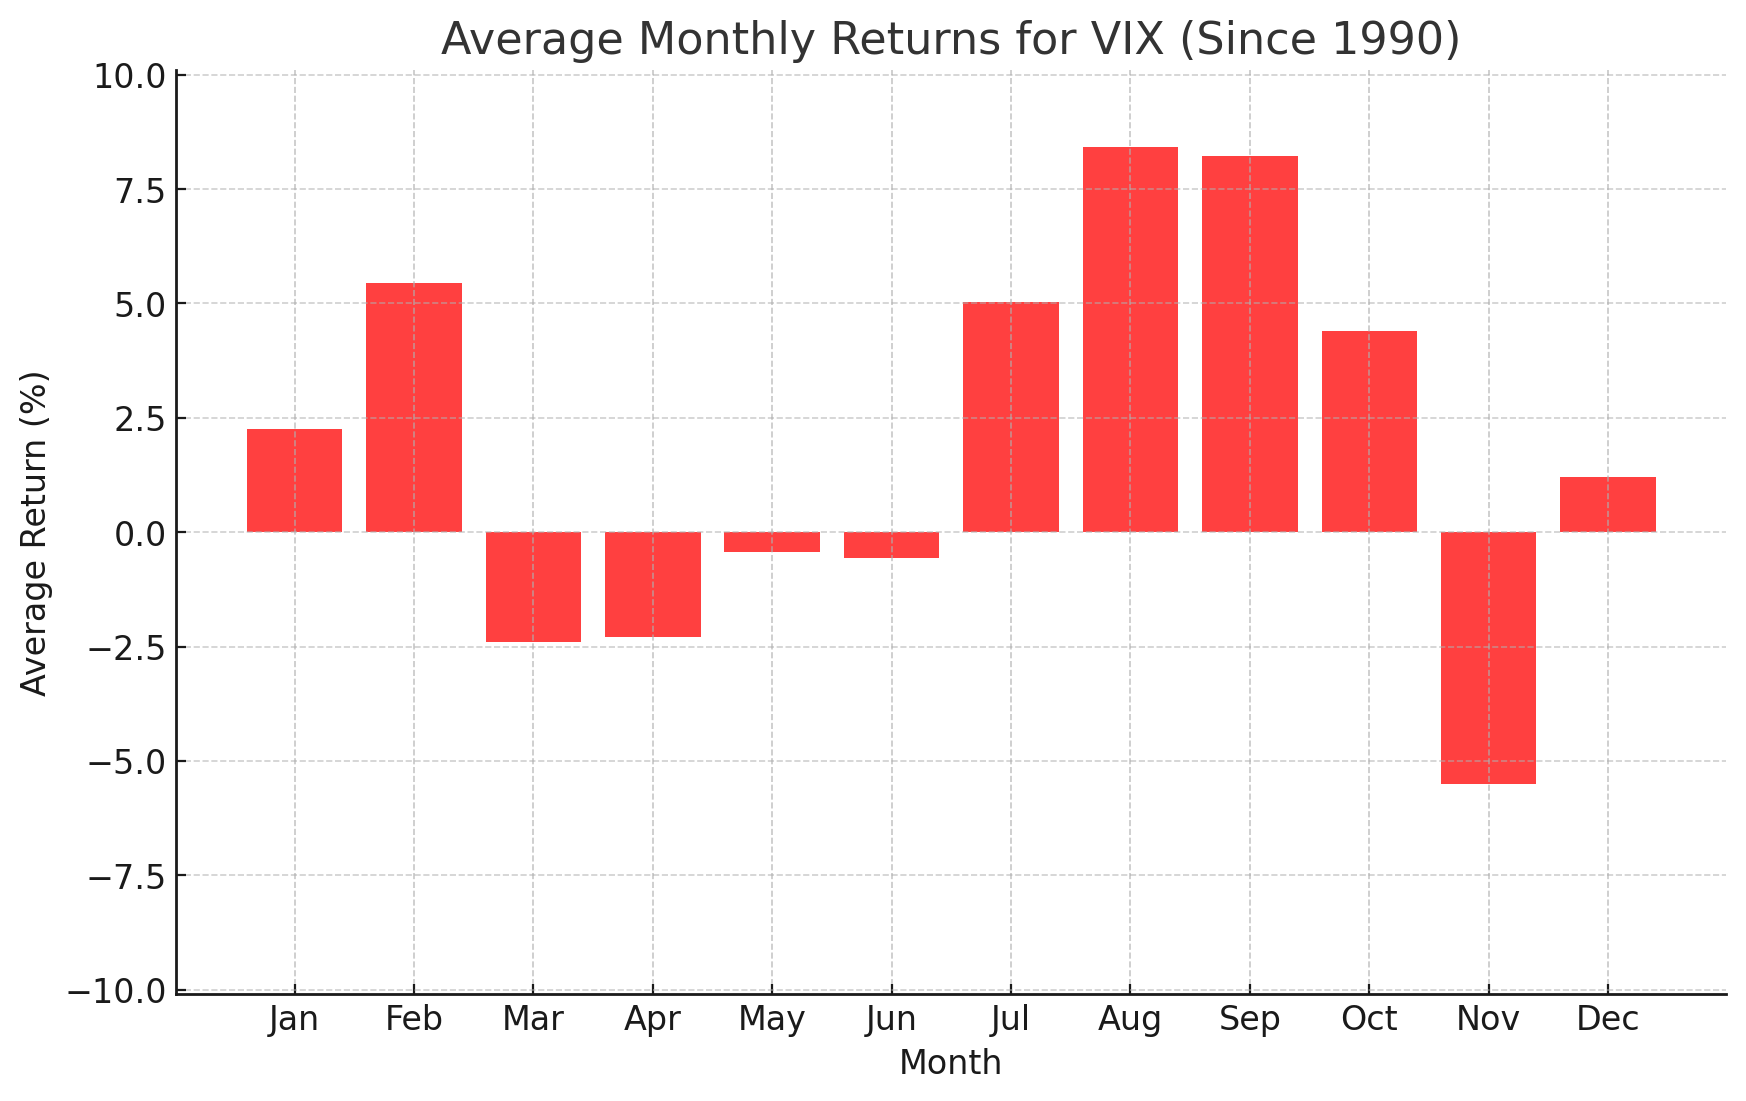
March has historically been a month where stock market volatility falls, with the VIX index contracting by an average of -2.4% since 1990. That said, there may be different trends based on the election cycle as traders come to grips with the policies of the new Administration, as we’ve seen over the last couple months. As of writing, there is tremendous uncertainty around the situation in Ukraine, along with fears of a potential trade war between the US and the rest of the world, keeping the VIX near the top of the 12-23 range that has constrained it for the last two years (absent one brief foray above 60 last August).
Gold Seasonality – XAU/USD Chart
Source: TradingView, StoneX. Please note that past performance is not necessarily indicative of future results.
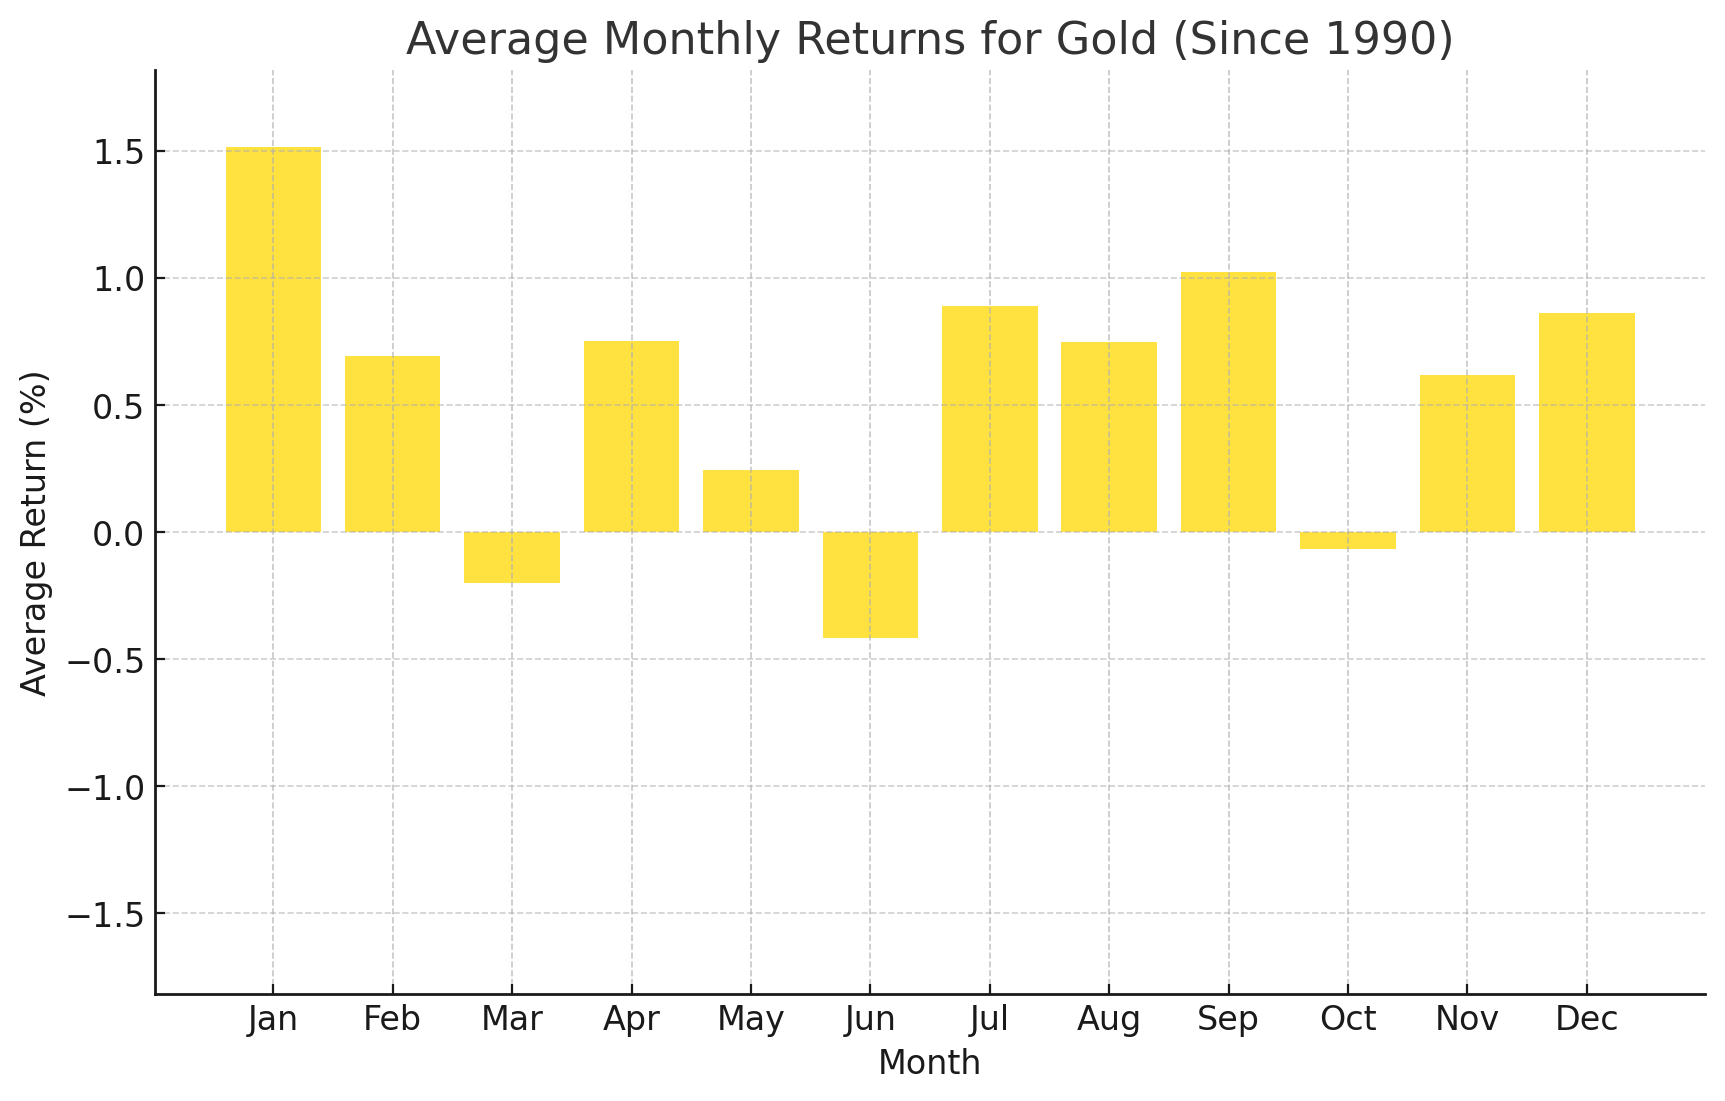
Turning our attention to commodities, March has been the second-worst month for gold performance, with an average loss of -0.2% going back to 1990. After an impressive rally through January and most of February, the yellow metal swooned back below $2900 to end last month, prompting traders to question whether the move was just a shallow counter-trend pullback or the start of a more significant top. Given the strong underlying uptrend going back to late-2022, the balance of risks may be skewed toward a continued rally until proven false.
WTI Crude Oil Seasonality – WTI Chart
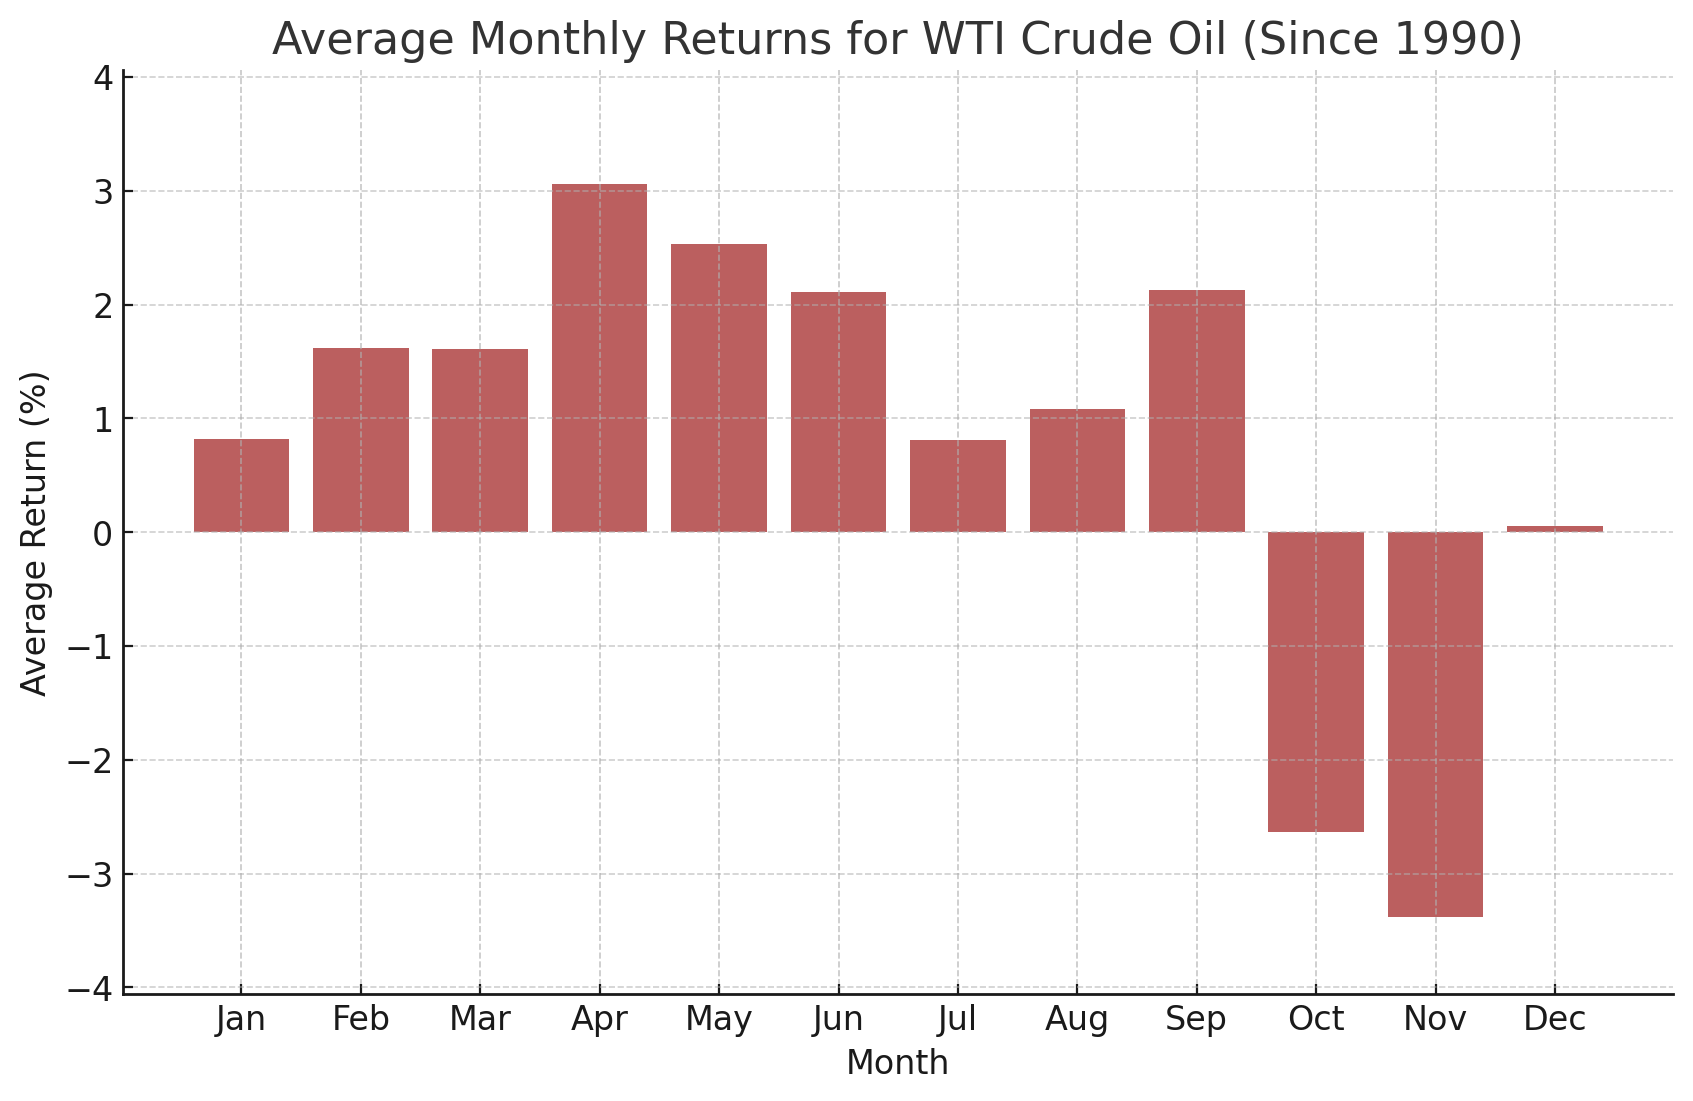
Source: TradingView, StoneX.Please note that past performance is not necessarily indicative of future results.
Last but not least, WTI Crude Oil has historically rallied in March, with an average gain of 1.6% over the last 35 years. While it can be useful to understand the historical seasonal tendencies in certain environments, developments on the trade front, OPEC+ increasing drilling activity and any stimulus from China’s Two Sessions meeting will likely be a bigger driver for WTI this month than the historical seasonal trend. As always, we want to close this article by reminding readers that seasonal tendencies are not gospel so it’s important to complement this analysis with an examination of the current fundamental and technical backdrops for the major markets and the global economy.
-- Written by Matt Weller, Global Head of Research
Check out Matt’s Daily Market Update videos on YouTube and be sure to follow Matt on Twitter: @MWellerFX