USD Attempts to Carve a Low as EUR/USD Shies Away from 1.1000
Key Talking Points:
- EUR/USD showed a massive breakout in early-March as recession fears showed in U.S. markets
- EUR/USD has so far stalled at Fibonacci resistance for two weeks, although bears haven’t quite taken over yet
- With the Euro as a 57.6% clip of DXY, it can make sense to relate the two markets so if asking if a top is in place for the Euro, it’s a worthwhile effort to look at bottoming potential in the USD
It’s still early after the March FOMC rate decision but so far, there’s a few different items of evidence suggesting that a near-term low may be in for the U.S. Dollar. Given that DXY is a composition of underlying currencies the answer as to whether that actually takes place can have input from other markets, and given the Euro’s outsized 57.6% allocation into DXY, it’s logical to look at the possibility of topping in EUR/USD if looking for a swing-low in the USD.
In EUR/USD, the pair pushed one of its strongest rallies ever earlier in March, backed by the abysmal Atlanta GDP Now estimate that showed the possibility of Q1 GDP contracting by -2.8%. That’s pared back a bit, but it still shows as an ugly number, as of this writing, but Jerome Powell and the Fed didn’t seem all too alarmed in the updated projections furnished by the bank in the Summary of Economic Projections at yesterday’s announcement.
And we only need to go back to early-February when sentiment was dire around EUR/USD, as the pair continued to probe support around the 1.0200 handle amidst a flurry of calls for a parity print.
At this point, resistance has held at a major spot in EUR/USD with the 1.0943 Fibonacci level coming into play. This is the 50% mark of the 2021-2022 move, and the 23.6% retracement of that same setup is what helped to catch the low back in January. Sellers stalled out over the next six weeks and the door soon opened for bulls to run the breakout after the March open, helped along by that growing fear of recession potential in the United States.
EUR/USD Weekly Chart
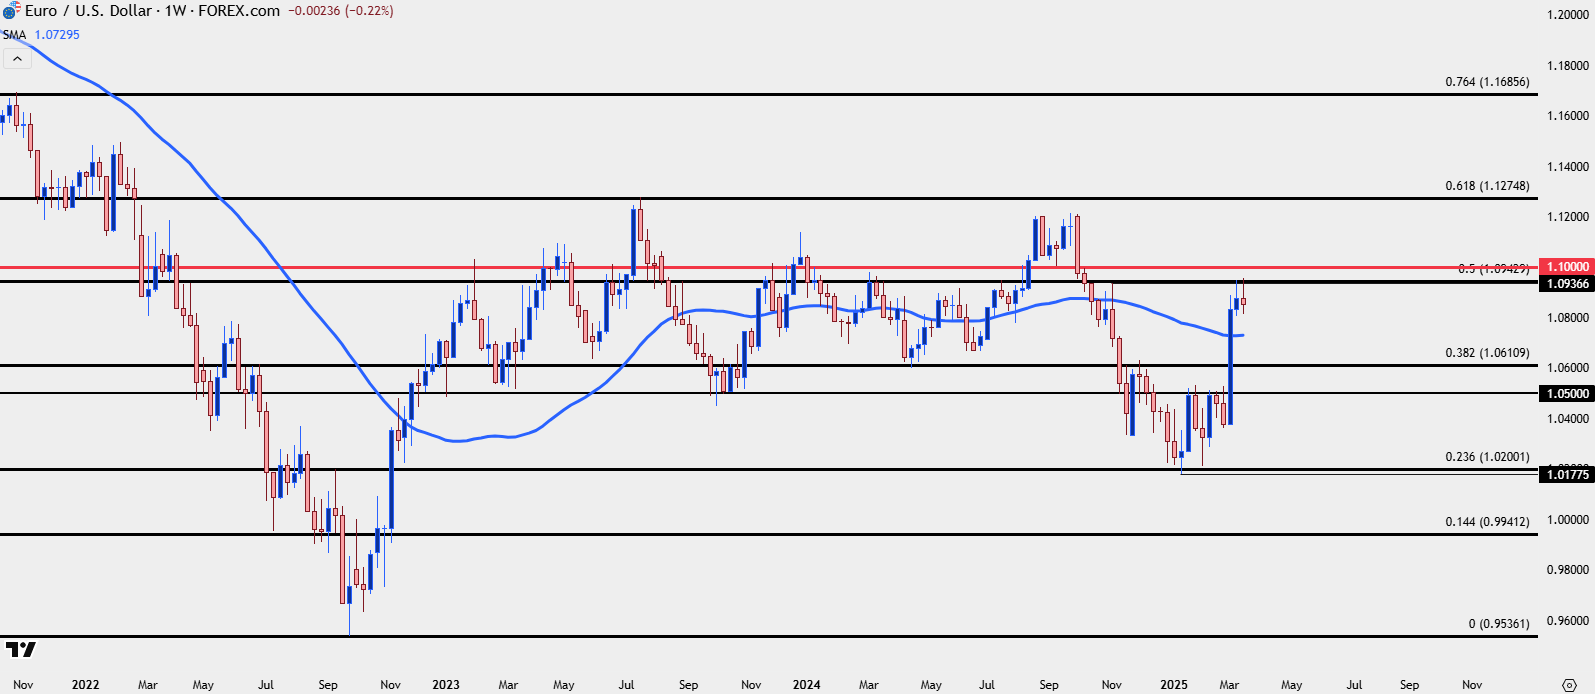
Chart prepared by James Stanley; data derived from Tradingview
EUR/USD Pullback Potential
If sellers do continue to push lower-lows and lower-highs in EUR/USD, it’s not necessarily game over for bulls yet. The breakout in early-March was of such a magnitude that there remains higher-low potential at a couple of key spots on the chart. The 1.0500 area was resistance through February, and logically, this becomes the area that buyers need to defend to retain upside potential. But, above that is another Fibonacci level of note at 1.0611, and then there’s the 200-day moving average which currently plots around 1.0730.
Given the size of the breakout a continued pullback from profit taking wouldn’t necessarily rule out bullish continuation themes, if any of those three supports can remain in-play. But looming overhead is another major level at the 1.1000 handle, and if we do see bulls stretch the move before a larger pullback to support, that can further reinforce the idea of reversal potential in the pair and, correspondingly, this could support capitulation themes in the USD, looked at in greater depth below.
EUR/USD Daily Price Chart
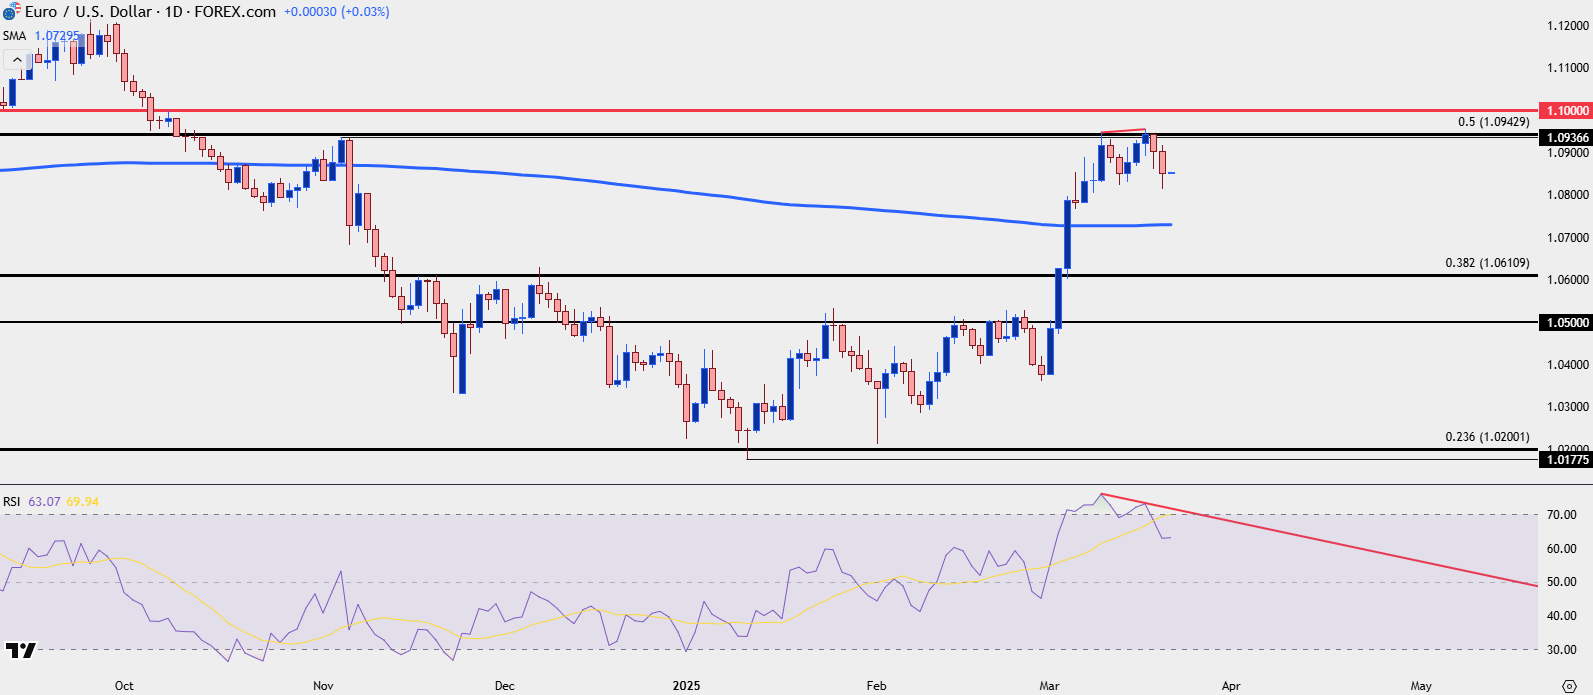
Chart prepared by James Stanley; data derived from Tradingview
The U.S. Dollar
The relative pullback in the USD at this point remains shallower than what’s shown in EUR/USD. In DXY, price continues to find resistance at the 103.98 Fibonacci level, and this comes after the early-week stall at the November low of 103.37. But a case of RSI divergence here highlights that growing case for a pullback that could potentially turn into something more, like the dynamic that had shown in the indicator last August and September, just before the turn took over after the Q4 open.
If we do see the short-term rally in the USD continue, that could very much come along with the deeper pullback scenario in EUR/USD looked at above; but perhaps the more interesting case here is if EUR/USD bulls press into the 1.1000 handle before a more-sizable pullback, which could relate to a test of a lower-low in USD.
If that lower-low fails to see follow-through, however, that’s when the potential for capitulation could show up. This would be similar to the mirror image of the upper wick shown on the January 13th daily bar of DXY, highlighted in the grey box on the below chart.
Trading for tops and bottoms can be challenging so oftentimes, it’s best to look for something like a falling wedge (like last August or September) or a shooting star (like what showed on January 13th). That can at least provide the framework for reversal scenarios, and if coupled with a case of RSI divergence, it could be even more attractive as that framework can help to offer some element of strategy for risk management around the setup.
US Dollar Daily Chart
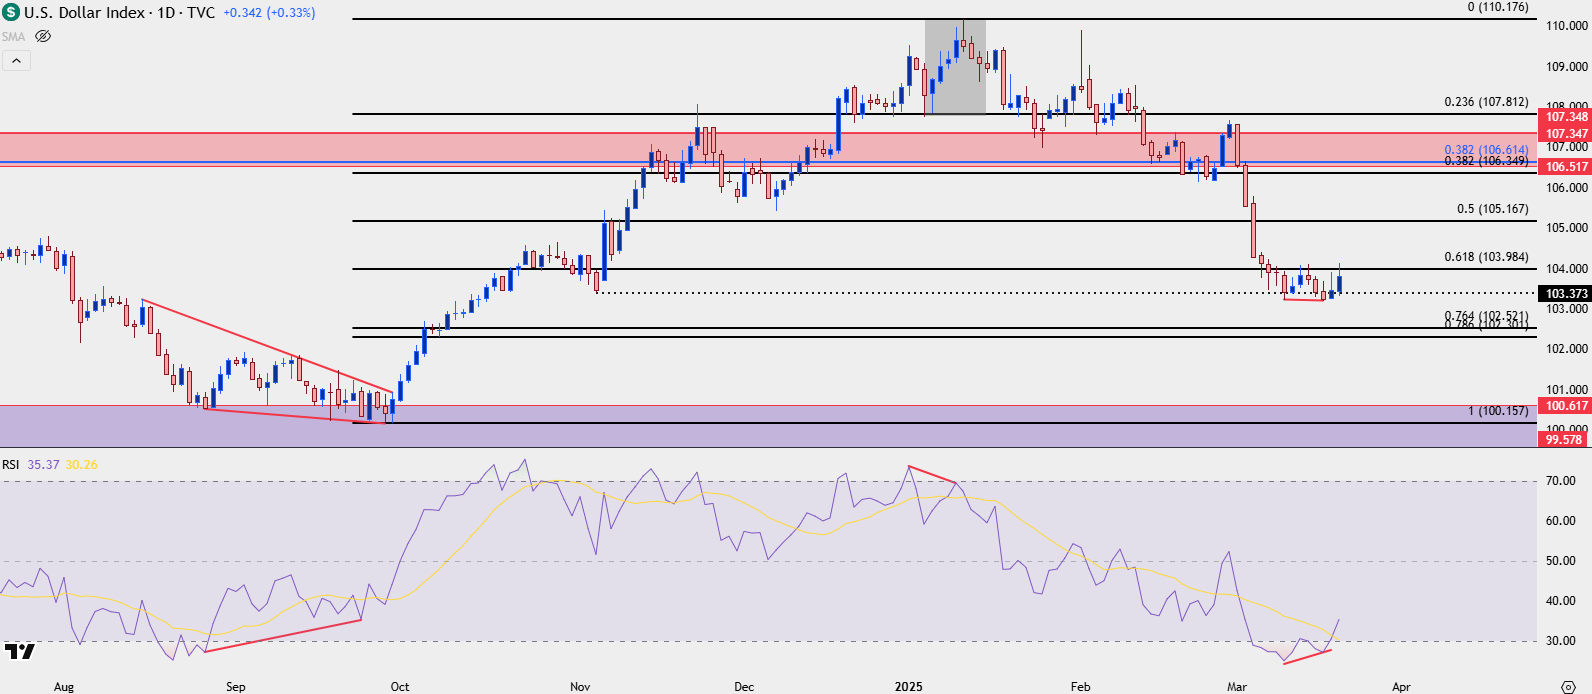
Chart prepared by James Stanley; data derived from Tradingview
--- written by James Stanley, Senior Strategist