

Market commentary Currencies- Thought Leadership Team
Banks preparing for the November 2026 deadline must look beyond ISO 20022 output to source data, client channels, automated structuring and exception controls.

Global Author
- Currencies
By: John Kicklighter, Head of Market Research
Talking Points:
Are the markets under pressure? That may seem an easy qualification to make if you are looking at a particular, favorite benchmark for sentiment and gauge any retreat according to a certain percentage slip from highs. That said, in a broad financial system as the one that we have, there are differing opinions and a certain degree of bullish skepticism that has kept the markets reverting to an inflationary climb so associated to capital markets like equities over the past few years. Even for the more optimistic amongst us, the markets seem to be listing towards serious concern.
The Nasdaq 100 – once a favorite, tech-centric speculative benchmark – slipped into a technical ‘bear market’ (correction of 20 percent or greater from highs) while the broader S&P 500 was closing in on its own tipping point after its worst week’s loss since the height of the pandemic. These are troubling performance figures, but it’s always good to look towards more systemic measures to gauge the sentiment beneath the more reactive surface.
Chart of S&P 500 with 2-Day Rate of Change and Level for Technical ‘Bear Market’ (Daily)

Source: John Kicklighter, TradingView
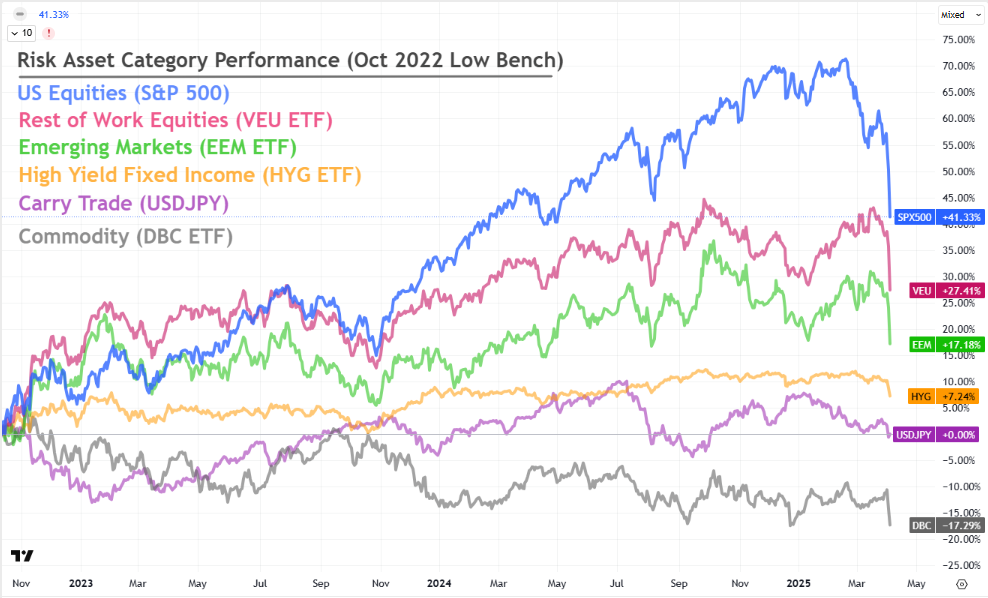
A further step into measuring sentiment is to look for an alignment towards ‘de-risking’ across other regions and asset classes. There was no missing the weight being exerted on confidence across various speculative tributaries. Non-US equity indices, emerging markets, high yield fixed income, carry trade and other assets on the higher risk / higher yielding side of the spectrum were all registering substantial losses this past week.
When setting a baseline to the October 2022 low in the S&P 500, the comparative retreat from the recently set peak and high correlation is difficult to miss. Across so many different markets with significantly different fundamental backdrops and endogenous drivers, such alignment to both direction and intensity of repricing is more often a sign of a deeper current that often ties back to the systemic motivation of ‘risk appetite’.
Chart of Relative Performance of ‘Risk’ Benchmarks Baseline to October 2022 (Daily)
Source: John Kicklighter, TradingView
While it is easier to assess the difference between a general ‘risk appetite’ drive compared to ‘risk aversion’, the more measured comparison of modest to intense sentiment on one end of the spectrum can indicate a shift into a systemic and even self-sustained cycle. In light of that relative measure, it can be useful to compare the performance of a preferred speculative benchmark relative to a broader measure – like the tech-heavy Nasdaq 100’s advance relative to the blue-chip Dow - to gauge a fortified trend when markets are climbing. When that relationship starts to waver, it can suggest an erosion of conviction from unwavering risk appetite to a potential inversion, We can also make observations of relative safe havens to gauge the other end of the spectrum.
Scale of Sentiment and Asset Benchmarks that Align

Source: John Kicklighter
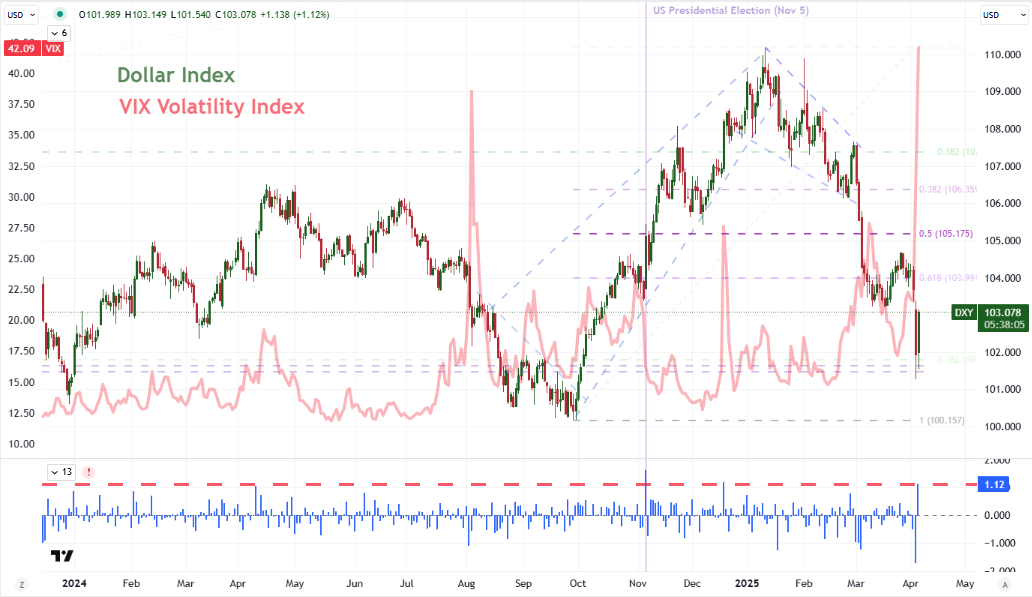
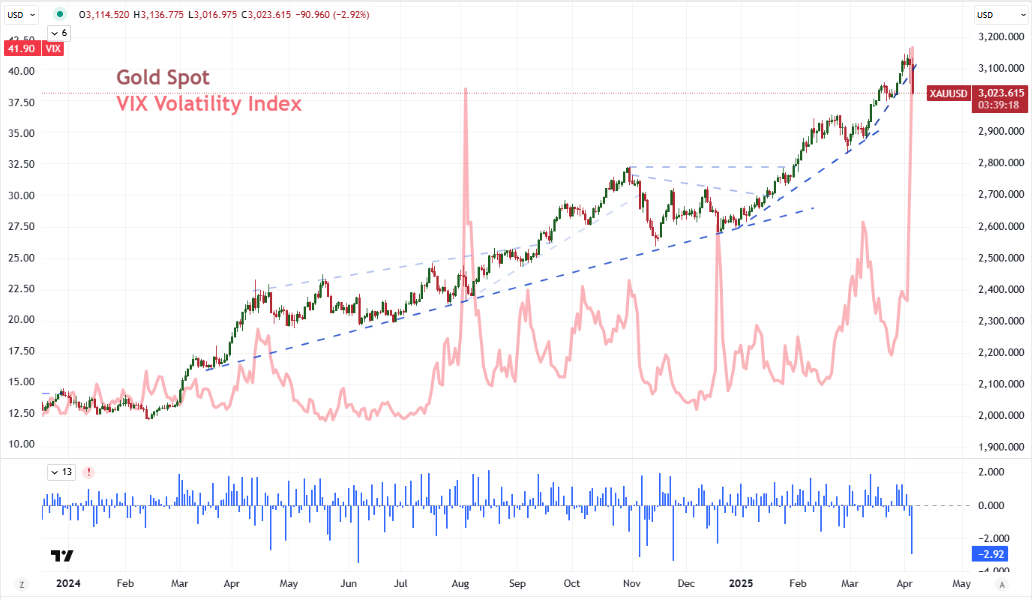
On the ‘safe haven’ end of the sentiment scale, there are a number of recognizable assets that global investors tend to favor, such as: gold, US Treasuries, the Japanese Yen and US Dollar. The Japanese Yen represents one of the largest economies in the world (stable and a high sovereign credit rating), but more often, its appeal has been bolstered by the unwind of carry trade – pursuit of higher yields in other countries – the past few decades. A more recognizable haven of late has been gold. The precious metal has taken on a greater appeal amid the pressure of lower yields in financial assets with rate cuts (gold has no yield) and with the questions around currency stability amid capital distortions born of trade wars.
Chart of DXY Dollar Index and the VIX Volatility Index (Daily)
Source: John Kicklighter, TradingView
That mix had pushed the commodity to record highs through the past weeks. But, through the end of this past week, the metal notably took a hit while equities were pummeled. Gold didn’t suddenly lose its haven property, rather the need of absolute liquidity grew amid the growing fear. While gold is reliable and a cash equivalent, it doesn’t come close to the liquidity of the US Dollar – and the Treasuries that back it. If this dynamic persists, it may indicate a far greater intensity of risk aversion than a mere S&P 500 would suggest.
Chart of Gold and the VIX Volatility Index (Daily)
Source: John Kicklighter, TradingView
What are the major events and indicators on tap for the global economy that could charge volatility in markets and reshape deeper fundamental themes? Sign up for the updated Global Macro Calendar updated each week with a two week look ahead of the top events!
Sign Up-- Written by John Kicklighter, Global Head of Content
The subsidiaries of StoneX Group Inc. provide financial products and services, including, but not limited to, physical commodities, securities, clearing, global payments, risk management, asset management, foreign exchange, and exchange-traded and over-the-counter derivatives. These financial products and services are offered in accordance with the applicable laws in the jurisdictions in which they are provided and are subject to specific terms, conditions, and restrictions contained in the terms of business applicable to each such offering. Not all products and services are available in all countries. The products and services offered by the StoneX Group of companies involve risk of loss and may not be suitable for all investors. Full Disclaimer. This content is not intended for residents of any particular country, and the information herein is not advice nor a recommendation to trade nor does it constitute an offer or solicitation to buy or sell any financial product or service, by any person or entity in any jurisdiction or country where such distribution or use would be contrary to local law or regulation. Please refer to the Regulatory Disclosure section for entity-specific disclosures. No part of this material may be copied, photocopied or duplicated in any form by any means or redistributed without the prior written consent of StoneX Group Inc. The information herein is provided for informational purposes only. This information is provided on an ‘as-is’ basis and may contain statements and opinions of the StoneX Group of companies as well as excerpts and/or information from public sources and third parties and no warranty, whether express or implied, is given as to its completeness or accuracy. Each company within the StoneX Group of companies (on its own behalf and on behalf of its directors, employees and agents) disclaims any and all liability as well as any third-party claim that may arise from the accuracy and/or completeness of the information detailed herein, as well as the use of or reliance on this information by the recipient, any member of its group or any third party.
© 2026 StoneX Group Inc. all rights reserved.
Our subscribers have access to comprehensive market analysis from StoneX spanning commodities, equities, currencies and more.
Banks preparing for the November 2026 deadline must look beyond ISO 20022 output to source data, client channels, automated structuring and exception controls.

The US dollar index is rising on falling volume, and volume confirmation is the test that separates a trend with buyers behind it from a corrective bounce. Matt Simpson works through what the participation behind the advance is showing.


Dollar to reflect US economic data, Central Bank minutes, inflation in Brazil, and the Middle East

Our market expertise, advanced platforms, global reach, culture of full transparency and commitment to our clients’ success all set us apart in the financial marketplace.
Reach
With access to 40+ derivatives exchanges, 180+ foreign exchange markets, nearly every global securities marketplace and numerous bilateral liquidity venues, StoneX’s digital network and deep relationships can take clients anywhere they want to go.
Transparency
As a publicly traded company meeting the highest standards of regulatory compliance in the markets we serve, our financials and track record are matters of public record. StoneX’s commitment to “doing the right thing over the easy thing” sets us apart in the industry and helps us build respect, client trust and new partnerships.
Expertise
From our proprietary Market Intelligence platform to “boots-on-the-ground” expertise from award-winning traders and professionals, we connect our clients directly to actionable insights they can use to make more informed decisions and achieve their goals in the global markets.