China has released its second round of significant economic readings for the month of August, i.e. trade data, which overall is painting the picture for an improved demand outlook in the final quarter of the year. In today’s commentary, we will highlight the key points to take away from the numbers released.
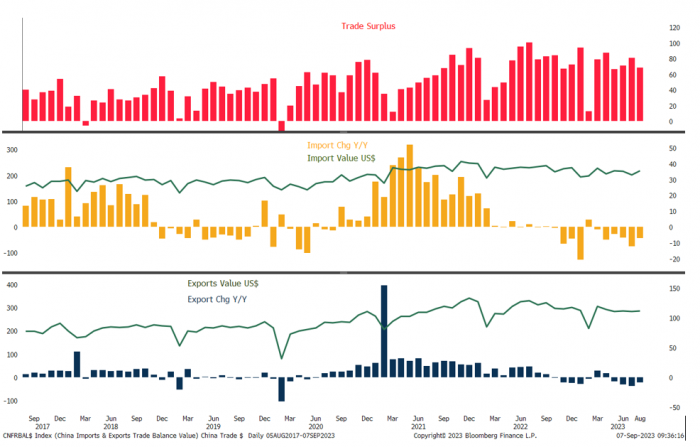
• Exports fell by 8.8% in August which, although still negative, was the first M/M improvement since March 2023. Please note, the reading came in above market expectations of a fall of 9.0% and the July reading of -14.5% (which marked the lowest level of exports demand since the pandemic in 2020).
• Imports in August reduced their pace of declines to 7.3% (from -12.4% in July), above market expectations of a 9.0% drop.
• The trade balance moved to $68.7Bn from $80.6Bn in July.
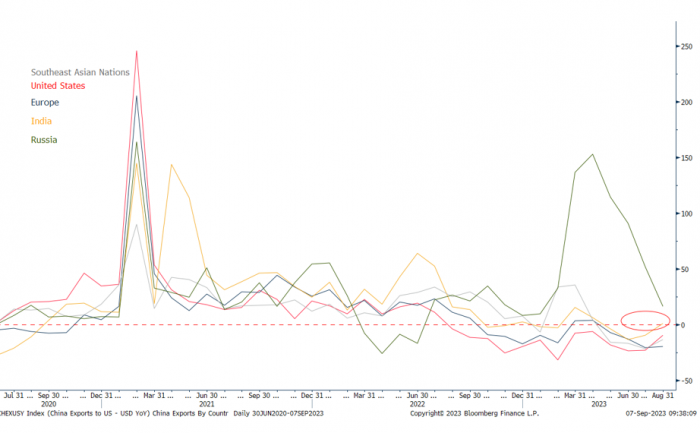
• While Russian demand continues to weaken M/M since hitting an annual peak in April, one of the most significant moves has been with India, with export demand returning to growth of 0.7% in August, after having been in decline over most of this year. In addition to this, the pace of declines has slowed with the U.S. and Southeast Asian Nations, reversing a five-month stint of weakening demand.
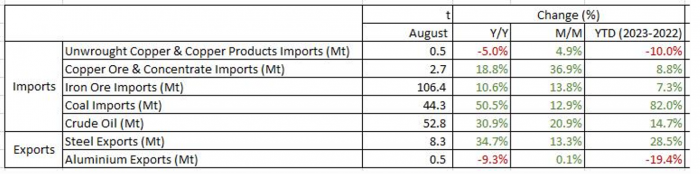
• Energy and metal demand increased on a M/M basis in August, reversing declines recorded in July, with only imports of refined copper products and exports of aluminium remaining in the red on a YTD Y/Y basis.
Trade by Commodity – July
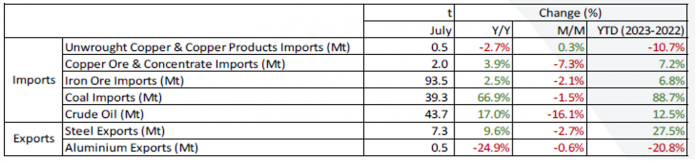
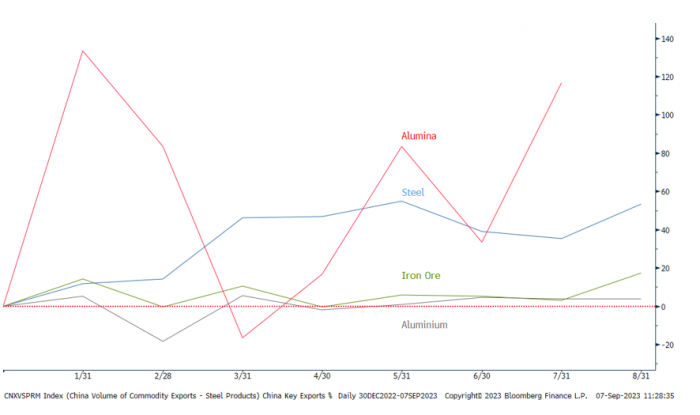
• Demand has soared for alumina over the last couple of years, with YTD imports up 117%. This has been driven by increasing trade activity between China and Russia, with China providing Russia with required alumina for aluminium production, then returning the final products to China. Please note, since the invasion of Ukraine, Russia has faced limited alumina feed, with Australia (which was responsible for ~20% of total imports) banning exports of alumina and bauxite to the country in 2022, while the Russian owned alumina factory within Ukraine, Nikolaev, has been unable to operate since the invasion. We expect that this ongoing relationship between China and Russia will be maintained in the year ahead.
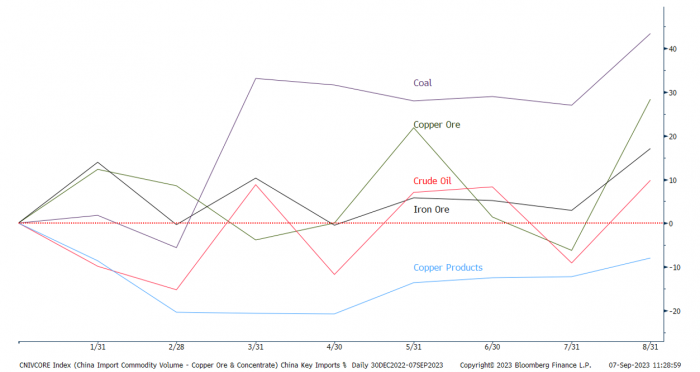
• Energy products continue to be favoured in 2023, with imports of coal and crude oil having jumped 43% and 10% YTD respectively. Please note, imports of coal in August hit their highest level on record.
Coal Imports Hit Their Highest Level on Record in August
• Imports of iron ore reversed weakening demand in the prior to months, rising to its highest level since October 2020. This is unsurprising given that we have just entered the peak construction season within China.
• Meanwhile, although imports of copper products have been unable to return to levels posted in 2022, they have been tracking higher since April, on the back of a resumption in trade from CMOC Group Ltd.’s Tenke Fungurume mine in the DRC. Please note, a dispute over royalty payments with Gecamines in the country resulted in an export ban going into place from July 2022-April 2023. We forecast that imports of refined copper may jump significantly next month, following the announcement from CMOC Group, in which it stated that they may finish shipping out all copper stockpiles (built up during the ban) this month. Please note, total stockpiles amount to ~240,000t.
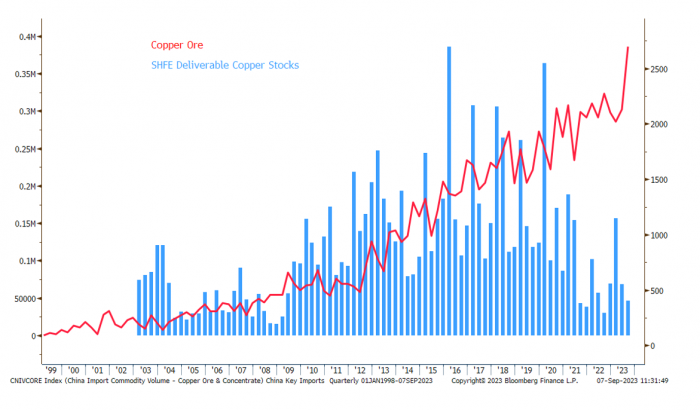
• Imports of copper ore have jumped to their highest level on record in August, with refined production supported by favourable treatments costs for smelters at ~$76/t (marking a 35% Y/Y jump). Please note here, outflows of refined SHFE deliverable copper stocks have fallen 33% on a YTD basis, falling to their lowest level in ten months.
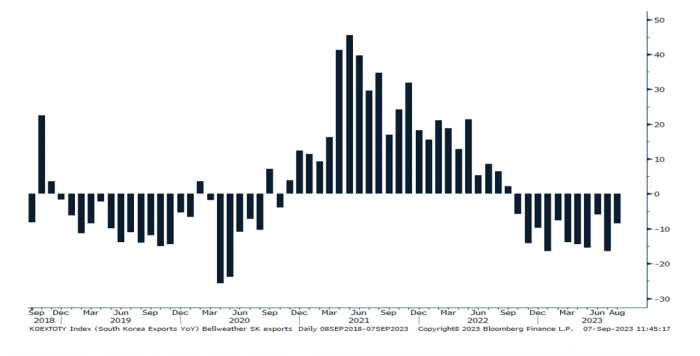
Export demand out of South Korea is typically seen as a benchmark for the health of global trade, with the pace of declines starting to reduce in recent months.