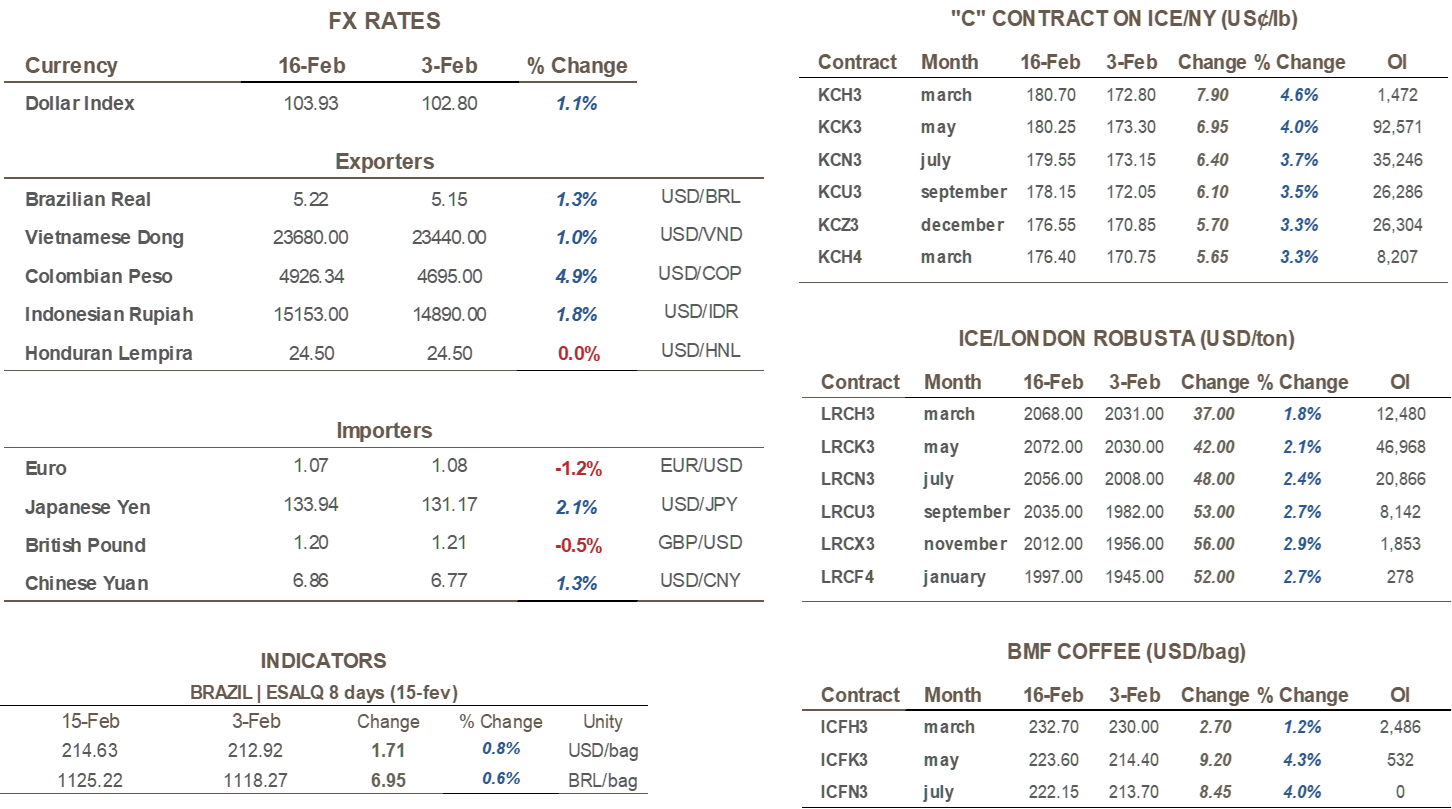
Arabica and robusta prices followed international market trends in the domestic market, ending the period higher. Between 03/02 and 16/02, the CEPEA indicator for Arabica had an increase of 5.1% to BRL 1,135.15/bag. The Robusta indicator advanced 1.6% in the same period to BRL 693.52/bag.
In the coming weeks, as the outlook for coffee production adjusts, the attention of agents will also turn to consumption conditions, which can be monitored by country export and import data, industry company results, GDP prospects, and the growth of the global economy. Still regarding production, thinking about the medium/long term, the participants will focus on the anticipation of the USDA estimates, especially for the Brazilian production in 2023, which will be published in May, through the Attaché reports.
With some important indicators to follow the movements of coffee prices, the COT/CFTC report, which brings the agents' positions in the futures markets, has remained without updates since 01/24/2023. According to the CFTC's note, a cyber incident has been the reason for the delays in the report's releases. Also, according to the note, the agency intends to resume the report's disclosures until next Friday (24).
Green coffee imports advance in the US in December;
The total volume imported increases in 2022 but still does not surpass 2019
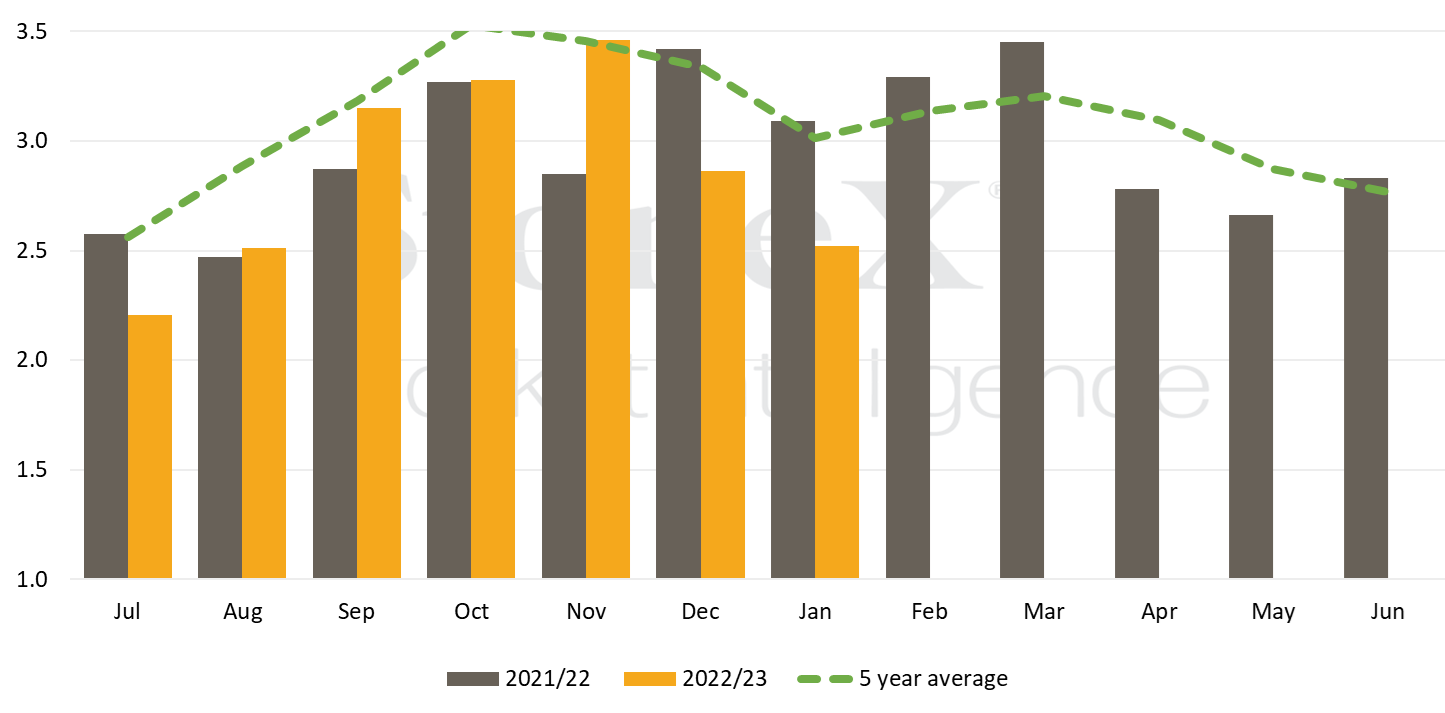
According to data released by the USDA, the US imported 1.78 million bags of green coffee in December last year, representing an increase of 16.2% compared to the previous month's imports. However, the volume is still 1.6% lower than that observed in December 2021 and 4.3% lower than the average of imports over the past three years for the month.
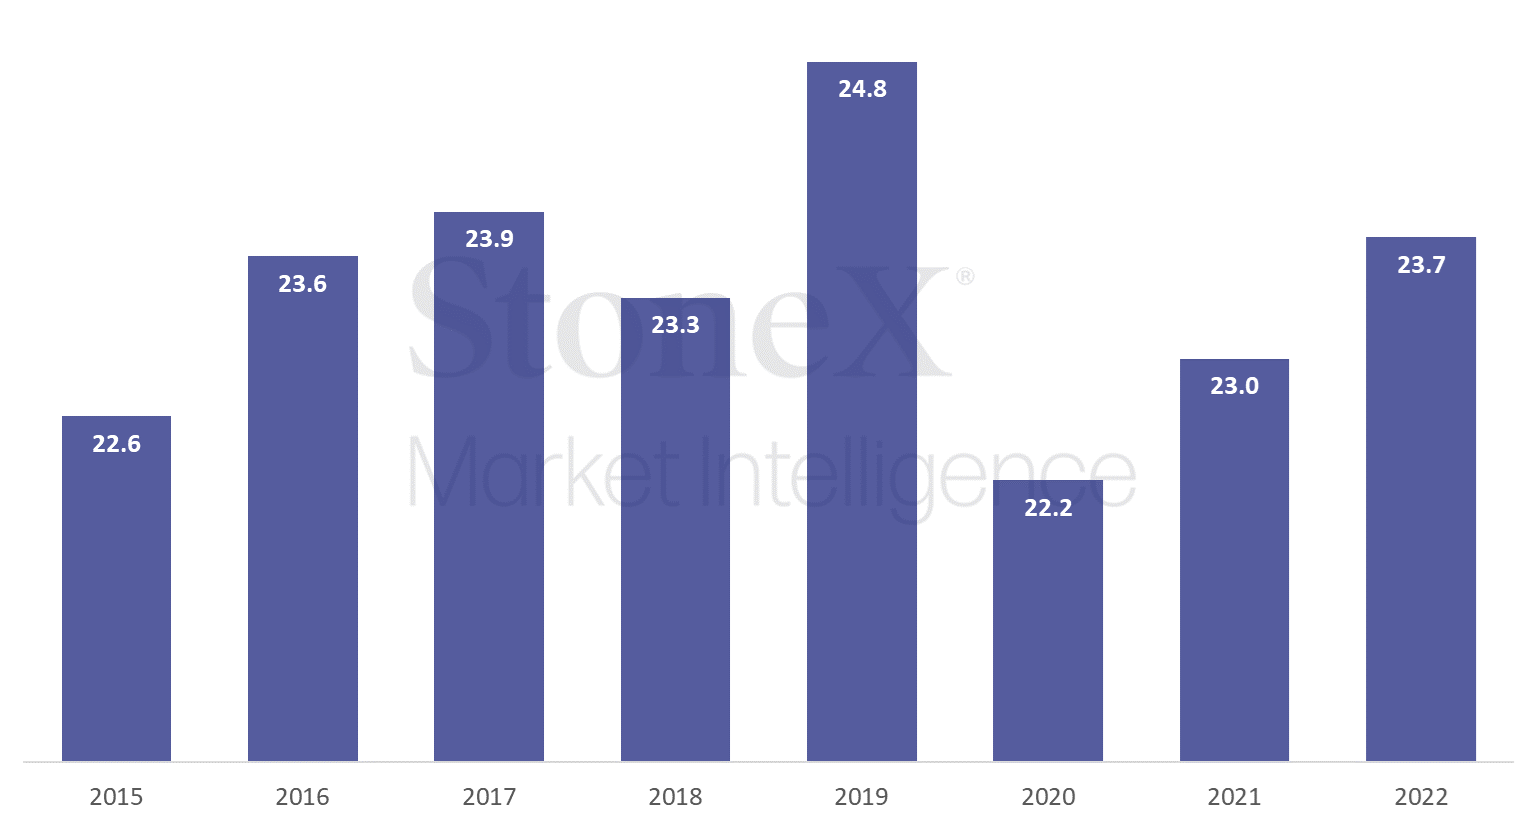
Considering total imports in 2022, the volume reached almost 23.7 million bags, representing an increase of 3.2% compared to 2021. However, this total is still 4.3% lower than the 2019 (pre-pandemic) total of over 24.7 million bags.
Coffee imports by US (million bags)
Source: USDA. Design: StoneX.
With GCA stock data and US import data from the USDA, it is possible to calculate the demand for green coffee at US ports by balancing the remaining stock in the month and the volume of imported coffee.
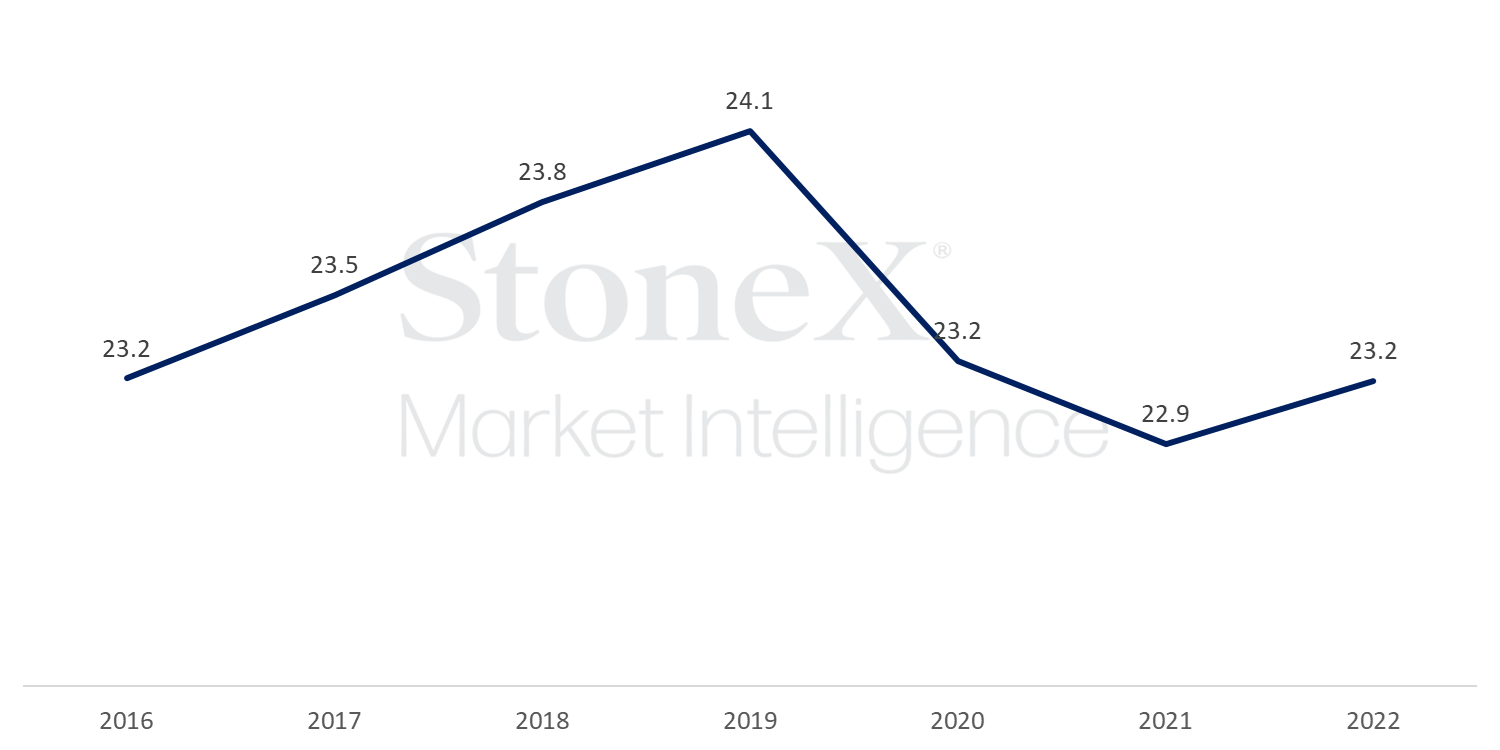
StoneX's figures for green coffee demand at ports point to 23.15 million bags in 2022, representing a subtle advance of 1% compared to the indicator in 2021. However, this figure is still 3.9% lower than the demand at ports estimated for 2019, which was 24.09 million bags. It is worth remembering that this indicator considers only green coffee at ports and does not include imports of processed coffee, which should be counted to estimate the total consumption in the country.
Calculated green coffee demand at US ports (million bags)
Source: StoneX, USDA, GCA. Design: StoneX.
GCA stocks retreated 1.77% in January to 6.264.956 bags
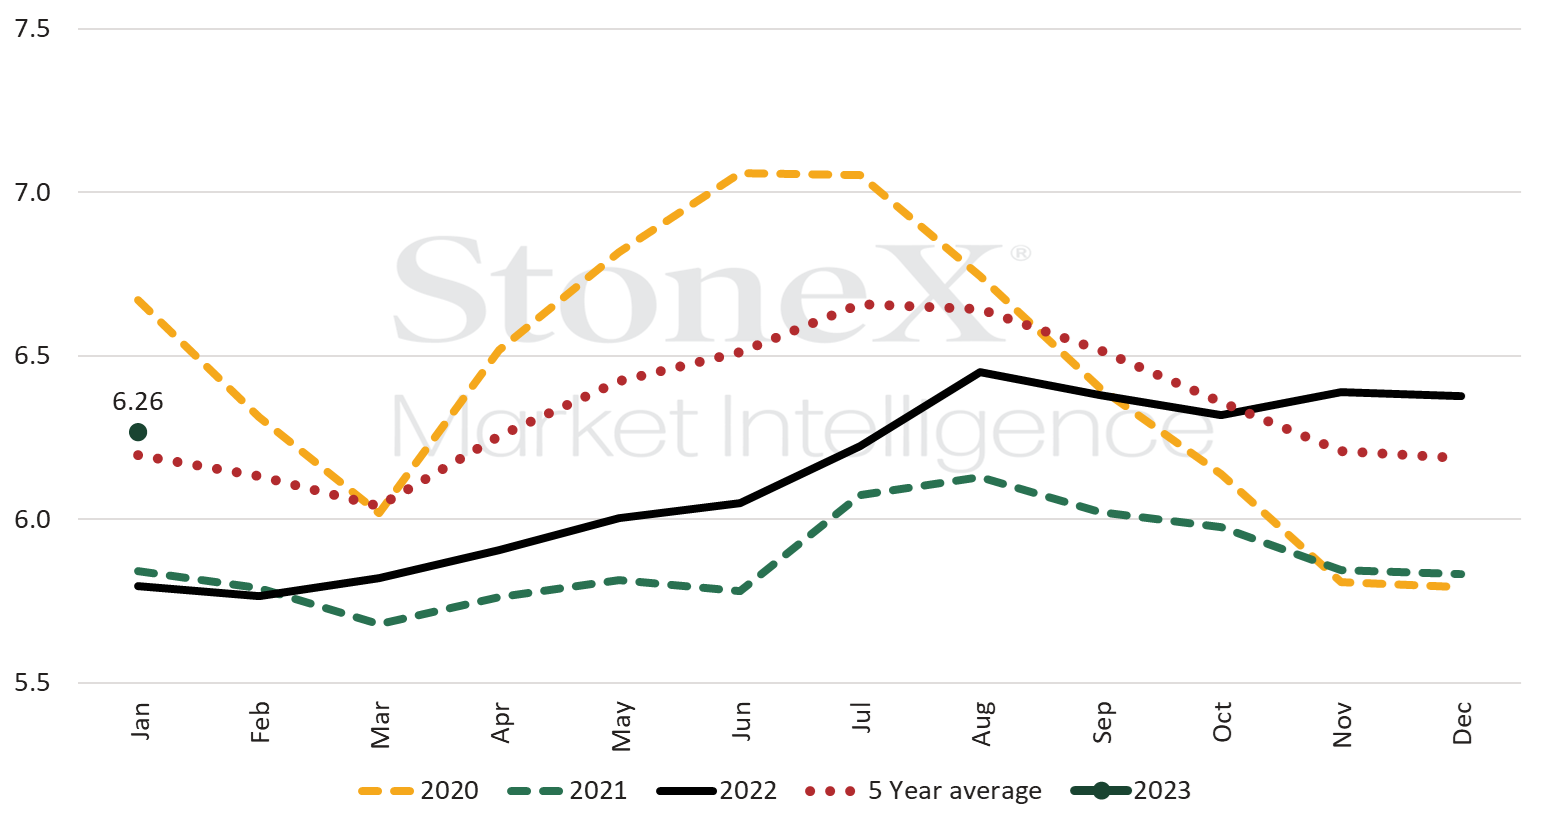
According to the latest Green Coffee Association (GCA) report, coffee stocks at American ports totaled 6.26 million bags in January, representing a drop of 112,895 bags (1.77%). Despite the decline, stocks at ports are still 8.1% higher than observed in January 2022 and 1.1% above the last 5-year average for the month.
Seasonality of coffee stocks at ports (million bags)
Source: GCA. Design: StoneX.
Brazilian green coffee exports fell 18.5% in January