
Gold 2026 Outlook: What’s in store for XAU/USD in Q2?
Gold has been on a rollercoaster ride in recent quarters - how will the precious metal fare in Q2? Read our full outlook!

Fawad Razaqzada
- Global Macro
By: Razan Hilal, Market Analyst
Crude oil prices are entering Q2 2026 at a critical inflection point, with Brent and WTI forecasts increasingly driven by US–Middle East tensions and risks to the Strait of Hormuz. As of March 27, 2026, oil prices remain elevated near the $100 range, reflecting persistent supply disruption fears, rising geopolitical risk premiums, and tightening global energy markets. This crude oil outlook explores key price scenarios, technical levels, and macro drivers shaping the oil market in the second quarter of 2026.
The Strait of Hormuz, a 21-mile chokepoint through which an estimated 20 million barrels per day, roughly 20% of global oil consumption, transits, has been effectively closed to most commercial shipping traffic since late February, triggering one of the most severe supply shocks in modern energy markets. The impact now extends beyond crude into natural gas, refined products, and fertilizers, amplifying inflationary pressures across global supply chains.
As of this writing, Brent crude trades near $106 while WTI hovers around $100, supported by a combination of geopolitical risk premiums, force majeure declarations, and tightening LNG markets.
Brent has rallied sharply year-to-date, rebounding from early-year lows near $60 to above $100, outperforming traditional hedges and moving inversely to equities, with the S&P 500 down approximately 9% year-to-date.
Asia, and to a lesser extent Europe, remain at the epicenter of this shock. Several Asian economies rely on the Middle East for 60–80% of their crude imports, while Europe remains indirectly exposed through global LNG and refined product markets.
Unlike previous cycles, the current oil market is not operating in isolation. The March 2026 escalation has introduced a multi-layered supply shock, with broader implications across:
• Energy markets (crude oil, LNG, refined fuels)
• Fertilizer supply chains (linked to natural gas flows)
• Agricultural production and food prices
• Shipping, freight, and insurance costs
The inclusion of fertilizers transforms this from an energy shock into a broader commodity chain reaction, extending inflation pressures from fuel into food. This shift increases the risk of a commodity-driven inflation regime, raising concerns around stagflation, where inflation remains elevated while growth slows.
With this critical confluence, traders are advised to manage risk in proportion to portfolio diversification, liquidity conditions, and gap risk, given the sensitivity of price action to ongoing developments and the heightened eagerness to capitalize on volatile market opportunities.
US–Iran Negotiations
Diplomatic developments remain the primary driver of sentiment:
Strait of Hormuz Developments
Markets are repricing faster than physical supply chains can adjust, creating persistent dislocations between financial pricing and real-world flows.
Inflation and Macro Spillovers
Markets will closely monitor:
Persistent inflation driven by energy and fertilizer costs could delay monetary easing and weigh on global risk assets.
Scenario 1: Escalation (Bullish Tail Risk)
This scenario appears most probable for April, given the recent involvement of the Houthis in the conflict. It reflects a high-volatility, supply-driven rally supported by hedging demand and tightening physical markets.
Scenario 2: Base Case (Volatility and Consolidation)
The $75 level remains particularly significant, aligning with prior support during the 2025 Middle East escalation phase. This scenario reflects a transitional environment where energy markets outperform while broader risk assets remain sensitive to macro developments.
Scenario 3: De-escalation (Bearish Repricing)
This scenario aligns with a disinflationary environment, easing pressure on central banks and supporting risk assets and global growth expectations.
Source: Trading view
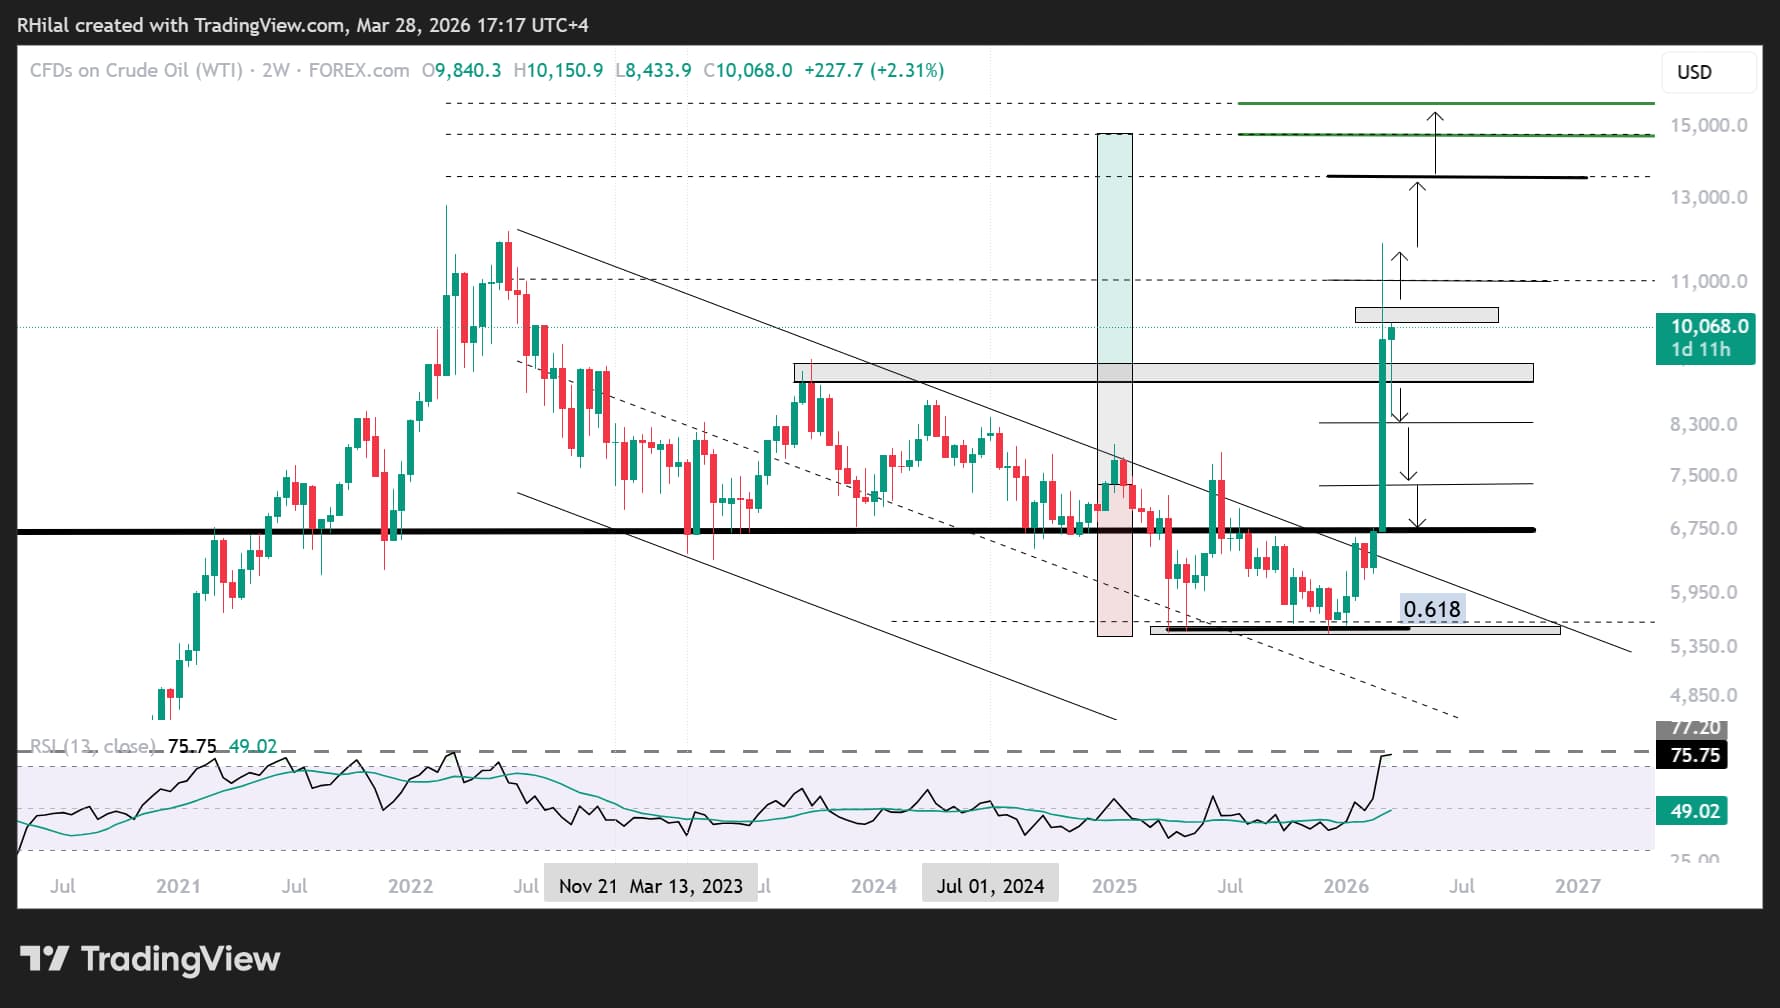
From a weekly perspective, crude oil price action is attempting to hold near the $100 mark while remaining above the September 2023 highs around $91, keeping risks tilted toward the bullish scenario.
A close above $105, $110, and $118 on WTI would extend upside projections toward the $135 and $157 zones, respectively. These levels are derived from Fibonacci extensions based on the 2020 lows, 2022 highs, and 2025 lows, defined with the monthly chart below.
Base Case Scenario
Current price action reflects ongoing ceasefire uncertainty, with fluctuations between the $100 and $80 levels. Continued uncertainty is expected to maintain consolidation, with resistance at $91, $93, and $105, and support at $89, $80, and $75.
The $75 level aligns with the highs of the 2025 Middle East escalation, acting as a key support during the initial pullback from the $120 zone, and is expected to remain relevant while the conflict persists.
Bearish Scenario
A sustained break below the $75–$73 zone, supported by clear de-escalation and firm diplomatic progress, would likely push prices toward the $66–$50 consolidation range, aligning with broader disinflation dynamics.
Source: Trading view
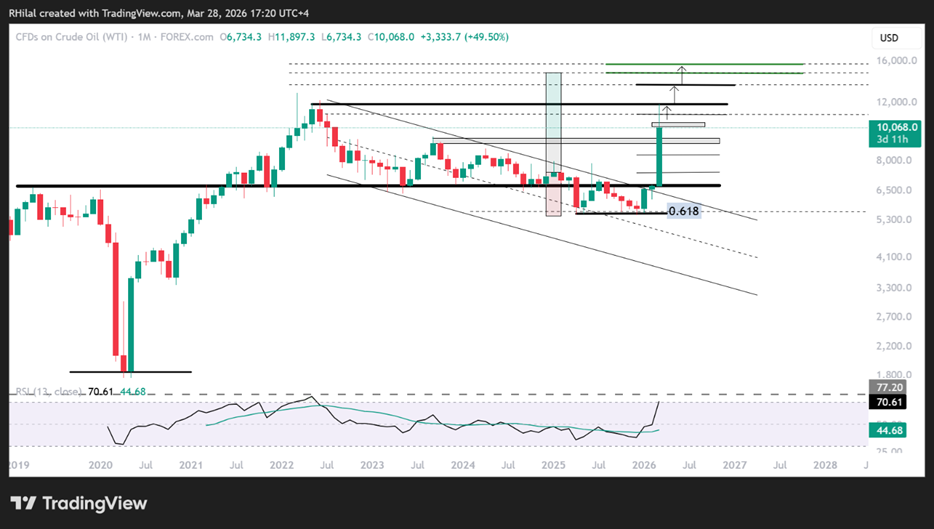
From a monthly perspective, crude oil initially broke below the 2019–2025 trendline in the second half of 2025, in line with the broader downtrend from the 2022 highs. Prices have since reclaimed this level and broken above the descending channel, supported by ongoing supply disruptions.
Using Fibonacci extensions based on the 2020 low, 2022 high, and 2025 low:
• 0.618 extension → $118 (recent high)
• 0.786 extension → $135
• Extension → $150–$157 (extended conflict scenario)
On the downside, a de-escalation-driven move could realign prices with the 2022–2026 downtrend channel, with the 0.618 retracement near $50 acting as a key long-term support.
Source: Trading view
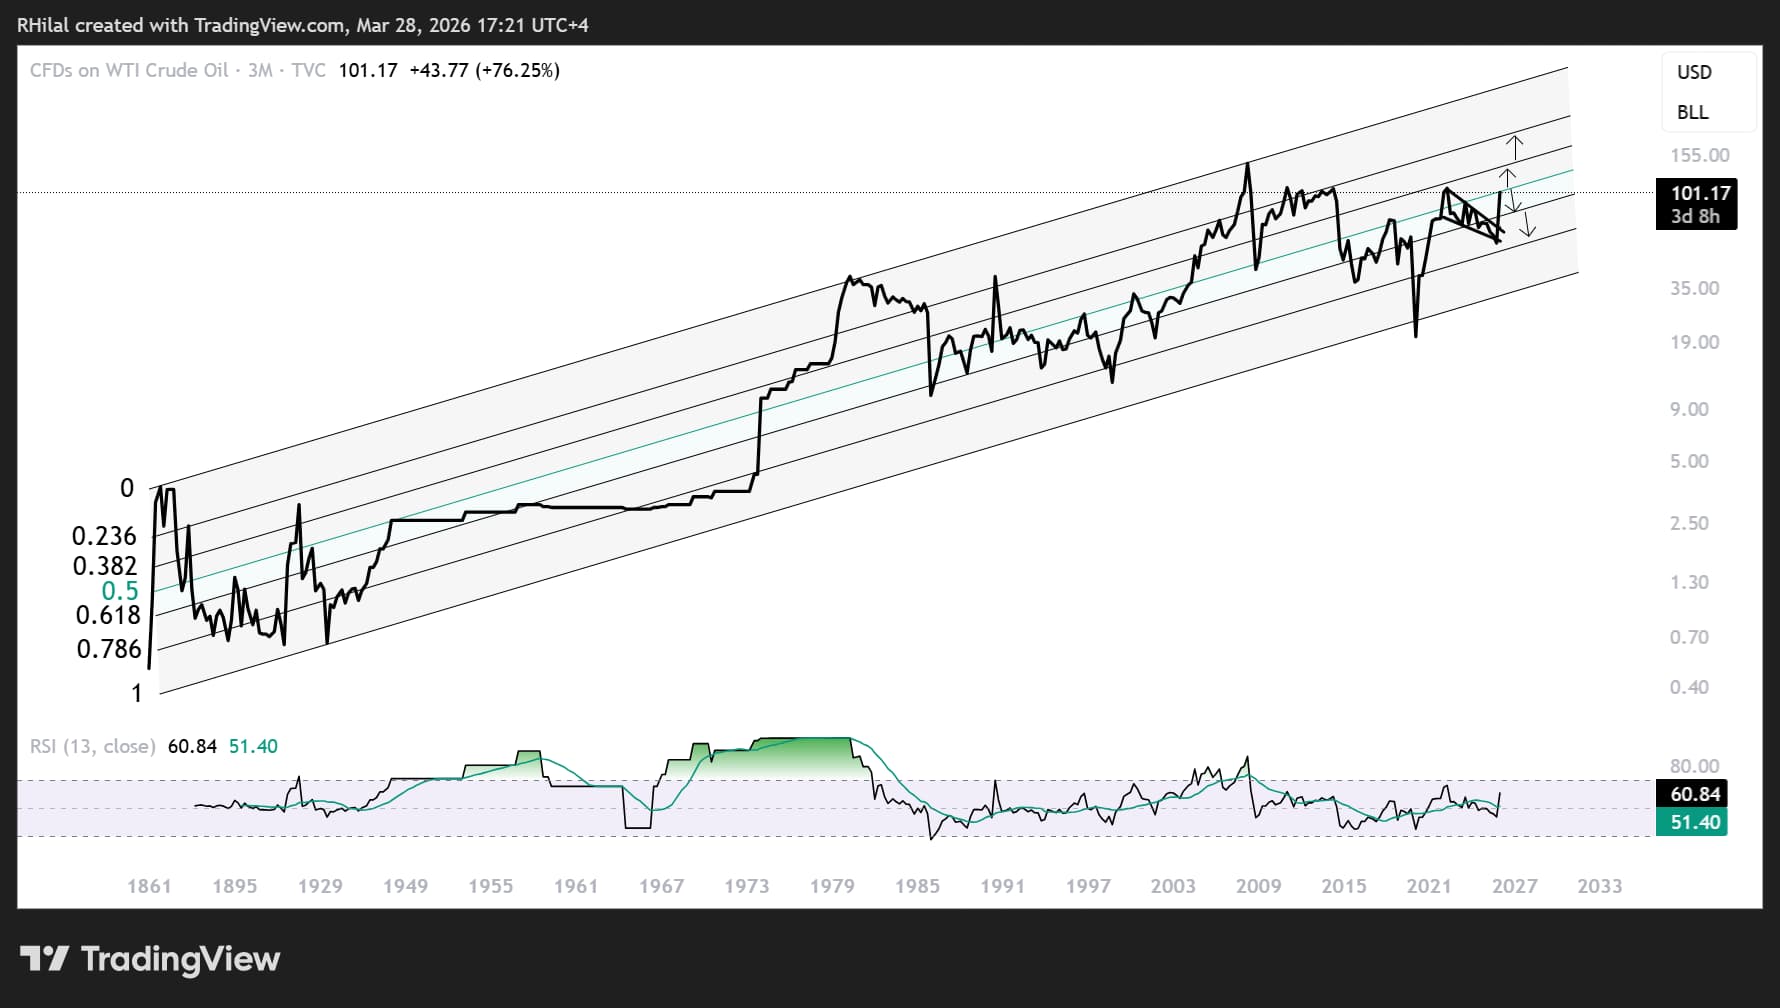
Finally, the 3-month chart highlights crude oil’s long-term trend since the 1860s, trading within a broad upward-sloping channel spanning over 160 years. A line chart is used here to emphasize closing price trends and reduce short-term volatility noise. The Fibonacci channel highlights key support and resistance levels across this timeframe.
The rebound from the April–December 2025 lows aligns with the 0.786 support level. The $80–$75 zone represents the 0.618 level, while the recent high near $118 aligns with the mid-channel 0.5 level.
Bullish Scenario:
The mid-channel zone near $118 acts as a key pivot. A sustained break above this level would extend projections toward $135, $157, and $200, signaling a potential structural shift in energy markets and increasing reliance on alternative energy sources. Markets are increasingly turning to EVs and fuel alternatives to navigate what could evolve into a prolonged upward trend in crude and broader energy markets. This scenario also raises margin risks for crude oil positions, similar to those observed in gold positions in early February.
Bearish Scenario:
A move back below the 0.618 zone near $80 would shift focus toward the $70–$50 range, suggesting an extended consolidation phase aligned with easing inflation pressures and the Trump administration’s agenda.
With multiple scenarios in play and sentiment driven by headlines, long-term trends and key levels remain essential to distinguish structural shifts from short-term noise, supporting defensive positioning and diversified trade setups in an uncertain market environment.
Written by Razan Hilal, CMT
Follow on X: @Rh_waves
This material should be construed as market commentary and represents the opinions and viewpoints of the author, and does not reflect tailored advice associated with any specific account.
The views are current only through the date stated and are subject to change at any time based upon market or other conditions, and StoneX Group Inc. (“SGI”) disclaims any responsibility to update such views. Actual results, performance, or achievements may differ materially from those expressed or implied. Information is based on data gathered from what we believe are reliable sources. Past performance does not guarantee future results.
The StoneX Group Inc. group of companies provides financial services worldwide through its subsidiaries, including physical commodities, securities, exchange-traded and over-the-counter derivatives, risk management, global payments and foreign exchange products in accordance with applicable law in the jurisdictions where services are provided.
References to certain OTC products or swaps are made on behalf of StoneX Markets, LLC (SXM), a member of the National Futures Association (NFA) and provisionally registered with the U.S. Commodity Futures Trading Commission (CFTC) as a swap dealer. SXM’s products are designed only for individuals or firms who qualify under CFTC rules as an ‘Eligible Contract Participant’ and who have been accepted as customers of SXM.
StoneX Financial Inc. (SFI) is a member of FINRA/NFA/SIPC and registered with the MSRB. SFI is registered with the U.S. Securities and Exchange Commission (SEC) as a Broker-Dealer and with the CFTC as a Futures Commission Merchant and Commodity Trading Advisor. StoneX Financial (Canada) Inc. (SFCI) is registered in Canada and is a member of CIRO and CIPF. References to certain securities trading are made on behalf of the BD Division of SFI and are intended only for an audience of institutional clients as defined by FINRA Rule 4512(c). References to certain exchange-traded futures and options are made on behalf of the FCM Division of SFI. Wealth Management is offered through SA Stone Wealth Management Inc., member FINRA/SIPC, and SA Stone Investment Advisors Inc., an SEC-registered investment advisor, both wholly owned subsidiaries of SGI.
R.J. O’Brien & Associates, LLC (RJO) is registered with the CFTC as a Futures Commission Merchant and is a member of NFA.
StoneX Financial Ltd (SFL) is registered in England and Wales, company no. 5616586. SFL is authorized and regulated by the Financial Conduct Authority (FCA) (registration number FRN:446717) to provide services to professional and eligible customers including: arrangement, execution and, where required, clearing derivative transactions in exchange traded futures and options. SFL is also authorized to engage in the arrangement and execution of transactions in certain OTC products, certain securities trading, precious metals trading and payment services to eligible customers. SFL is authorized and regulated by the FCA under the Payment Services Regulations 2017 for the provision of payment services. SFL is a category 1 ring-dealing member of the London Metal Exchange. In addition SFL also engages in other physically delivered commodities business and other general business activities which are unregulated and not required to be authorized by the FCA.
This communication is issued in the European Economic Area by StoneX Financial Europe GmbH (SFEG). StoneX is the trade name used by STONEX GROUP INC. and all its associated entities and subsidiaries. StoneX Financial Europe GmbH (“SFEG”) is a securities trading firm registered in Germany under Company No. HRB 80844.
StoneX APAC Pte. Ltd. (“SAP”) (Co. Reg. No 200616676W) is regulated as a Dealer (PS20190001002) under the Precious Stones and Precious Metals (Prevention of Money Laundering and Terrorism Financing) Act 2019 for purposes of anti-money laundering and countering the financing of terrorism. SAP is an “Approved International Trading Company” authorized to act as a “Spot Commodity Broker” under the Commodity Trading Act.
StoneX Financial Pte Ltd (Co. Reg. No 201130598R) (“SFP”) is regulated by the Monetary Authority of Singapore and is a Capital Markets Service Licence holder (for dealing in capital market products), an Exempt Financial Adviser (for advising on investment products and issuing or promulgating analyses/ reports on investment products) and a Major Payment Institution (for domestic and cross-border money transfer services).
SFP may distribute analysis/report produced by its respective foreign affiliates within the StoneX Group of companies pursuant to an arrangement under Regulation 32C of the Financial Advisers Regulations Recipients should contact SFP at (65) 6309 1000 for any matters arising from, or in connection with, this webinar.
StoneX APAC Pte. Ltd. (“SAP”) (Co. Reg. No 200616676W) is regulated as a Dealer (PS20190001002) under the Precious Stones and Precious Metals (Prevention of Money Laundering and Terrorism Financing) Act 2019 for purposes of anti-money laundering and countering the financing of terrorism.
StoneX Financial (HK) Limited (CE No.: BCQ152) (“SHK”) is regulated by the Hong Kong Securities and Futures Commission for Dealing in Securities and Dealing in Futures Contracts.
StoneX Financial Pty Ltd (ACN 141 774 727) holds an Australian Financial Service License (AFSL: 345646) for Dealing in Securities, Exchange-Traded Derivatives Contracts, OTC Derivatives Contracts and Foreign Exchange Contracts, and is regulated by the Australian Securities and Investments Commission.
StoneX Securities Co., Ltd. (“SSJ”) (Co. Reg. No 010401047199) is regulated by the Japanese Financial Services Agency as a Type-I Financial Instruments Business Operator (Kanto Local Finance Bureau (FIBO)No.291’), is a member of the Financial Futures Association of Japan for dealing and broking FX and FX Option transactions, and is a member of the Japan Securities Dealers Association for dealing and broking stock indices and option transactions.
Trading swaps and over-the-counter derivatives, exchange-traded derivatives and options and securities involves substantial risk and is not suitable for all investors. Past performance of any futures or option is not indicative of future success. Indicators are not a trading system and are not published as a specific trade recommendation. The information herein is not a recommendation to trade nor investment research or an offer to buy or sell any derivative or security. It does not take into account your particular investment objectives, financial situation or needs and does not create a binding obligation on any of the StoneX group of companies to enter into any transaction with you. You are advised to perform an independent investigation of any transaction to determine whether any transaction is suitable for you. No part of this material may be copied, photocopied or duplicated in any form by any means or redistributed without the prior written consent of StoneX Group Inc.
The report/analysis herein is not directed to, or intended for distribution to or use by, any person or entity who is a citizen or resident of or located in any locality, state, country or other jurisdiction where such distribution, publication, availability or use would be contrary to law or regulation.
© 2026 StoneX Group Inc. All Rights Reserved.
Our subscribers have access to comprehensive market analysis from StoneX spanning commodities, equities, currencies and more.
Gold has been on a rollercoaster ride in recent quarters - how will the precious metal fare in Q2? Read our full outlook!
How will major US indices fare in Q2 after the big swoon in March? Read our full outlook!

EUR/USD slides toward a make-or-break level as Fed bets shift. Can support hold or is a larger breakdown underway?

Our market expertise, advanced platforms, global reach, culture of full transparency and commitment to our clients’ success all set us apart in the financial marketplace.
Reach
With access to 40+ derivatives exchanges, 180+ foreign exchange markets, nearly every global securities marketplace and numerous bilateral liquidity venues, StoneX’s digital network and deep relationships can take clients anywhere they want to go.
Transparency
As a publicly traded company meeting the highest standards of regulatory compliance in the markets we serve, our financials and track record are matters of public record. StoneX’s commitment to “doing the right thing over the easy thing” sets us apart in the industry and helps us build respect, client trust and new partnerships.
Expertise
From our proprietary Market Intelligence platform to “boots-on-the-ground” expertise from award-winning traders and professionals, we connect our clients directly to actionable insights they can use to make more informed decisions and achieve their goals in the global markets.