StoneX logo

Daily Natural Gas Market Update 10-24-25

By: Heather Wine, Senior Risk Manager - Energy

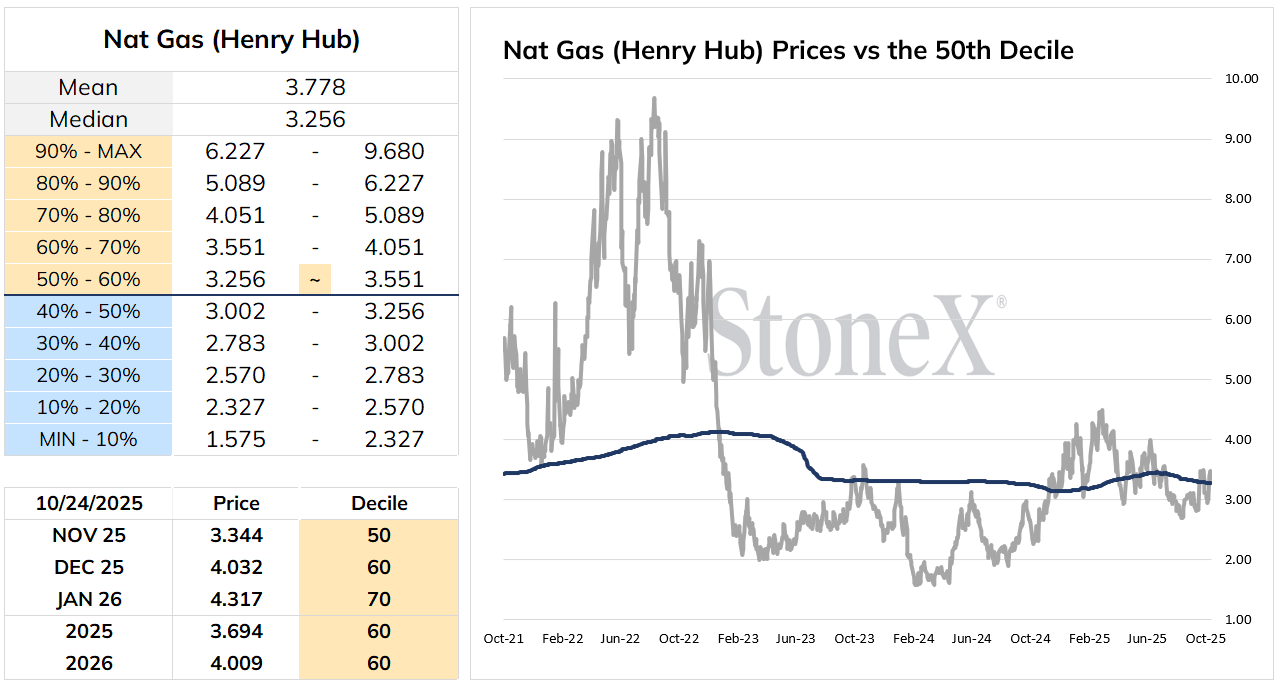
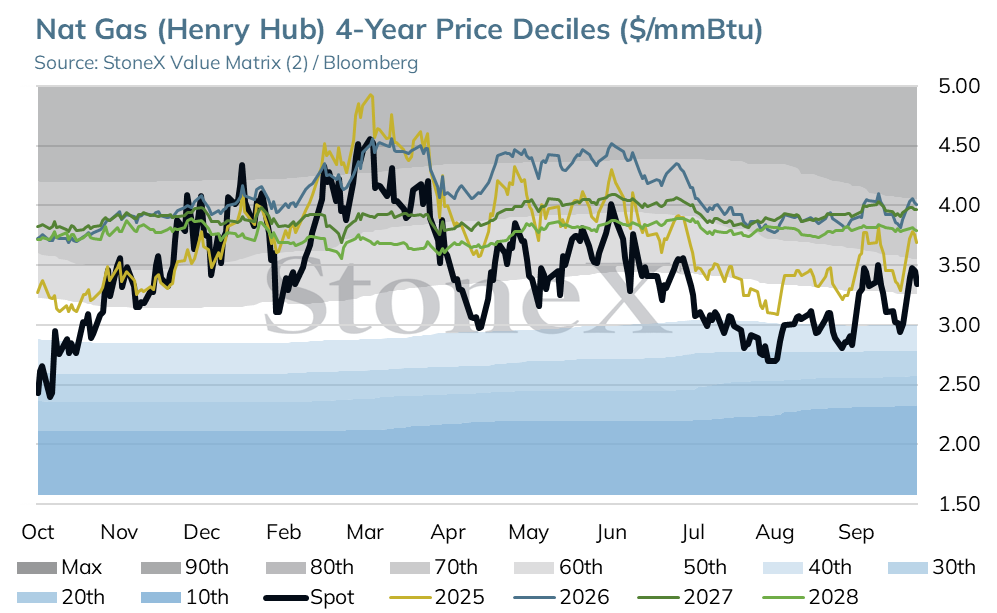
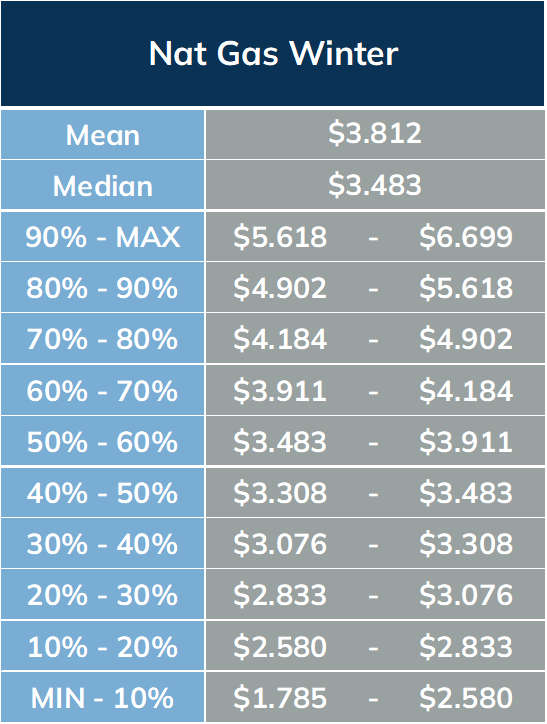
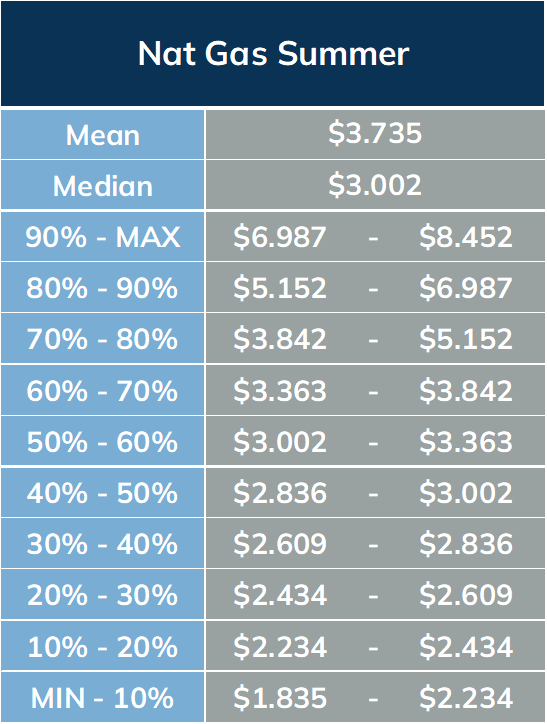
StoneX Value Matrix

image-20251024085327-1

Source: StoneX Value Matrix (2), Bloomberg

Fundamentals & Weather

Nat gas prices extended losses yesterday as a surprisingly bearish storage report overshadowed support from colder weather forecasts.  The Nov contract settled 10.6 cents lower at $3.344.  

This morning’s 6-10 day outlook leans warmer in the West and cooler in the East. Above normal temps favor the West while below normal temps are predicted from the lower Midwest to the South.  The 11-15 day period features above normal temps from the West to the Central US early to mid period while slightly below normal temps along the East Coast warm to more normal levels late in the period. 

image 121473

Source: Bloomberg, CME

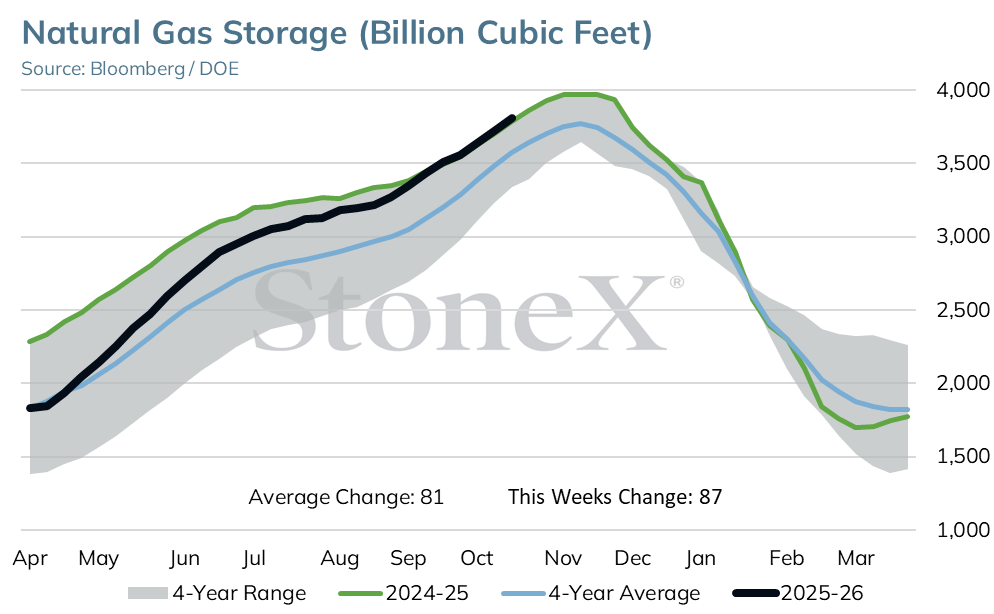
For the week ended Oct 17, the EIA reported a build of 87 BCF, bringing total gas in storage to 3.808 TCF.  The injection topped both last year and the 5 yr avg builds of 77 BCF and 79 BCF, respectively, and surpassed the average estimate by 6 BCF.  The year over year surplus is now 34 BCF while the 5 yr avg surplus stands at 164 BCF.  

The South Central region was behind the miss in expectations as renewable generation increased more than expected.  

Stocks have increased 2.035 TCF so far this injection season, the 7th largest build through this point since 2010.

Weather will be a key driver in determining whether injections continue past the traditional Oct 31 end to injection season. 

image 121474

Source: Bloomberg

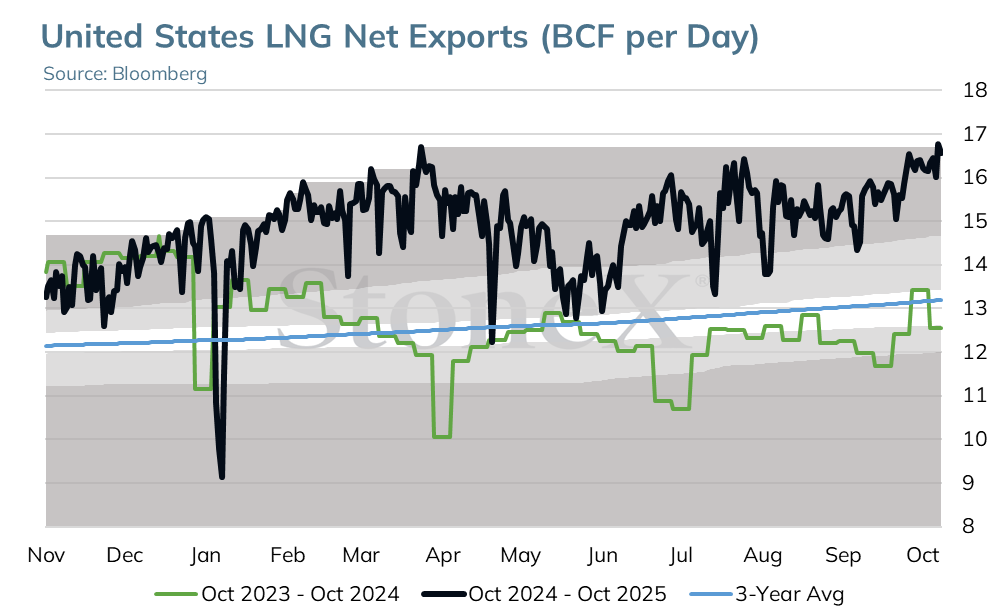
LNG activity has been consistently strong this week.  LNG feedgas hit 17.3 BCF/day yesterday as flows to Freeport increased.  Feedgas demand is down slightly as of this morning, at 17 BCF/day.  Month to date, flows are averaging 16.5 BCF/day, up 3.5 BCF/day from last year. 

Feedgas flows are expected to increase heading into the end of the year and into early 2026. Demand is estimated to reach towards 20 BCF/day this winter given new export capacity and expansions along the Gulf Coast.

image 121475Source: NOAA

The spot month is currently trading 9 cents lower as storage levels could reach toward 4 TCF prior to heating season while forecasts for early November appear less supportive across the East. 

image-20251024085453-2

Source: Bloomberg, CME

The November 25 natural gas contract has been heavily sold since topping at a 3.572 high on Wednesday.  

After losing .024 on Wednesday, the November contract lost an additional .106 (3%) on Thursday to close the day at 3.344.  

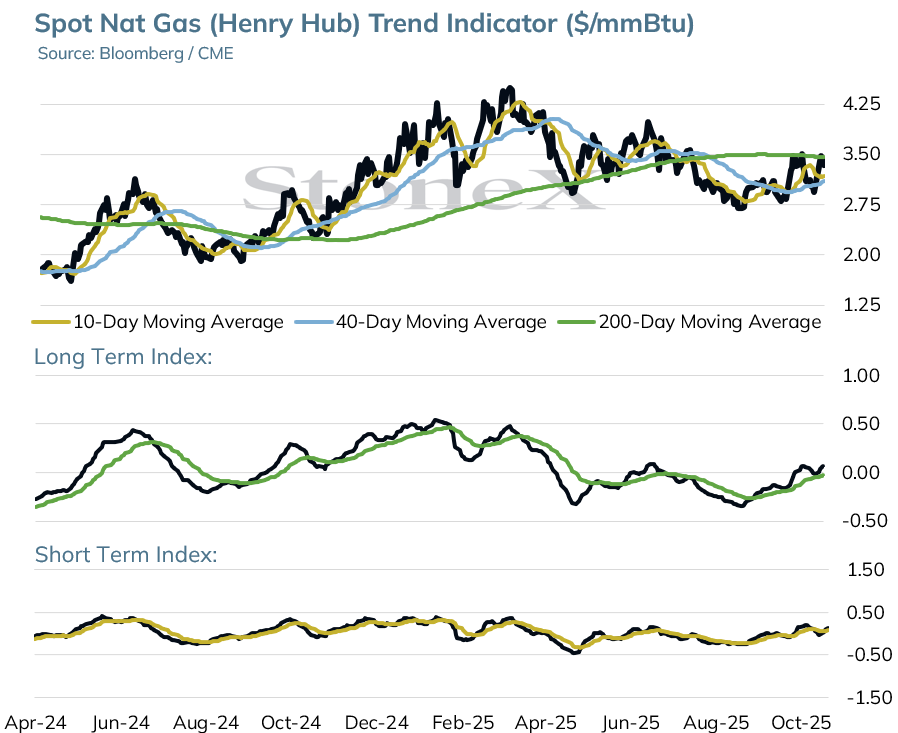
The November contract is down again in today’s early trade as it nears key support at 3.205 level.  This is the 10 day moving average on the daily continuation chart as well as the 200-minute average on the 60-minute chart.

If 3.205 support is reached and broken, the top of the gap created on Monday’s open 3.130 will become the next area of support.  

In order to close the gap, the November contract will need to trade down to 3.025.  This gap will remain a bearish technical indicator until closed. 

Wednesday’s high is technically important as it coincides with the 200 day moving average.  It is also near the level the market last topped 3 weeks ago creating a double top reversal.

As long as the 200 day moving average holds as resistance, the longer term trend will remain sideways to down.

That said, a pre-winter seasonal low appears to be in place.

Moving Average Alignment – Neutral-Bullish
Long Term Trend Following Index – Bullish
Short Term Trend Follow Following Index - Bullish

Relative Strength Index - 53.99

image 121481

Source: Bloomberg, CME

image 121479

Source: Bloomberg, CME

image 121480

Source: Bloomberg, CME

image 121477

Source: Bloomberg, CME, StoneX Value Matrix (2)

image 121478

Source: Bloomberg, CME, StoneX Value Matrix (2)

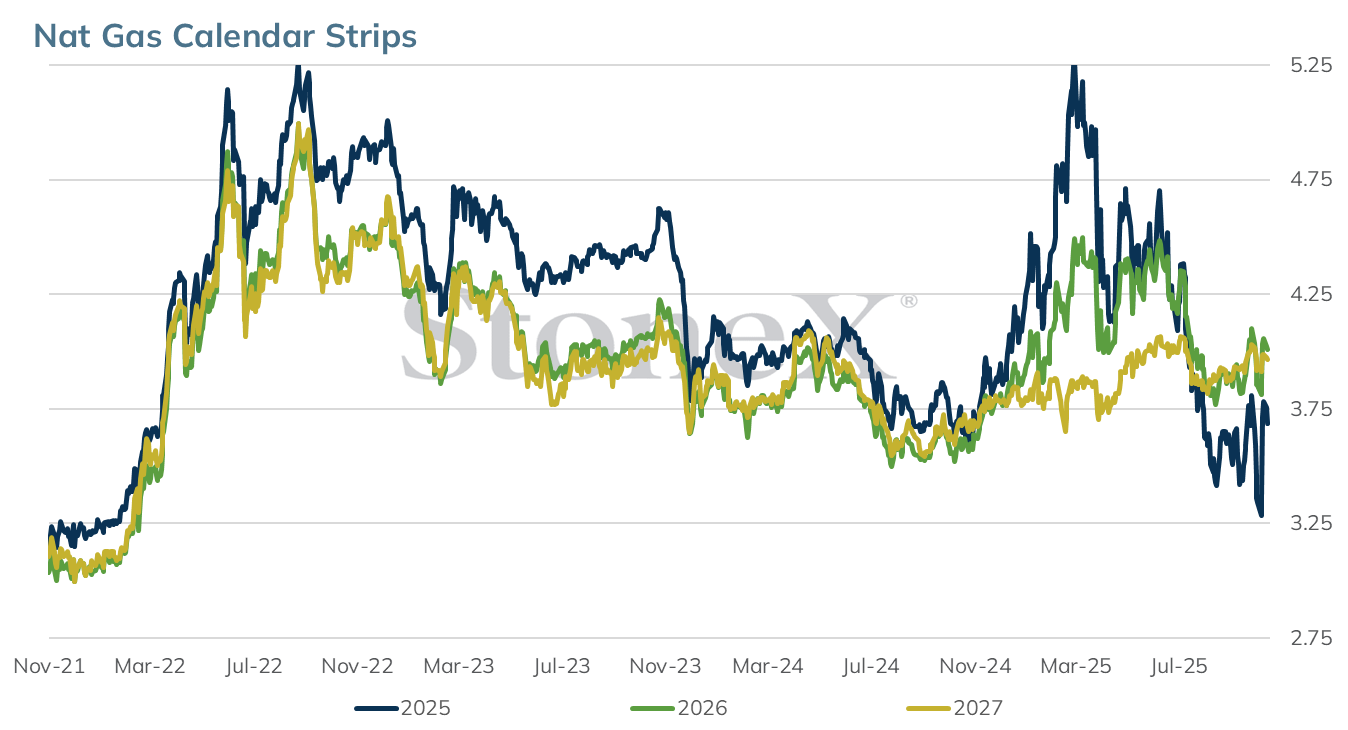
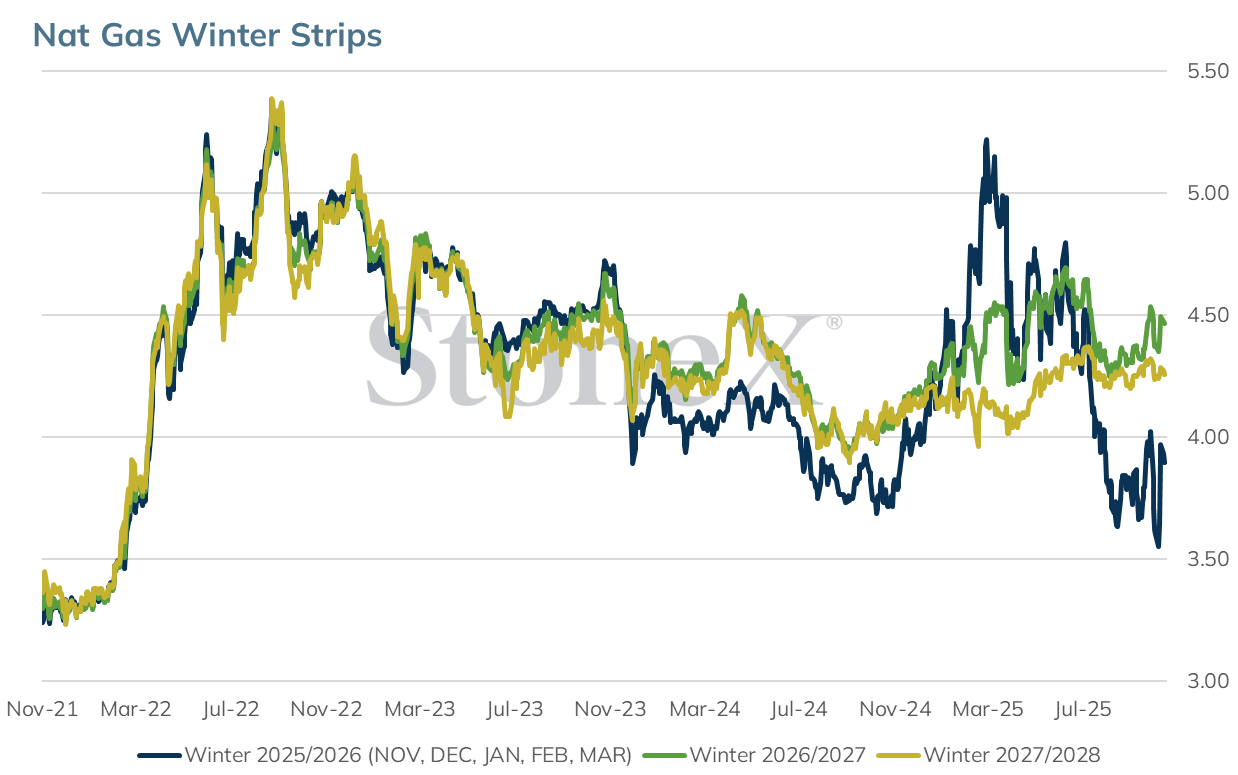
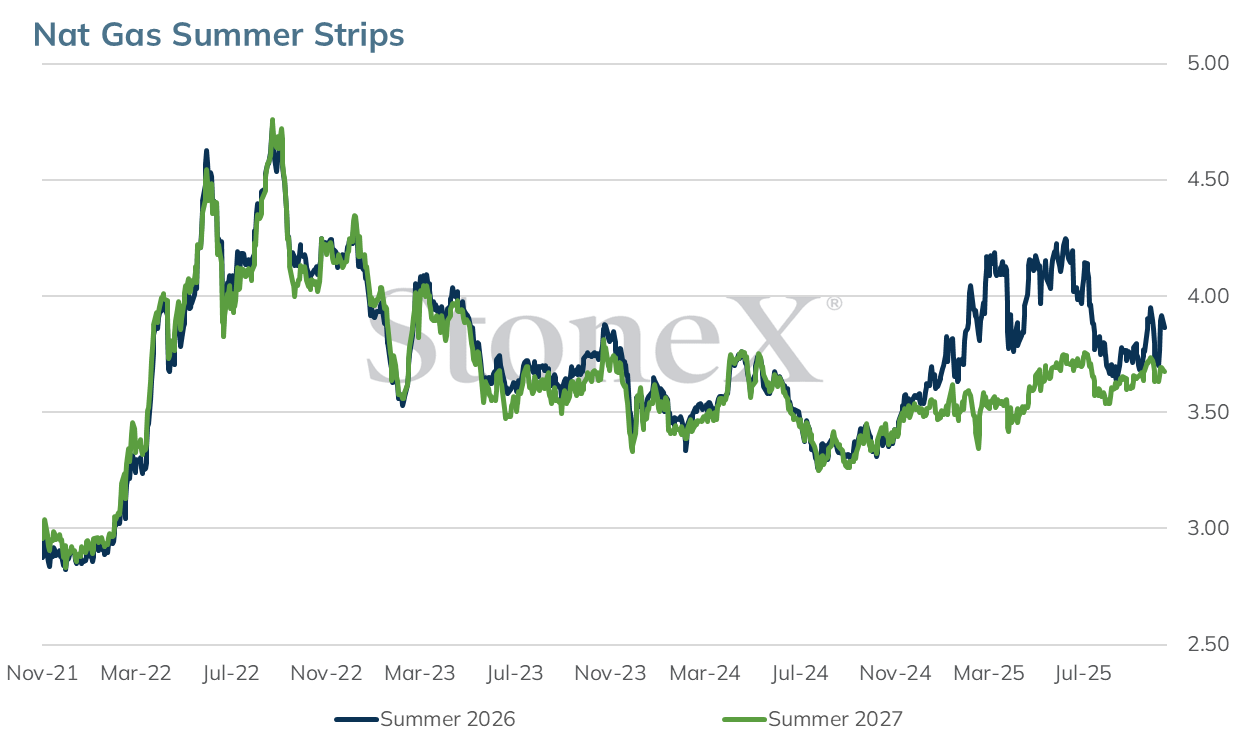
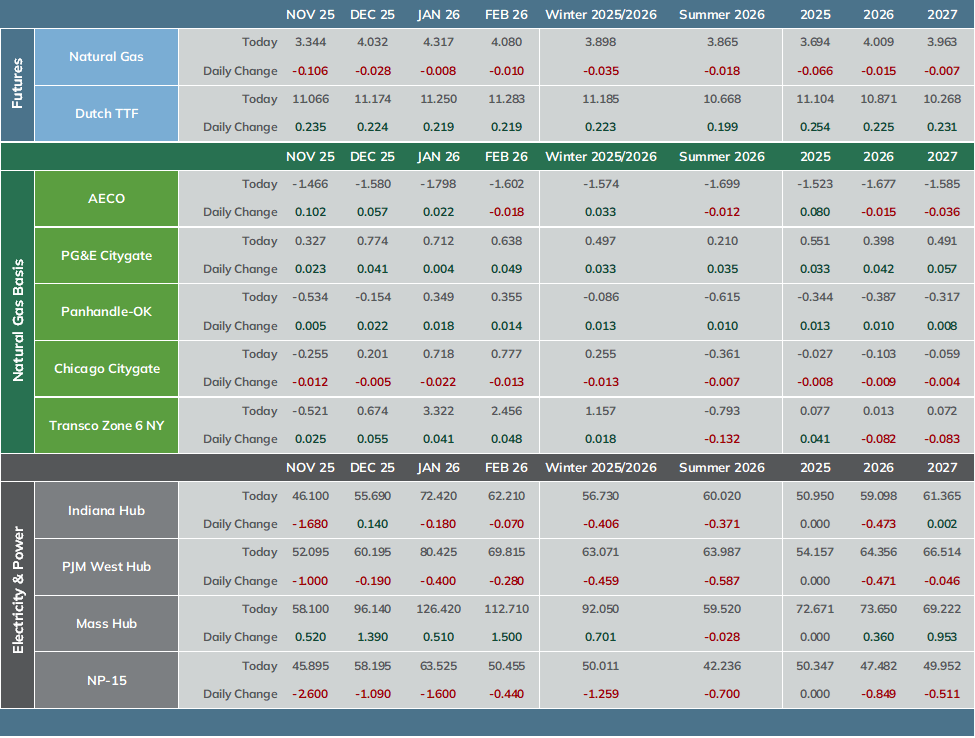
Forward Curve Pricing

image 121482

Source: Bloomberg, CME

Disclaimer
(1)  The StoneX Commodity Indicator provides an overall view of market sentiment for a commodity based on the quantification of fundamental, technical and historical market data related to that commodity.  The StoneX Commodity Indicator History graphically represents each day’s actual very bearish to very bullish signal.  This history contains the sum of all factors, excluding weather forecasts.
(2) The StoneX Value Matrix provides a measure of historical value by analyzing historical price data distributed into 10 deciles. The prices are adjusted for inflation using the Producer Price Index (PPI) published by the U.S. Bureau of Labor Statistics.
 

  • Energy

This material should be construed as market commentary and represents the opinions and viewpoints of the author, and does not reflect tailored advice associated with any specific account.


The views are current only through the date stated and are subject to change at any time based upon market or other conditions, and StoneX Group Inc. (“SGI”) disclaims any responsibility to update such views. Actual results, performance, or achievements may differ materially from those expressed or implied. Information is based on data gathered from what we believe are reliable sources. Past performance does not guarantee future results.


The StoneX Group Inc. group of companies provides financial services worldwide through its subsidiaries, including physical commodities, securities, exchange-traded and over-the-counter derivatives, risk management, global payments and foreign exchange products in accordance with applicable law in the jurisdictions where services are provided.


References to certain OTC products or swaps are made on behalf of StoneX Markets, LLC (SXM), a member of the National Futures Association (NFA) and provisionally registered with the U.S. Commodity Futures Trading Commission (CFTC) as a swap dealer. SXM’s products are designed only for individuals or firms who qualify under CFTC rules as an ‘Eligible Contract Participant’ and who have been accepted as customers of SXM.


StoneX Financial Inc. (SFI) is a member of FINRA/NFA/SIPC and registered with the MSRB. SFI is registered with the U.S. Securities and Exchange Commission (SEC) as a Broker-Dealer and with the CFTC as a Futures Commission Merchant and Commodity Trading Advisor. StoneX Financial (Canada) Inc. (SFCI) is registered in Canada and is a member of CIRO and CIPF. References to certain securities trading are made on behalf of the BD Division of SFI and are intended only for an audience of institutional clients as defined by FINRA Rule 4512(c). References to certain exchange-traded futures and options are made on behalf of the FCM Division of SFI. Wealth Management is offered through SA Stone Wealth Management Inc., member FINRA/SIPC, and SA Stone Investment Advisors Inc., an SEC-registered investment advisor, both wholly owned subsidiaries of SGI.

R.J. O’Brien & Associates, LLC (RJO) is registered with the CFTC as a Futures Commission Merchant and is a member of NFA.


StoneX Financial Ltd (SFL) is registered in England and Wales, company no. 5616586. SFL is authorized and regulated by the Financial Conduct Authority (FCA) (registration number FRN:446717) to provide services to professional and eligible customers including: arrangement, execution and, where required, clearing derivative transactions in exchange traded futures and options. SFL is also authorized to engage in the arrangement and execution of transactions in certain OTC products, certain securities trading, precious metals trading and payment services to eligible customers. SFL is authorized and regulated by the FCA under the Payment Services Regulations 2017 for the provision of payment services. SFL is a category 1 ring-dealing member of the London Metal Exchange. In addition SFL also engages in other physically delivered commodities business and other general business activities which are unregulated and not required to be authorized by the FCA.


StoneX Financial Pte Ltd (Co. Reg. No 201130598R) (“SFP”) is regulated by the Monetary Authority of Singapore and is a Capital Markets Service Licence holder (for dealing in capital market products), an Exempt Financial Adviser (for advising on investment products and issuing or promulgating analyses/ reports on investment products) and a Major Payment Institution (for domestic and cross-border money transfer services).


SFP may distribute analysis/report produced by its respective foreign affiliates within the StoneX Group of companies pursuant to an arrangement under Regulation 32C of the Financial Advisers Regulations Recipients should contact SFP at (65) 6309 1000 for any matters arising from, or in connection with, this webinar.


StoneX APAC Pte. Ltd. (“SAP”) (Co. Reg. No 200616676W) is regulated as a Dealer (PS20190001002) under the Precious Stones and Precious Metals (Prevention of Money Laundering and Terrorism Financing) Act 2019 for purposes of anti-money laundering and countering the financing of terrorism.


StoneX Financial (HK) Limited (CE No.: BCQ152) (“SHK”) is regulated by the Hong Kong Securities and Futures Commission for Dealing in Securities and Dealing in Futures Contracts.


StoneX Financial Pty Ltd (ACN 141 774 727) holds an Australian Financial Service License (AFSL: 345646) for Dealing in Securities, Exchange-Traded Derivatives Contracts, OTC Derivatives Contracts and Foreign Exchange Contracts, and is regulated by the Australian Securities and Investments Commission.


StoneX Securities Co., Ltd. (“SSJ”) (Co. Reg. No 010401047199) is regulated by the Japanese Financial Services Agency as a Type-I Financial Instruments Business Operator (Kanto Local Finance Bureau (FIBO)No.291’), is a member of the Financial Futures Association of Japan for dealing and broking FX and FX Option transactions, and is a member of the Japan Securities Dealers Association for dealing and broking stock indices and option transactions.


Trading swaps and over-the-counter derivatives, exchange-traded derivatives and options and securities involves substantial risk and is not suitable for all investors. Past performance of any futures or option is not indicative of future success. Indicators are not a trading system and are not published as a specific trade recommendation. The information herein is not a recommendation to trade nor investment research or an offer to buy or sell any derivative or security. It does not take into account your particular investment objectives, financial situation or needs and does not create a binding obligation on any of the StoneX group of companies to enter into any transaction with you. You are advised to perform an independent investigation of any transaction to determine whether any transaction is suitable for you. No part of this material may be copied, photocopied or duplicated in any form by any means or redistributed without the prior written consent of StoneX Group Inc.


The report/analysis herein is not directed to, or intended for distribution to or use by, any person or entity who is a citizen or resident of or located in any locality, state, country or other jurisdiction where such distribution, publication, availability or use would be contrary to law or regulation.


1. PRECIPICE DISCLAIMER: This communication includes data and analytics supplied by Precipice Analytics. StoneX does not own, control, create, or author this data and has not independently verified its accuracy. StoneX does not endorse its use for anything other than informational purposes. You are advised that Precipice Analytics technology may be protected by intellectual property and other rights that prohibit the unauthorized use and dissemination of the information contained herein.

2. MARKET INDICATOR DISCLAIMER: The StoneX Market Indicator provides an overall view of market sentiment for a commodity based on the quantification of fundamental, technical and historical market data related to that commodity. The StoneX Market Indicator History graphically represents each day’s actual very bearish to very bullish signal. This history contains the sum of all factors, excluding weather forecasts.

3. VALUE MATRIX DISCLAIMER: The StoneX Value Matrix provides a measure of historical value by analyzing historical price data distributed into 10 deciles. The prices are adjusted for inflation using the Producer Price Index (PPI) published by the U.S. Bureau of Labor Statistics.


© 2026 StoneX Group Inc. All Rights Reserved.

Satellite view of Earth at night showing illuminated cities across Asia and the Middle East

Discover more insights

Our subscribers have access to comprehensive market analysis from StoneX spanning commodities, equities, currencies and more.

Related articles for Energy

Perspective: Morning Commentary for August 10

August 10 – The world commodity markets and economy remains at risk amid two wars this morning. Tensions continue to escalate in both the Middle East and the Black Sea – risking pulling other countries into the conflicts. Stocks are down modestly this morning as we start a week of trade in which we’ll see key inflation and retail sales data following a weak jobs report this past Friday. Yet, stocks continue to trade just below record high levels, with the VIX trading near 2026 lows just above 15. The dollar index is trading near 99.7. Yields on 10-year Treasuries are trading near 4.68%, while yields on 2-year Treasuries are trading near 4.23%. The energy and food-based markets are firmer today amid the escalated risks. WTI crude oil is trading near $80, while Brent trades near $85 per barrel. Double-digit gains in the winter wheat markets lead the way for higher grain and oilseed prices.

Arlan Suderman
Arlan Suderman
  • Grains & Oilseeds
  • Energy
  • Dairy
  • Renewable Fuels
  • Cocoa
  • Coffee
  • Cotton
  • Sugar
  • Meats & Livestock
  • Forest Products

WTI and Brent Crude Are Now Reading the Strait of Hormuz Differently

WTI and Brent crude are moving to different beats as a possible U.S. Iran deal reshapes the oil market. The two benchmarks are pricing Strait of Hormuz risk in their own ways, and the gap between them says a lot about where crude goes next.

Editorial Team
Editorial Team
  • Energy

Perspective: Morning Commentary for August 7

August 7 – The U.S. economy unexpectedly lost 23k jobs in July, dramatically below market expectations of an 80k increase and marking the worst Non-Farm Payrolls print since February. Furthermore, May and June were both revised sharply downward, with combined revisions showing 103k fewer jobs than previously reported. Outside of the healthcare sector, which added 22k jobs in July, the losses were very broad-based. Government payrolls saw the largest decline, shedding 53k jobs in July, the largest seen since October 2025, while June was revised down to show a loss of 10k jobs as well. The private sector at least saw growth, adding 30k jobs in July, now matching the month prior after it was revised down from the 49k initially reported, and substantially missing forecasts of 78k jobs being added. This is a sharp reversal in course from the largely better than expected U.S. labor data seen earlier this week.

Mike Castle
Mike Castle
  • Grains & Oilseeds
  • Energy
  • Dairy
  • Renewable Fuels
  • Cocoa
  • Coffee
  • Cotton
  • Sugar
  • Meats & Livestock
  • Forest Products
StoneX: We open markets

Our market expertise, advanced platforms, global reach, culture of full transparency and commitment to our clients’ success all set us apart in the financial marketplace.

Reach

With access to 40+ derivatives exchanges, 180+ foreign exchange markets, nearly every global securities marketplace and numerous bilateral liquidity venues, StoneX’s digital network and deep relationships can take clients anywhere they want to go.

Transparency

As a publicly traded company meeting the highest standards of regulatory compliance in the markets we serve, our financials and track record are matters of public record. StoneX’s commitment to “doing the right thing over the easy thing” sets us apart in the industry and helps us build respect, client trust and new partnerships.

Expertise

From our proprietary Market Intelligence platform to “boots-on-the-ground” expertise from award-winning traders and professionals, we connect our clients directly to actionable insights they can use to make more informed decisions and achieve their goals in the global markets.