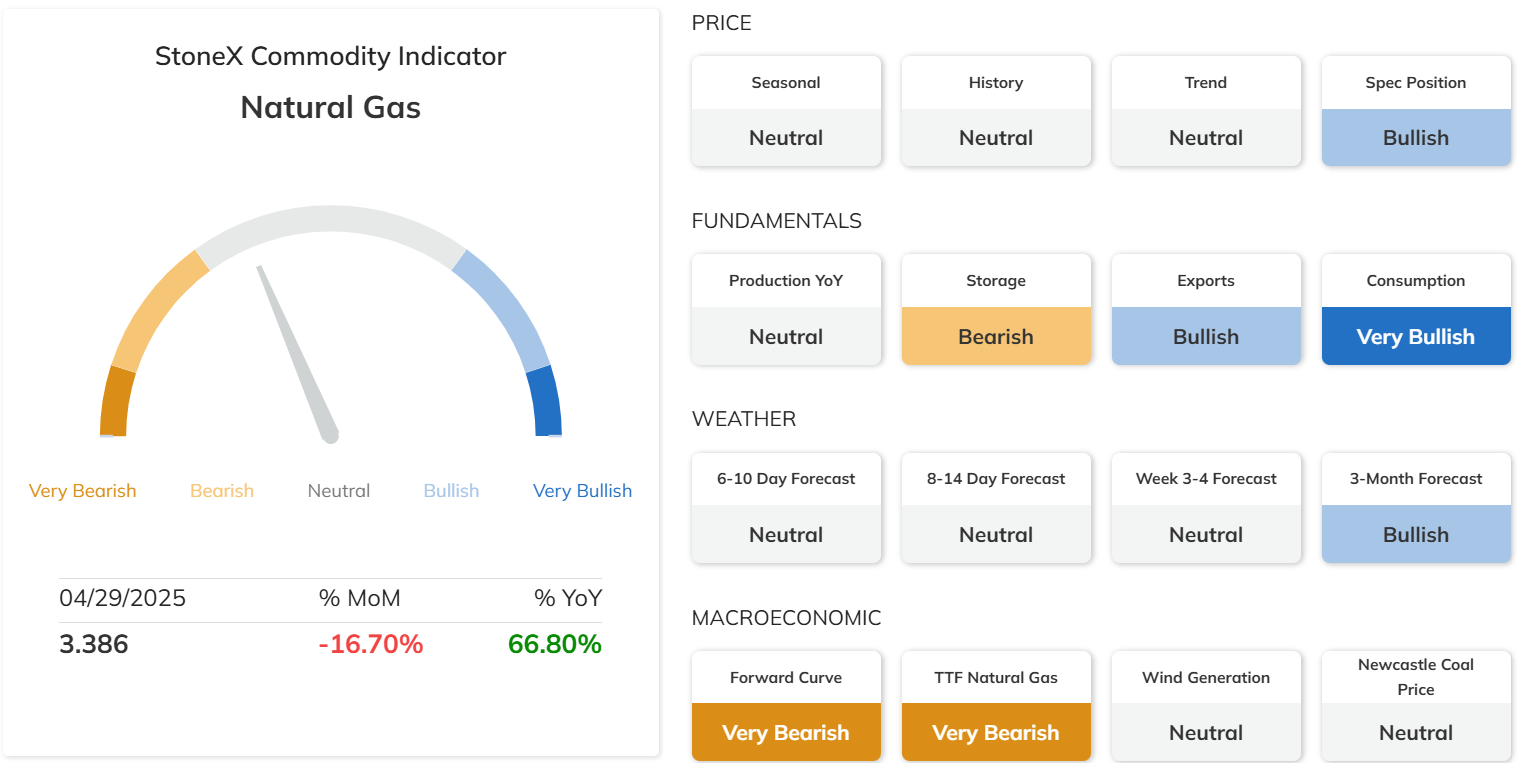
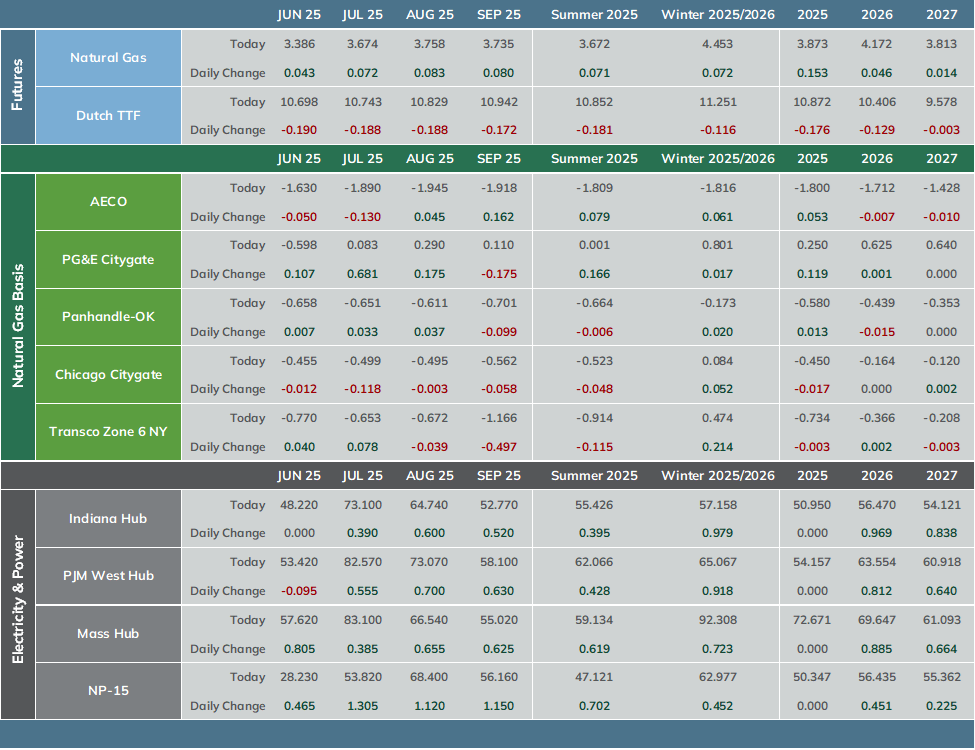
The market continued to strengthen yesterday as bullish technical factors outweighed fundamentals. Reports of LNG approvals were considered bullish while weather models continue to show neutral conditions for the next 2 weeks with injection estimates very bearish. The June contract settled 4.3 cents higher at $3.386.
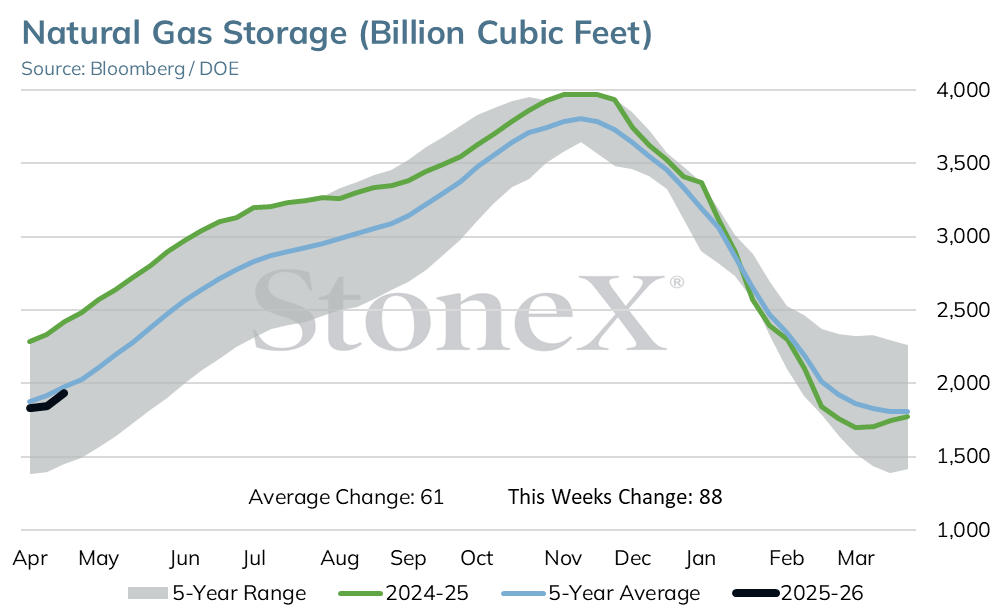
A possible, triple digit storage surplus could develop by the end of May given current injection estimates. Platts is calling for a build of 110 BCF for the week ended Apr 25, which would be almost double the 5 yr avg build of 58 BCF and would exceed last year’s build of 64 BCF. Reuters’s estimate is lower at 89 BCF. If the Platts estimate is correct, the 13 week deficit to the 5 yr avg would reverse to an 8 BCF surplus. Another triple digit build is expected for the week in progress with estimates ranging from 95 to 117 BCF.
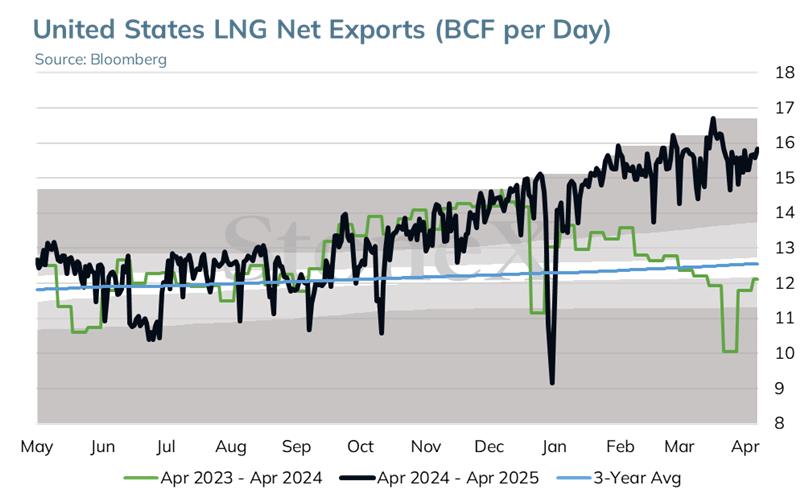
Marking a major development forward, Golden Pass has received FERC authorization to begin commissioning several components of its LNG terminal in Texas. Once fully operational, the terminal is expected to play a big part in the expansion of US LNG exports.
Woodside Energy is also moving forward with a $17.5 million LNG project in Louisiana that 16.5 mt/yr. Production on the project’s 3 separate trains with a 16.5 mt/yr capacity is expected to startup in 2029. The project also has the possibility of adding 2 more trains, leaving total capacity at 27.6 mmt/yr.
Platts revised its final output estimate for Tuesday down to 105 BCF/day. Output for today is pegged at 105.5 BCF/day. Production has retreated recently but is expected to trend higher as maintenance slows on the Permian pipeline while Haynesville output continues to ramp up in response to higher prices for summer and next winter.
Prices are lower this morning in tandem with weakness in crude oil and equity markets. June NG is currently trading 9 cents lower.
Technical Analysis
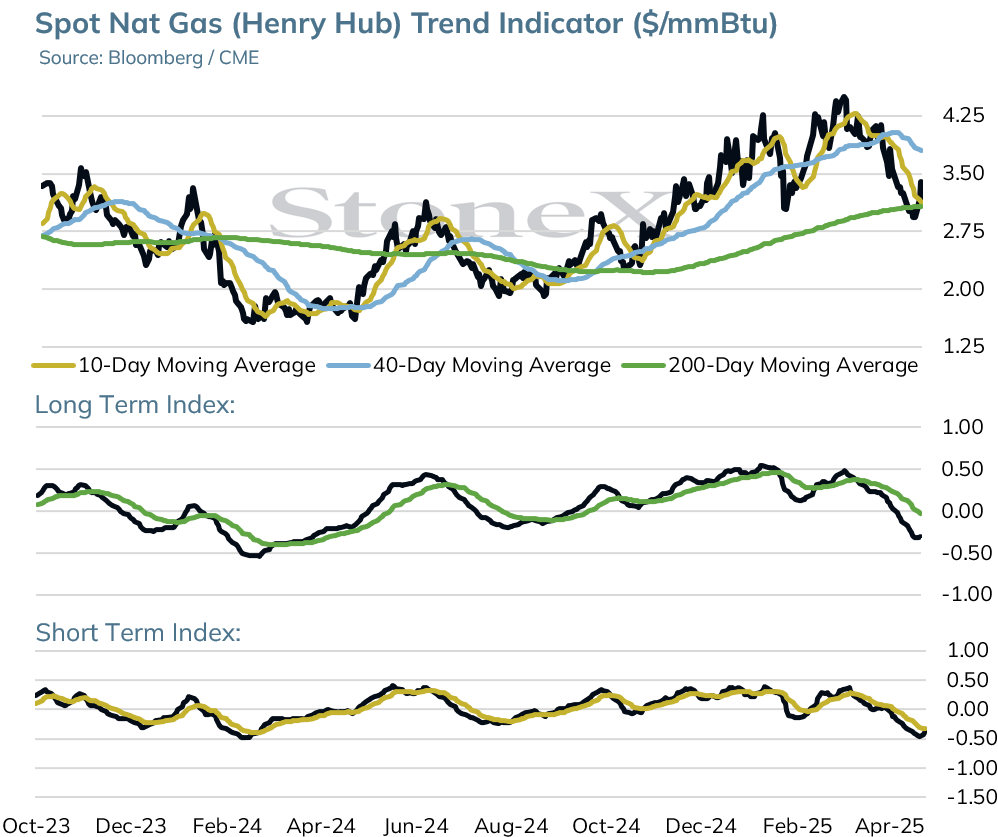
Prompt month June futures continued the rally post expiration, settling at $3.386 – up .043 cents. Due to the roll from May to June futures, there is now a gap between $3.307 - $3.18. If the market does not trade lower and fill the gap this week, that is another sign of more long-lasting low.
Resistance for June now sits at yesterday’s high of $3.457 and the April 14th high of $3.613. Support is yesterday’s low of $3.307 as well as the 10-day moving average at $3.120 and the 200-day moving average at $3.080.
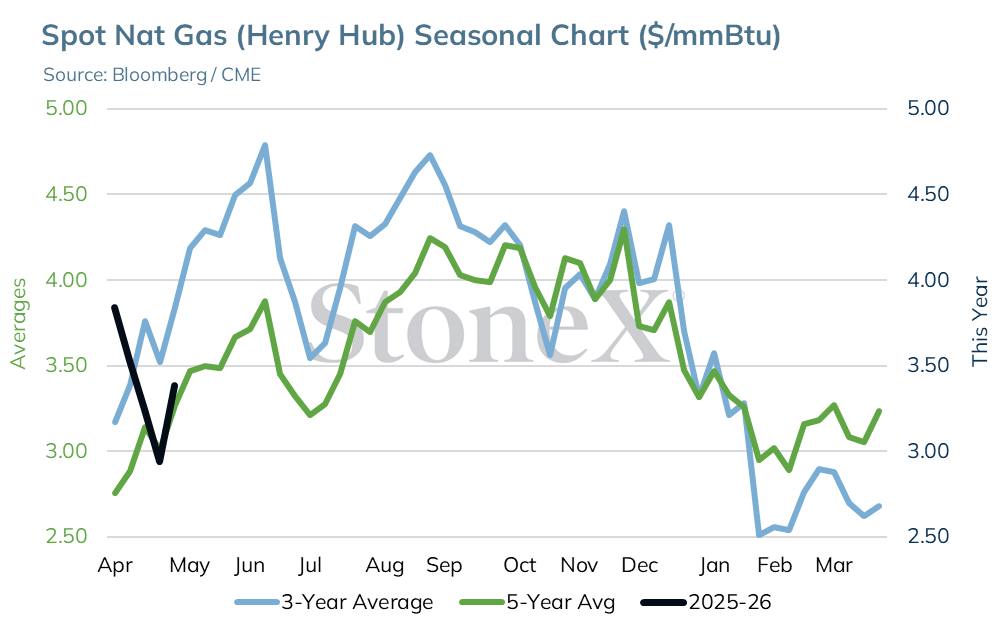
Seasonal strength from a 4 -year historical perspective continues for the next five weeks before a weaker July. Prices after that tend to move higher into September.
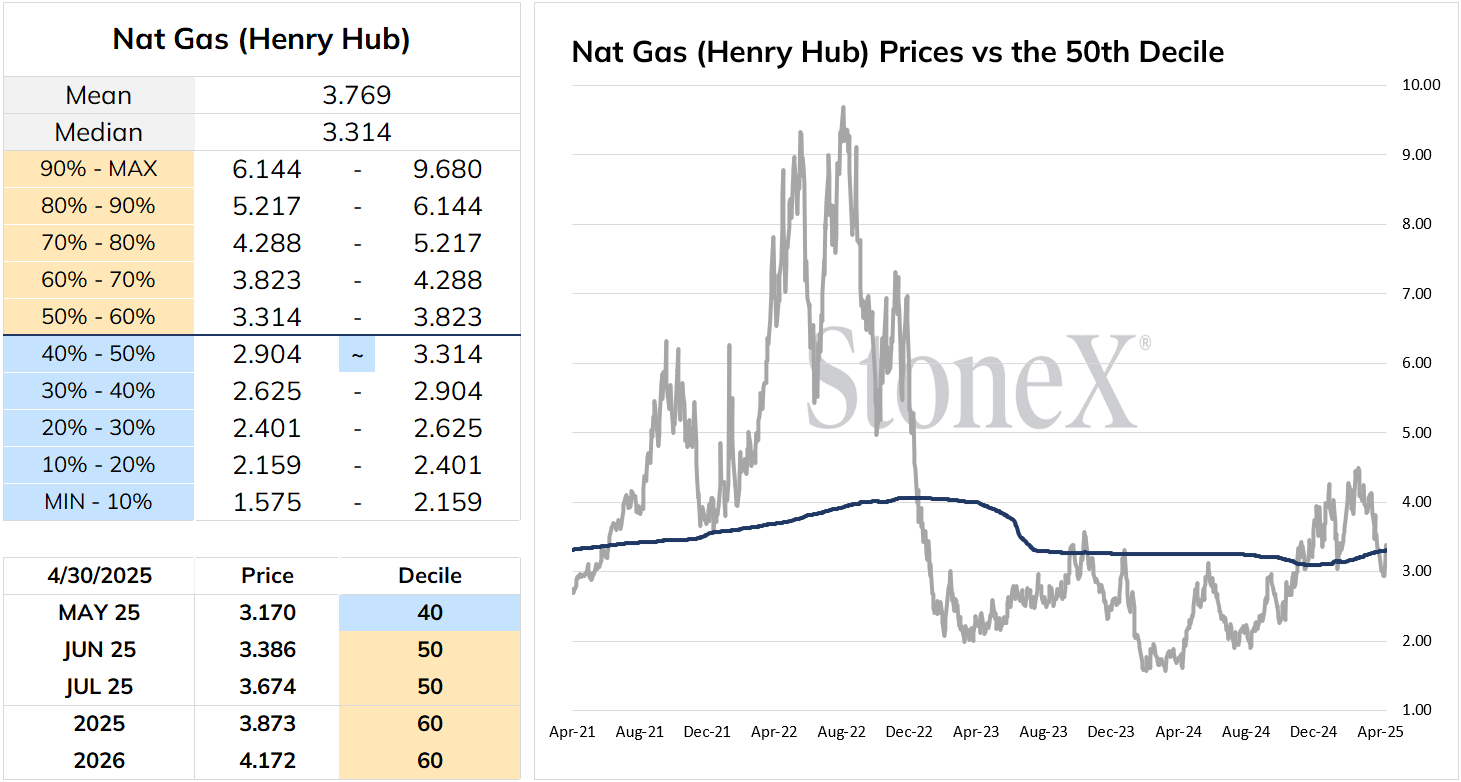
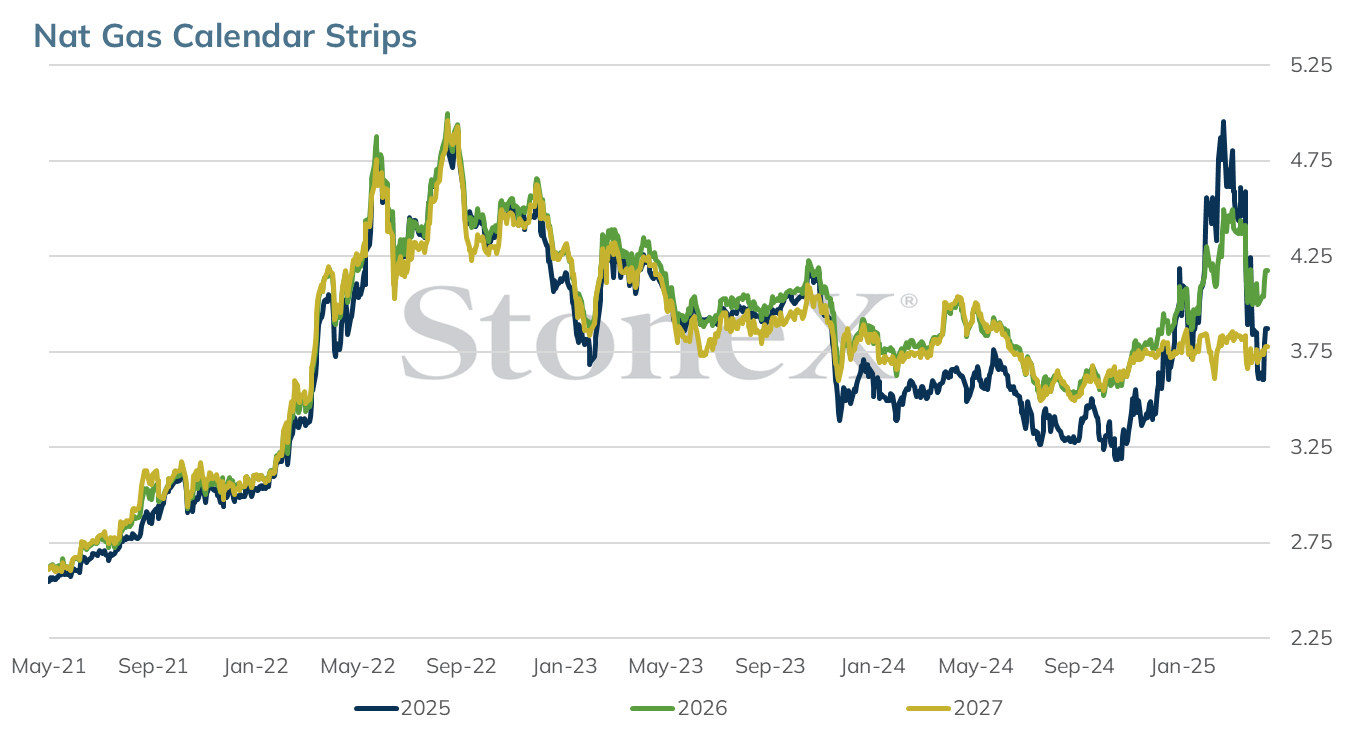
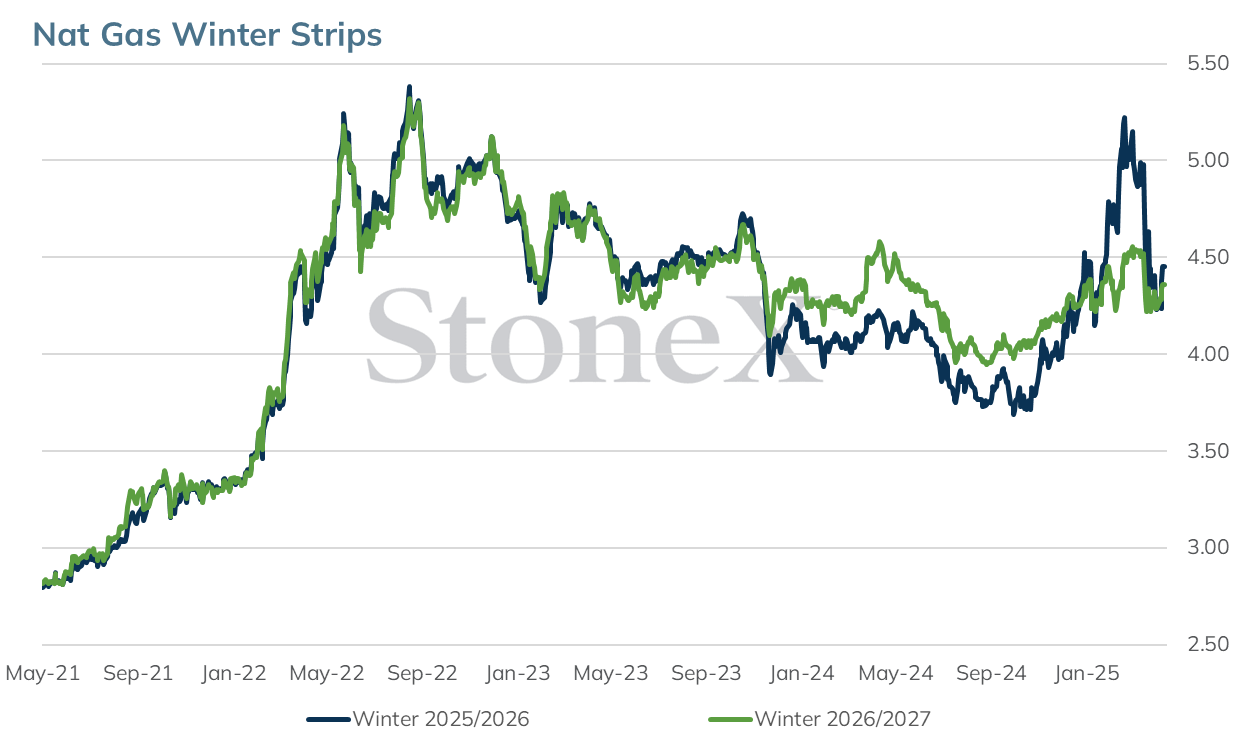
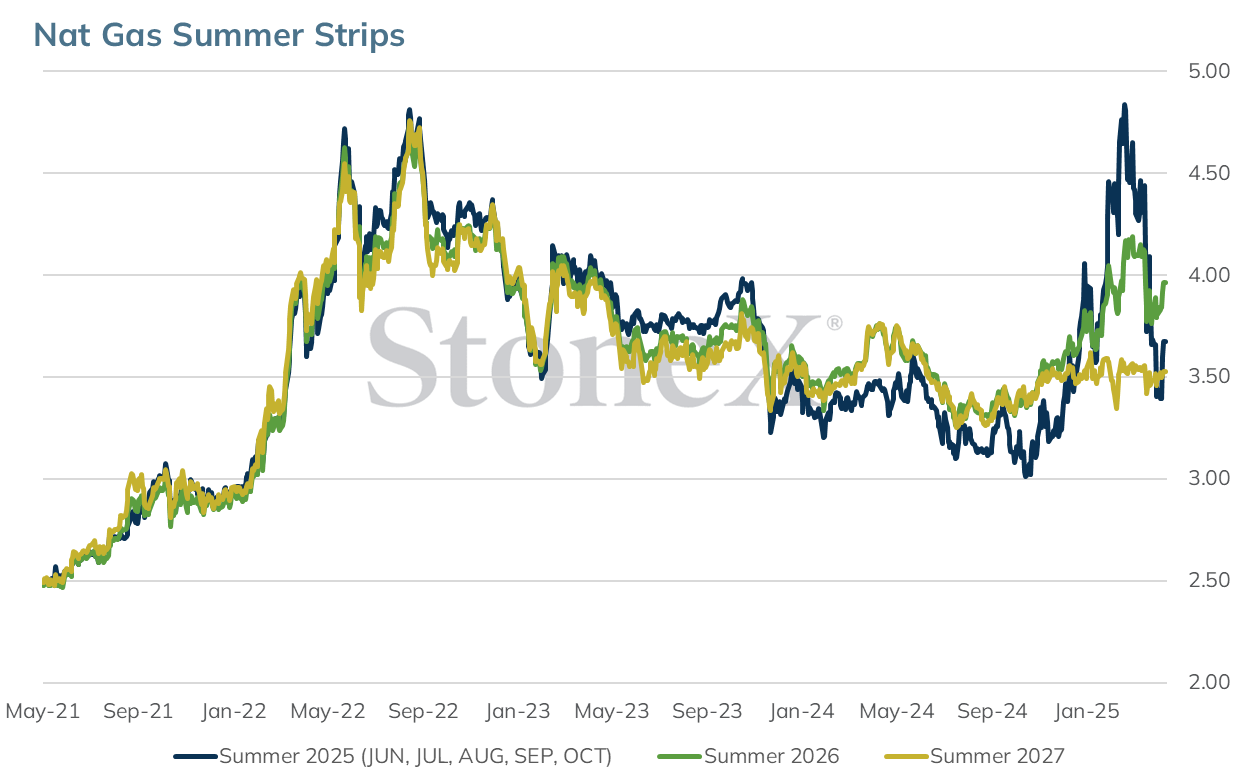
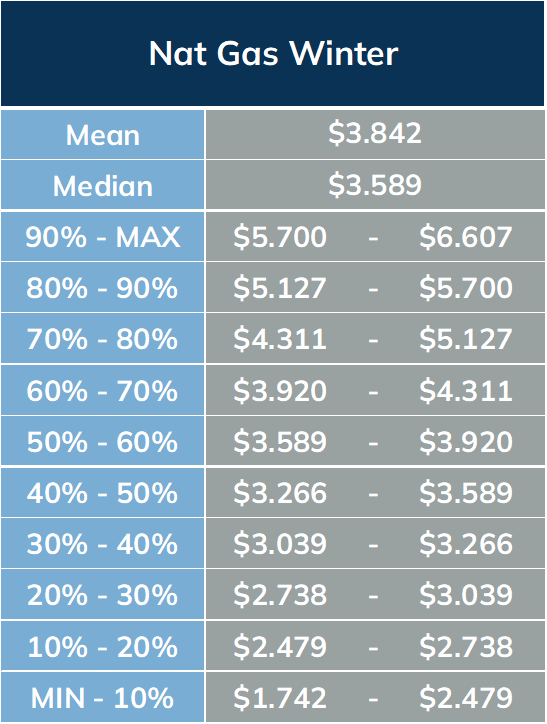
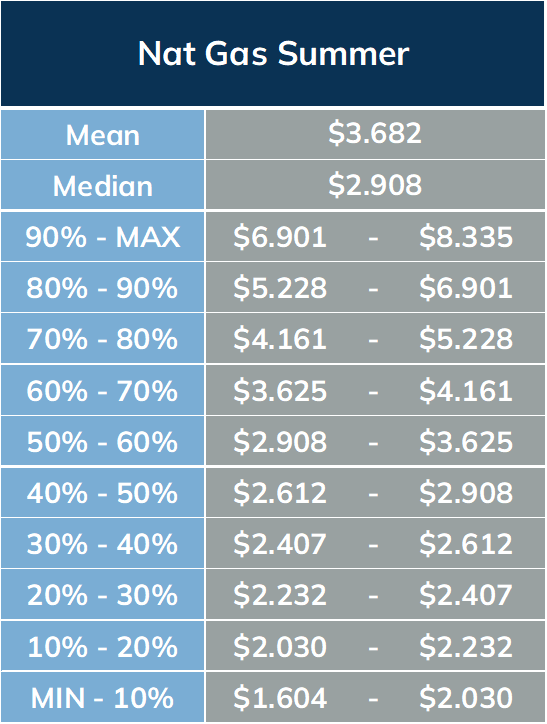
The recent price break saw near-term futures in the 30th and 40th decile. It is unlikely we will see 2026 prices fall into value over the next 2-4 months. Friday’s Commitment of Trader’s report will give the market a better indication of whether spec funds lightened or added to their net long position.
The Short-Term Trend Following Index is crossing UP today. With the daily RSI moving below the 30 level (considered technically “oversold”) last week and the vicious reversal back toward 50, while not an outright buy signal, the market is definitely no longer bearish.
Moving Average Alignment – Bullish
Long Term Trend Following Index – Bearish
Short Term Trend Follow Following Index - Bearish
Relative Strength Index -48.00
This material should be construed as the solicitation of an account, order, and/or services provided by the FCM Division of StoneX Financial Inc. (“SFI”) (NFA ID: 0476094) or StoneX Markets LLC (“SXM”) (NFA ID: 0449652) and represents the opinions and viewpoints of the author. It does not constitute an individualized recommendation or take into account the particular trading objectives, financial situations, or needs of individual customers. Additionally, this material should not be construed as research material. The trading of derivatives such as futures, options, and over-the-counter (OTC) products or “swaps” may not be suitable for all investors. Derivatives trading involves substantial risk of loss, and you should fully understand the risks prior to trading. Past results are not necessarily indicative of future results.
All references to and discussion of OTC products or swaps are made solely on behalf of SXM. All references to futures and options on futures trading are made solely on behalf of SFI. SXM products are intended to be traded only by individuals or firms who qualify under CFTC rules as an ‘Eligible Contract Participant’ (“ECP”) and who have been accepted as customers of SXM.
SFI and SXM are not responsible for any redistribution of this material by third parties, or any trading decisions taken by persons not intended to view this material. Information contained herein was obtained from sources believed to be reliable, but is not guaranteed as to its accuracy. Contact designated personnel from SFI or SXM for specific trading advice to meet your trading preferences.
(1) The StoneX Commodity Indicator provides an overall view of market sentiment for a commodity based on the quantification of fundamental, technical and historical market data related to that commodity. The StoneX Commodity Indicator History graphically represents each day’s actual very bearish to very bullish signal. This history contains the sum of all factors, excluding weather forecasts.
(2) The StoneX Value Matrix provides a measure of historical value by analyzing historical price data distributed into 10 deciles. The prices are adjusted for inflation using the Producer Price Index (PPI) published by the U.S. Bureau of Labor Statistics.
Reproduction or use in any format without authorization is forbidden. © Copyright 2024. All rights reserved.