

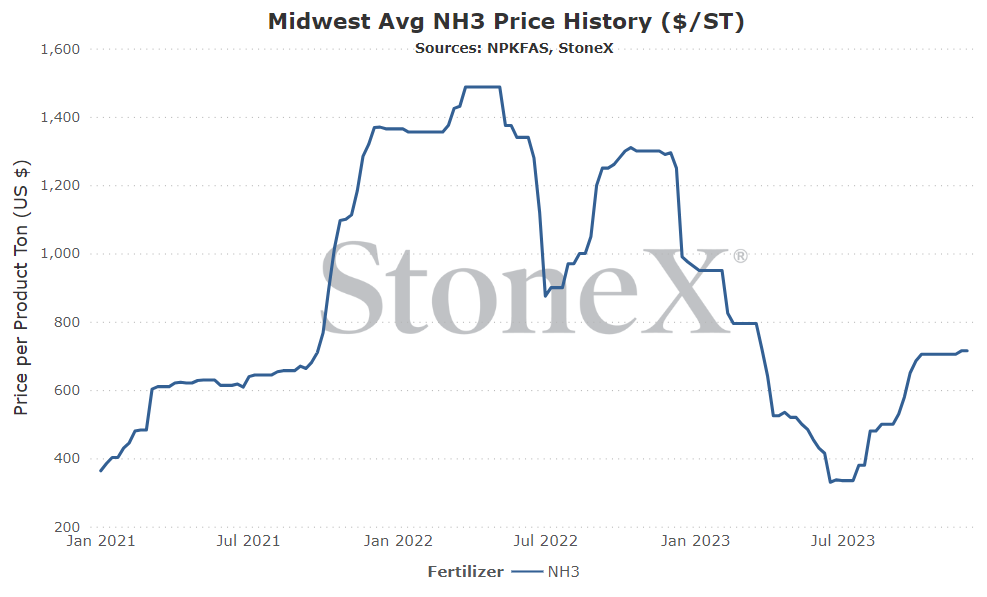
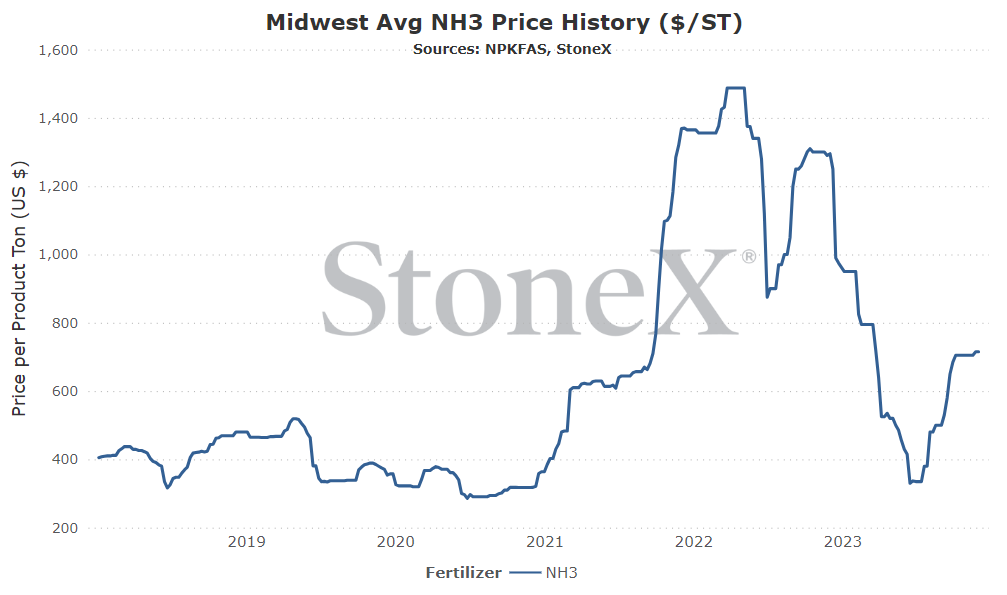
The first graph is the AVERAGE of the entire Midwest U.S. region. That means your local value WILL be different than what the graph reflects. Please do not take this into your retailer and say "why isn't my price the same as here". That is comparing apples to oranges. You might be on the cheaper or more expensive side of this graph. This doesn't take into account logistics/storage/interest/insurance/shrink/etc.
This graph looks at the price from a short ton and USD currency POV.
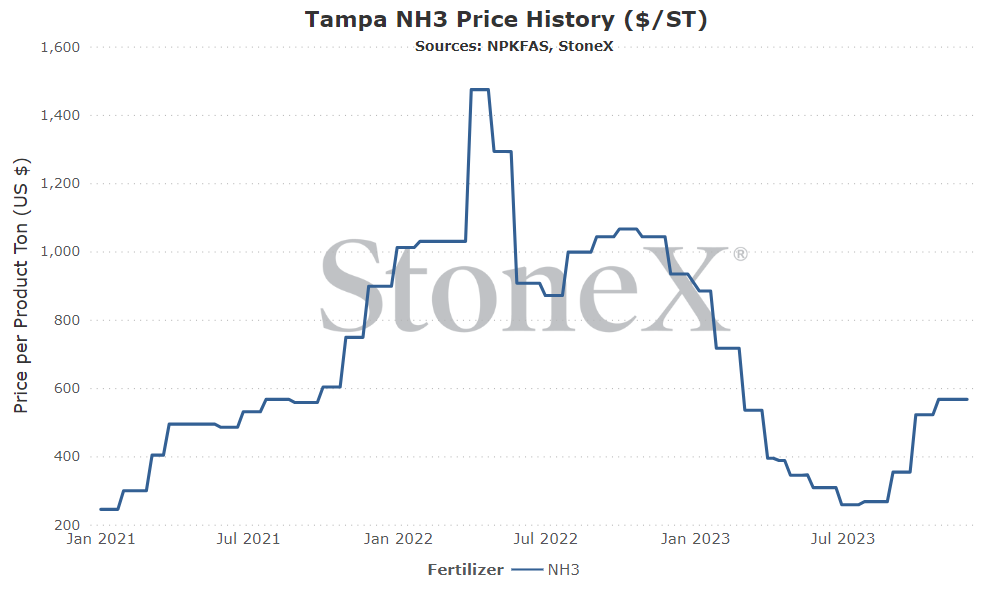
This second graph looks at the price set for Tampa NH3. This value does not have a high correlation to Midwest values. It is a talking point used when prices are rallying...yet somehow gets skipped on the way down. This price is more an indication of the global price. This price is set by two parties (purchaser - phosphate producer in Florida / seller - international producer providing NH3 to FL phosphate production).
This graph CAN be used as an indication of global market price direction/trends. This graph SHOULD NOT be used to determine a Midwest value. Tonnage is listed in short ton and currency in USD.
While this one is still largely in the air for me, I am going to lean a bit bearish moving forward just on the fact that November rolled to December flat priced.
It honestly wouldn't surprise me if it jumped in January. Europe production is still at risk with high priced Dutch TTF/falling urea values. Russia remains cut from the world. I do not think Trinidad is back to where it needs to be. Supplies are tight and we haven't seen the recession that I have feared for a while.
However, the price going sideways is telling. Values cannot rise forever and today, prices are overvalues. That doesn't mean they cannot go higher, it just means it is going to meet resistance.
North America
Bearish.
How is that for short and sweet!
If the manufacturers keep the price steady to higher for spring prepay programs, I really think they are going to struggle with sales. I really do. If they do, I'll tell you right now I'm going to suggest looking at alternatives.
We will find out in a few weeks and once we do, I'll send a mid-month update but my gut feel is lower.
I hope for buyers sake I am right...
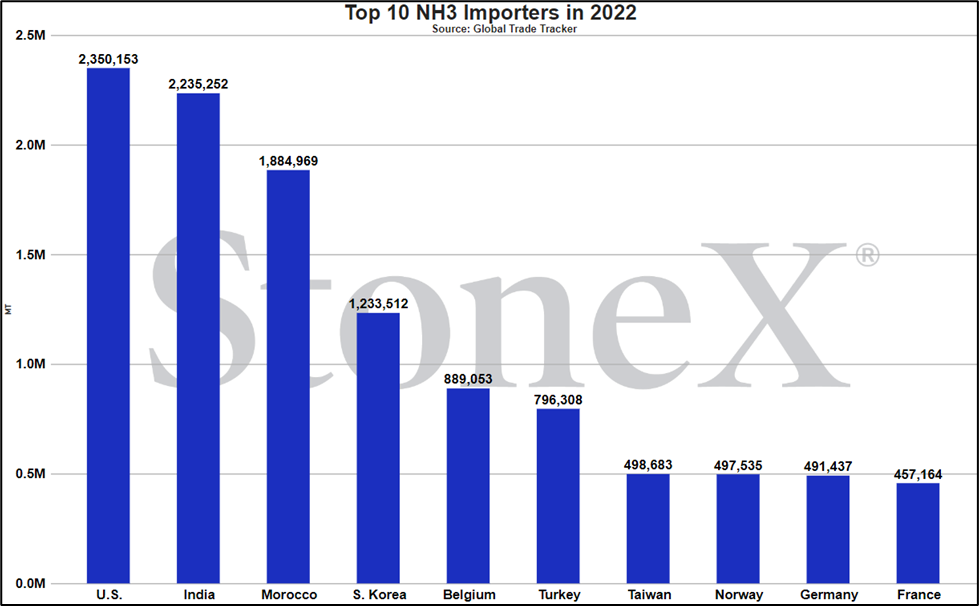
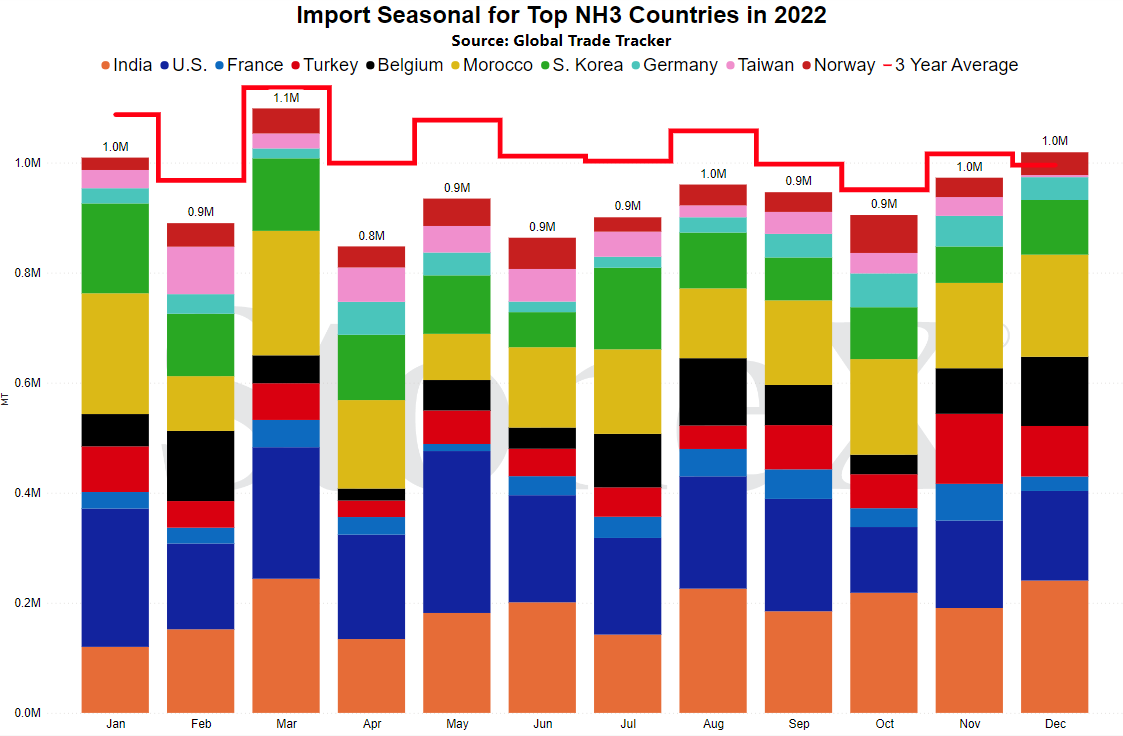
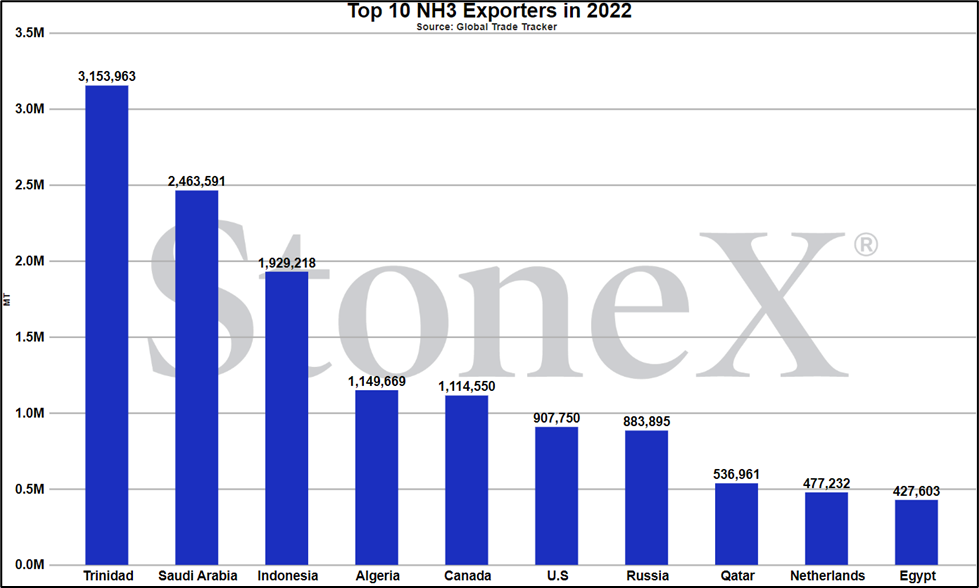
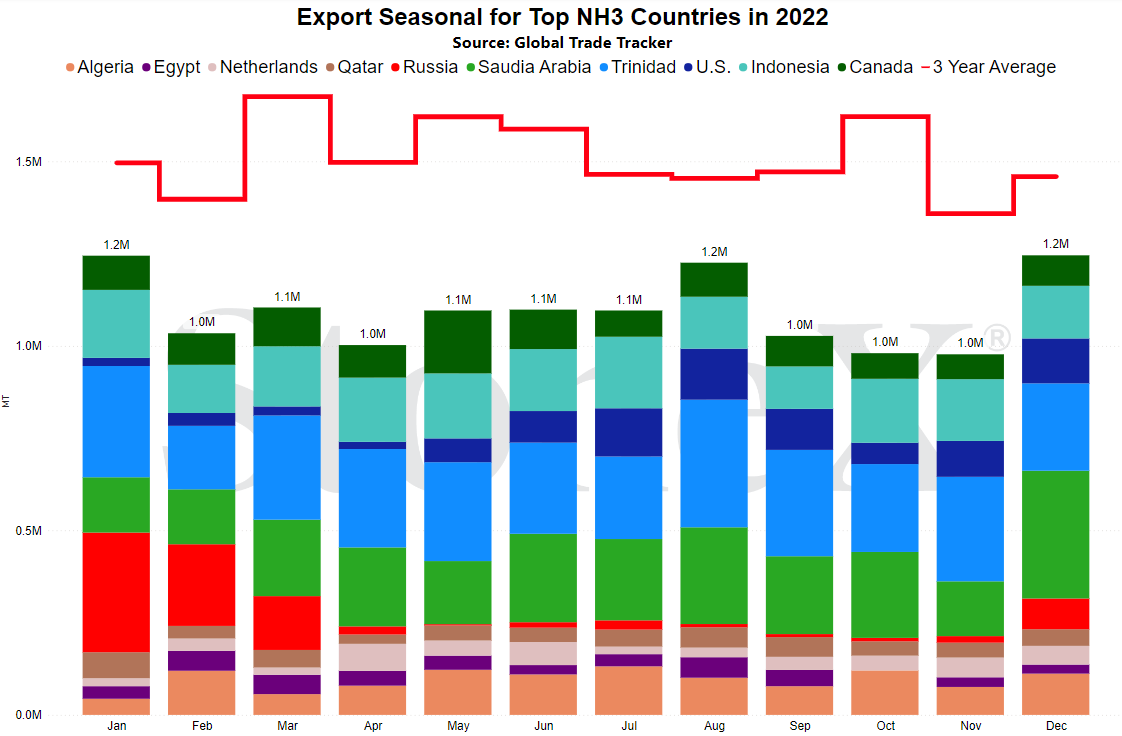
Another month, another unchanged Russian update
I promise I'm not trying to be lazy. I just know that many of you have read the story regarding Russia over and over again each and every month. In case you are new, please check the last couple months editions for a more detailed story. For here, I'll keep it quick:
- Russia was the world's largest NH3 exporter
- Their way of exporting was to produce in Russia, flow it thru a pipeline in Ukraine and then load vessels...out of the Odessa region
- Kind of gets hard to export out of the country you are actively in a war with
- There have been situations where there were paths to their exports resuming...they didn't work
- Now, Russia is effectively cut from the world
- They are working on routes thru and out of Russia proper...but it takes time to develop/build those systems
So that brings us to today where Russia is still out of the marketplace from an NH3 perspective. The world's largest exporter is still removed...and world supplies tighter than they should be.
Yara announces closure of Ferrara, Italy plant...raises European production concerns
Like Russia, we have spent a lot of time talking about European nitrogen production rates. Again, a long story shortened:
- West/central/east Europe accounts for less than 10% of global NH3 capacity. Far from being a huge chunk, but large enough to matter and sway the global S&D
- Russia was the primary and almost sole provider of natural gas thru the Nordstream pipeline
- If you do not remember, negotiations between Russia and Europe went poorly...Nordstream got shut down and then sabotaged
- European nitrogen production rates plummeted to 20 - 30% of normal as Dutch TTF values rose from single digits to a high of $103MMbtu
- As the world does, it figured out a new normal by bringing product from elsewhere. Dutch TTF values fell all the way into the $13 - $18MMbtu range (current range) and production rates increased to 70 - 80% of normal
Much of the global nitrogen market has correlated to the Dutch TTF marketplace because Europe is effectively the high cost producer that has to ebb and flow production to balance the S&D. While global NH3 values have been steady in the last month (as indicated by Tampa which we go into below), urea values have plummeted. Finally, the market got out of sync enough that Yara was forced to make the difficult decision to stop production at their Ferrara, Italy plant.
This plant isn't huge. I believe it is 600K of NH3 and 600K of urea per year. However, it raises the emotional fear that others may shut down as well. Today, no such announcements have been seen or heard, but that fear lingers.
Tampa NH3 holds steady from November to December
While the monthly Tampa NH3 price is nothing more than two parties agreeing to a set price (Yara providing NH3 to Mosaic), it is still a great indicator of global value direction.
Since the summer low, NH3 has doubled in price. The fear is that the trend would continue and challenge the high's set in 2022.
For those fears, the December was a big sigh of relief as the price remained steady at $625. Sure, it wasn't a price slash but given how some months had seen triple digit price moves, breakeven is a win!
Indications of a big North American fall application
To be upfront, it is too early to call in terms of fall demand...but the signs are there that it was good to really good.
We had already forecasted a bigger than normal fall run. The typical split is for 2M tons to be applied (ag) in the fall and 2M tons applied in the spring. Given the cheap price offered this summer, grain values and acreage forecast continuing to hold at 92M, we had moved our 2M ton forecast to 2.15M. That may not seem like the biggest shift...but it is substantial.
Now, we have to figure out if we beat that number and more importantly, what it means going forward.
That large of a fall run means that the system is likely almost empty which will be a feather in the cap of manufacturers at the negotiation tables. I've seen it first hand. When you empty the system in the fall, it is a struggle to get refilled. There are only so many trucks/railcars/barges in the system. Not too mention daily capacity to refrigerate tons to be able to store. If we have an early spring (early March), we could be playing from behind the 8-ball all spring. Manufacturers know that better than anyone else and they WILL remember that when it comes time to determine spring prepay values.
Too early for spring prepay programs announcements
Speaking of spring prepay programs, THEY ARE NOT OUT YET.
Sorry, that might have been over the top!!
Seriously, if you go to your retailer for spring NH3 numbers, do not get mad when they say they do not have one. Manufacturers control that and as of this writing, nothing has been announced. They are likely in the process of figuring out how big the fall run was, their ability to get refilled by spring, etc.
On the brighter side, these programs should be announced before Christmas/New Years. Manufacturers realize there is a lot of money that needs to be spent before the calendar rolls to 2024. Just prepare yourself. It will come fast.
U.S. Midwest Wholesale price average
Vs 30 days ago - +1% or approximately $10 higher
Vs 90 days ago - +43% or approximately $215 higher
Vs 6 months ago - +66% or approximately $285
Vs 1 year ago - -45% or approximately $580 lower
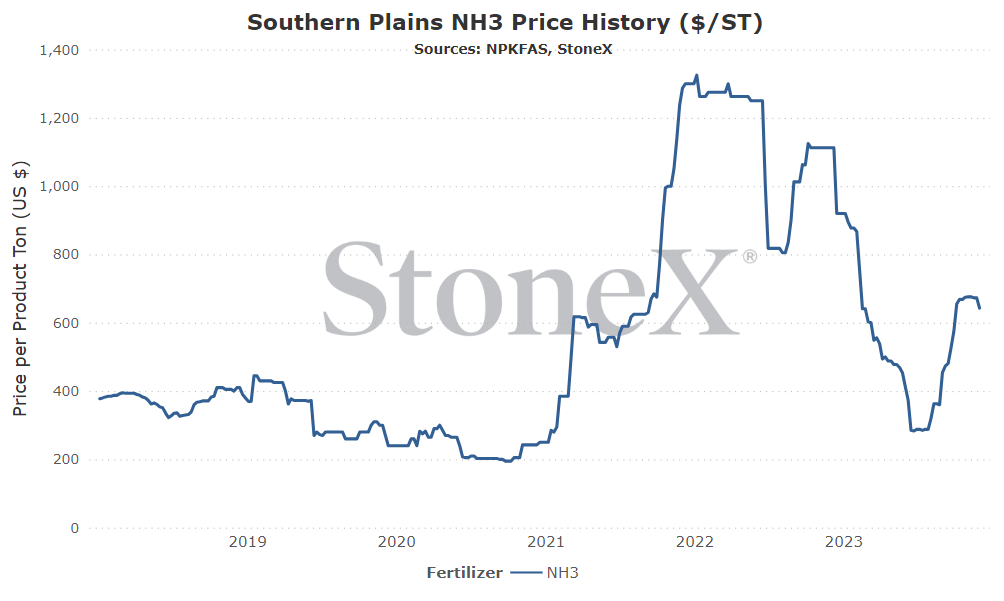
U.S. Southern Plains price average
Vs 30 days ago - -5% or approximately $34 lower
Vs 90 days ago - +42% or approximately $189 higher
Vs 6 months ago - +56% or approximately $230 higher
Vs 1 year ago - -42% or approximately $470 lower
- Without Russian exports, world inventories remain tighter - I know we have hit on this point so many times, but it remains true. Russia was the world's leading NH3 exporter. Imagine where the current price would be if we had their millions of tons of exports in play. Since they are not, prices remain supported.
- European production remains lower than normal creating additional demand - while Dutch TTF values have been dropping slightly, we still have not seen additional European nitrogen production come back online and I'm not sure we will in the near term. As long as their nat gas markets remain high priced, their production will remain somewhat offline. That lowers global supplies. That raises global demand. That is supportive values.
- Big fall N.A. run emptied its storage system - I've seen this first hand in my career. When you have a massive fall run, you empty storage facilities and are faced with a relative short amount of time to get refilled. NH3 is even worse than dry and liquid fertilizers. There is an extremely finite amount of logistics that can move the product and the period between fall and spring is fairly short. If/when this story starts to make its rounds, it isn't made up. It could keep prices high in an attempt to push some demand elsewhere because it cannot physically get enough in place for the coming season.
- Tampa NH3 remained flat from Nov to Dec - I know it is kind of weird to put this attention when prices remained flat but it tells a story. We have seen values double since the summer low's as tight inventories and bigger than expected demand supported the market. Staying flat in my mind is a sign of weakness.
- Current values are overpriced vs historics/grains/alternatives - just about every way that I look at NH3 values tells me it is overpriced. Vs grains. Vs historicals. Vs urea. Vs UAN. The list goes on. I'm guessing demand see's/feel's it as well and will not be happy. If manufacturers do not drop prices for spring prepay programs, they may be met by buyers that tell them to...well, you can fill in the blank.
- Possible recession devastates industrial demand? - I've used this before as a possible bear factor and it has continued to not happen...but it still can. I'm still uneasy in my economic outlook and I'm far from alone according to reports I read. While it hasn't happened yet, it still could and if it does, expect NH3 demand to fall. If industrial demand starts to falter, those tons will look for new homes...in the ag sector.
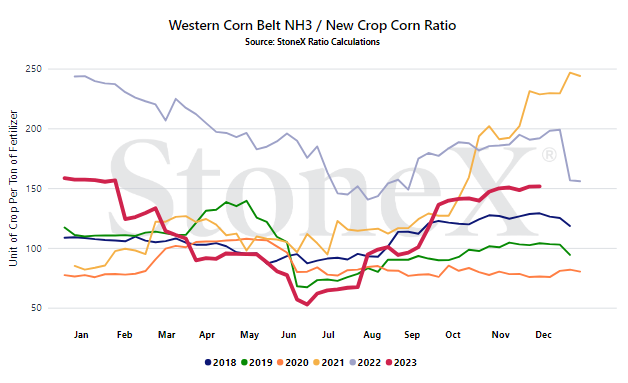
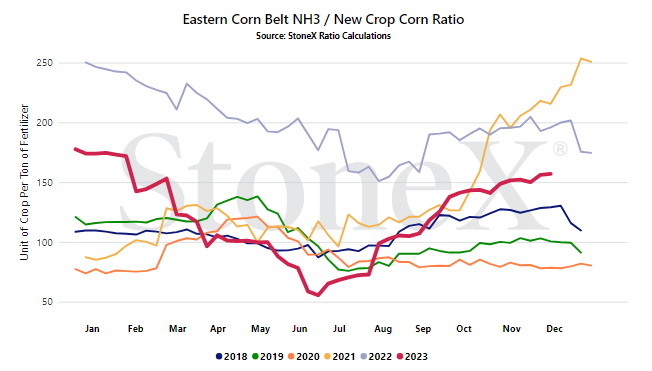
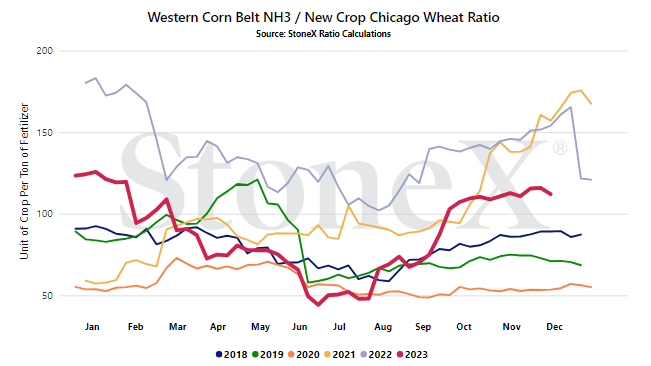
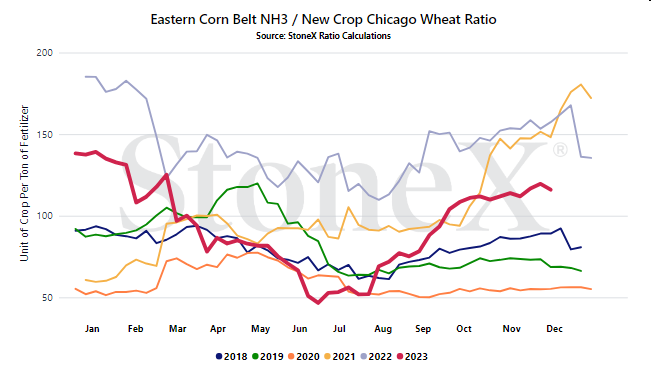
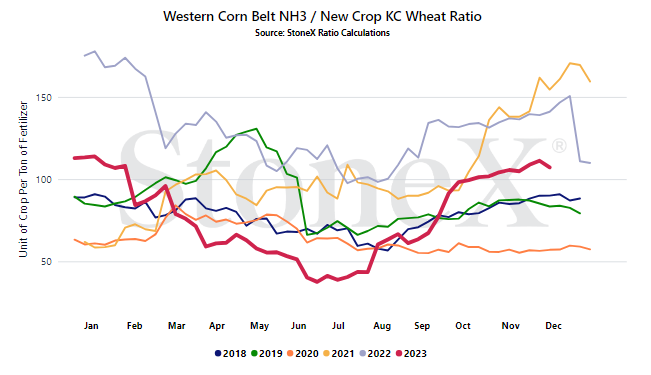
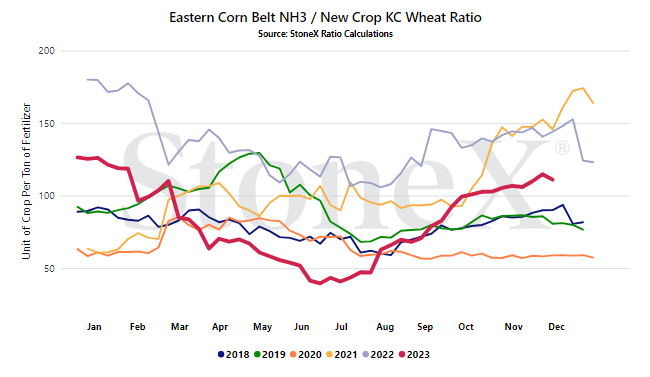
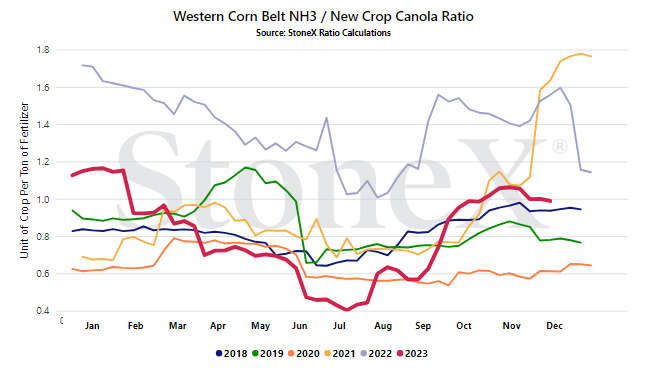
We believe that only looking at the flat price of either grains or fertilizer can be misleading:
-
Only selling grain can hurt you if fertilizer prices rise substantially
-
Only buying fertilizer can hurt you if grain prices fall
We look at the ratio "value" to get a better indication of where we are or how many bushels of X does it take to pay for 1 ton of fertilizer.
Would you rather:
-
Spend 150 bushels to pay for 1 ton of potash
-
Spend 100 bushels to pay for 1 ton of NH3
When we compare the current ratio value against recent years, we start to see if we are high or low.
YOUR VALUES WILL LOOK DIFFERENT
This graph looks at the NOLA NH3 price vs the flat grain price. There are no logistics on either product. Your location will look different due to fertilizer logistical costs, grain basis, etc.
- How will manufacturers approach spring prepay programs in North America - this is the million dollar question today. In a few weeks, manufacturers are going to come out with spring prepay programs which set that period (not the winter fill which will also come out). Will they hold prices level in hopes of forcing demand to step forward? Will they drop the price to appeaser buyers? That decision will make a world of difference.
- Tampa NH3 price was flat Nov to Dec, worst behind us? - as always, Tampa is a great litmus test for the international market. Since the summer low's, Tampa has doubled in price. Now that the price remained steady from November to December, does that mean the S&D is finally balanced and the worst of the price increases behind us? Could we see values slip as we move into 2024?
- Will the "system emptied in fall" or "system needs refilled before spring" story win out? - frankly, that doesn't take into account the third story of "could corn acres rise as Brazil forecasts get slashed". This will help tell the tale. We have seen big falls like we just got done with result in manufacturers complaining about the inability to refill the system before spring. I've seen it first hand. It is a legit story...but if the fall is good, that takes some spring demand away (unless demand rises, hence corn acres). In the next few weeks, the story will come together...and that story will dictate the price.
- Will spring N demand switch to urea/UAN at current price spreads? - if we go off of current values (values that are not setting spring values), NH3 is too high priced. It is high vs grains. It is also high vs both urea and UAN. Weather will go a lot further in determining the success/failure of spring but if prices remain out of whack (NH3 overvalued), could we see farmers switching away to cheaper alternatives? Wouldn't be the first time...
StoneX Ratio Calculation
The ratio calculation is derived from Bloomberg historical grains values as well as fertilizer values from StoneX, NPKFAS, and Argus.
The calculation is simply dividing the fertilizer price by each grain price.
All data was sourced from StoneX unless otherwise noted.
This material should be construed as market commentary, merely observing economic, political and/or market conditions, and not intended to refer to any particular trading strategy, promotional element or quality of service provided by the FCM Division of StoneX Financial Inc. (“SFI”), StoneX Financial (Canada) Inc. (“SFFC”) or StoneX Markets LLC (“SXM”). SFI, SFFC and SXM are not responsible for any redistribution of this material by third parties, or any trading decisions taken by persons not intended to view this material. Information contained herein was obtained from sources believed to be reliable, but is not guaranteed as to its accuracy. Contact designated personnel from SFI, SFFC or SXM for specific trading advice to meet your trading preferences. These materials represent the opinions and viewpoints of the author, and do not necessarily reflect the viewpoints and trading strategies employed by SFI, SFFC or SXM. The FCM Division of StoneX Financial Inc., a subsidiary of StoneX Group Inc., is a member of the National Futures Association (“NFA”) and registered with the U.S. Commodity Futures Trading Commission (“CFTC”) as a futures commission merchant and commodity trading advisor. StoneX Financial (Canada) Inc. is currently registered as a Futures Commission Merchant or equivalent in all provinces of Canada and is a member of the Investment Industry Regulatory Organization of Canada.




