Dow Crosses a Chart Threshold Everyone Will Notice While Gold Drops Most in 43 Years
By: John Kicklighter, Head of Market Research
The US-Iran conflict is rounding out its third week with focus shifting from the headlines to the tangible economic implications. Meanwhile, the major US indices have slipped their 200-day moving averages – financial media favorite thresholds – and gold has registered a 10% drop.
Talking Points:
News search density around ‘Iran’ has dropped but the impact on inflation and interest rate expectations are picking up
The Dow, S&P 500 and Nasdaq 100 have all slipped their 200-day SMAs while Gold has suffered its worst week’s loss since 1983; and rate expectations probably play a key role
Scheduled event risk is notably light over the coming week, but that may not prove a boon for a strained market
Watch the Full Video
A Technical Milestone Even the Non-Believers Will Take Note Of
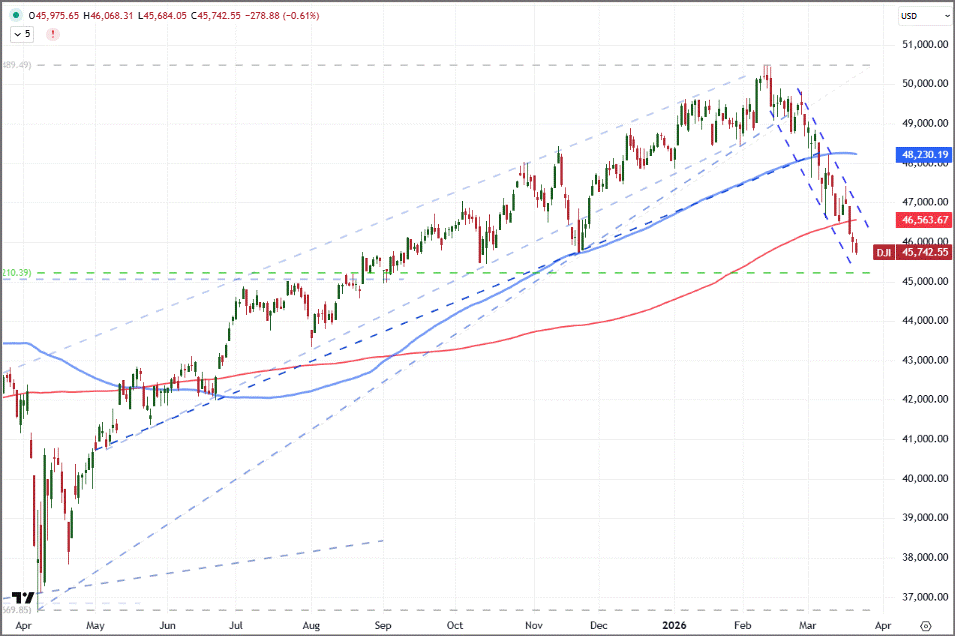
Even though we have seen intangible concerns around backdrop systemic threats smoulder for months, followed by the US-Iran conflict putting a clear point to those doubts; sentiment across the global capital markets managed to avoid a definitive sense of risk aversion. However, that slowly eroding resilience may have hit a particular accelerant this past week in the form of a well-known technical threshold breach. While retail traders tend to show a strong deference for charts and the power of historical price casting expectations through collective sentiment, the bulk of capital – in sovereign, institutional, commercial and other key players’ hands – generally follows fundamental lines. That said, there are certain technical milestones that tend to stretch across the financial headlines and register even with the most fundamentally inclined market participants. Near the top of that list is the 200-day (simple) moving average. As it happens, this past week, the three major US indices (Dow Jones Industrial Average, S&P 500 and Nasdaq 100) all clipped below their respective trailing threshold this past week.
Chart of Dow Jones Industrial Average with 100-Day, 200-Day Moving Averages (Daily) Source: TradingView.com; John Kicklighter
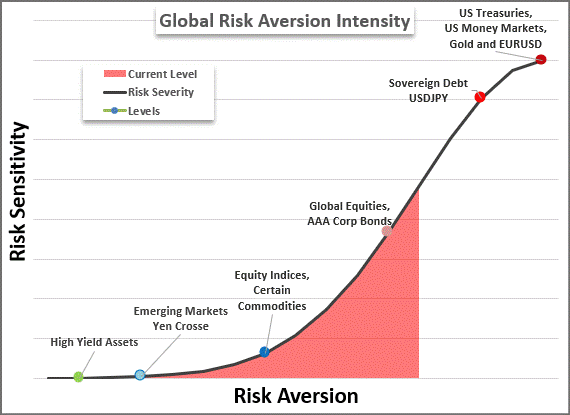
While the three major US equity indices slipping their respective long-term moving averages is a noteworthy milestone of ‘support giving way’, it is far from the only signal that sentiment is falling away. We have seen other measures of ‘risk’ tumble over the weeks including global indices, emerging market assets and high-yield fixed income assets among others. Alternatively, traditional havens – not to be mistaken with dubiously-designated measures like Bitcoin – have firmed as the preference for liquidity overrides ephemeral existential debates, like the long-term diversification of exposure to the Dollar. The more persistent and wide-spread the risk aversion, the more prolific the deleveraging phase will be across the financial space.
Spectrum of Risk Aversion by Market Spread Source: John Kicklighter
The US-Iran Conflict Moves Into Tangible Consequences as It Drags On
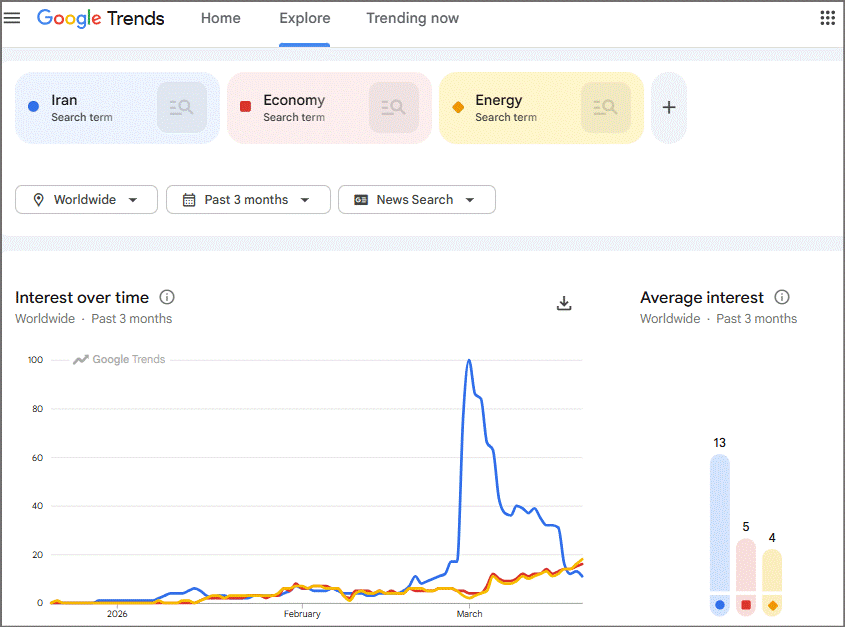
Fundamentals are playing an important role in the permanence of a sentiment transition. Notably, the search density around “Iran” has dropped as the war drags on and markets adjust to their new, volatile ‘normal’. In the meantime, search interest in “energy” and “economy” have slowly climbed to overtake the more controversial national term. We are transitioning into the more tangible implications of a protracted military engagement that threatens critical resource distribution. The further this situation extends, the harder it is to reverse course (regardless of whether there is a Trump ‘TACO’) back into a passive complacency.
Chart of Google Trend Volume for ‘Iran’, ‘Economy’ and ‘Energy’ (Daily) Source: Google Trends
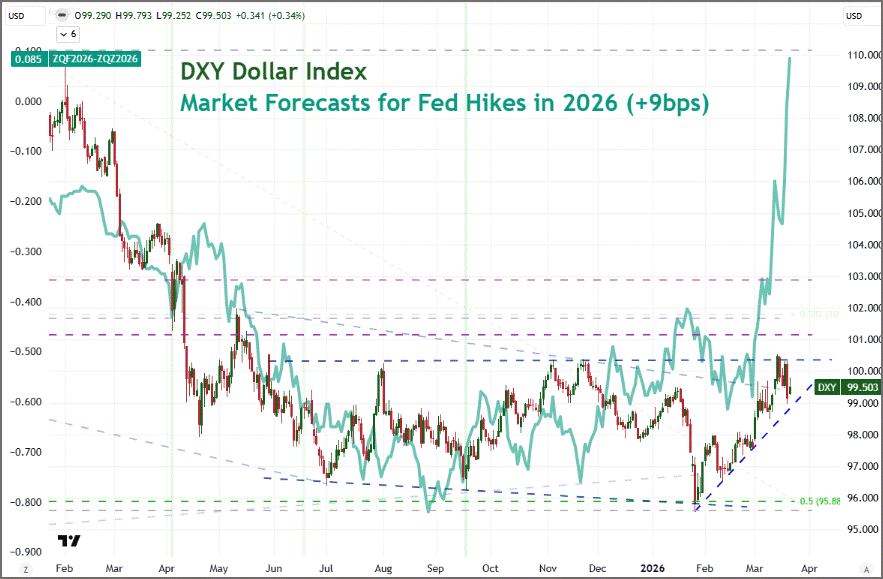
One very prominent area of fundamental influence from the ongoing offensive in the Middle East is the persistent buoyancy in crude oil – stationed around $100/barrel for US-based WTI and $110/barrel for the UK-benchmark Brent contract. While different inflation measures give different weights to energy prices, they are a critical component to overall costs, whether consumer or business related. Those pressures did not go unnoticed in this past week’s run of monetary policy meetings. There were actual rate hikes (eg with the RBA) and acknowledgement of future pressures from energy, but the Fed was the most notable account of inflation translating into market impact. While the Summary of Economic Projections (SEP) ‘only’ raised its 2026 PCE inflation forecast from 2.4 percent in December to 2.7 percent and kept its rate forecast to a single 25bps rate cut, the market has clearly charged its hawkish expectations. According Fed Fund futures, the market is now pricing in 9 basis points of hikes this year.
Chart of DXY Dollar Index Overlaid with Implied Fed Funds Futures Forecast (Daily) Source: TradingView.com; ICE; CME; John Kicklighter
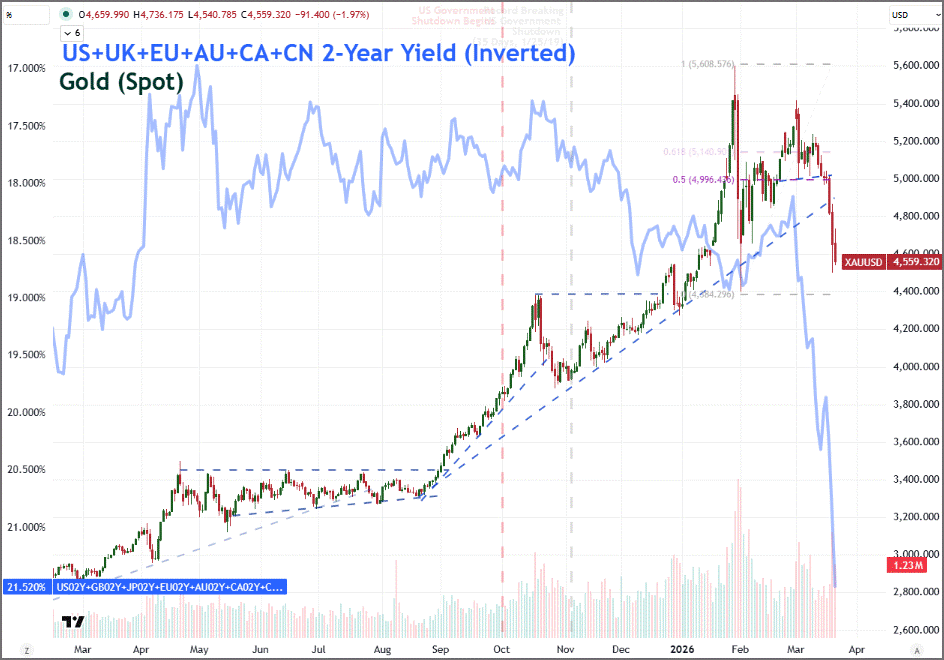
The inflation-to-interest rate assumptions are just isolated to the United States and the US Dollar. Interest rate expectations have climbed for many major countries, as can be measured through market proxies such as 2-year government bond yields. That has in turn drawn a critical eye onto assets whose appeal is based on secondary and/or tenuous fundamental connections. One market that was a goldilocks of convergent fundamental appeal up until just weeks ago was gold. It seemed to enjoy an appetite of anti-fiat diversification and mild risk aversion appeal while also taking advantage of the low yield environment which can otherwise diminish its appeal. Now, as interest rate expectations swell, the precious metal finds the selling pressure through this node overriding the stronger drive of risk aversion taking traction. In fact, this past week, the pressure was so intense that gold dropped -10.4 percent for the steepest decline from the metal since 1983.
Chart of Spot Gold Overlaid with Aggregate of 2-Year Treasury Yields (Daily) Source: TradingView.com; John Kicklighter
Systemic Risk and Iran Concerns Add Context to Traditional Data
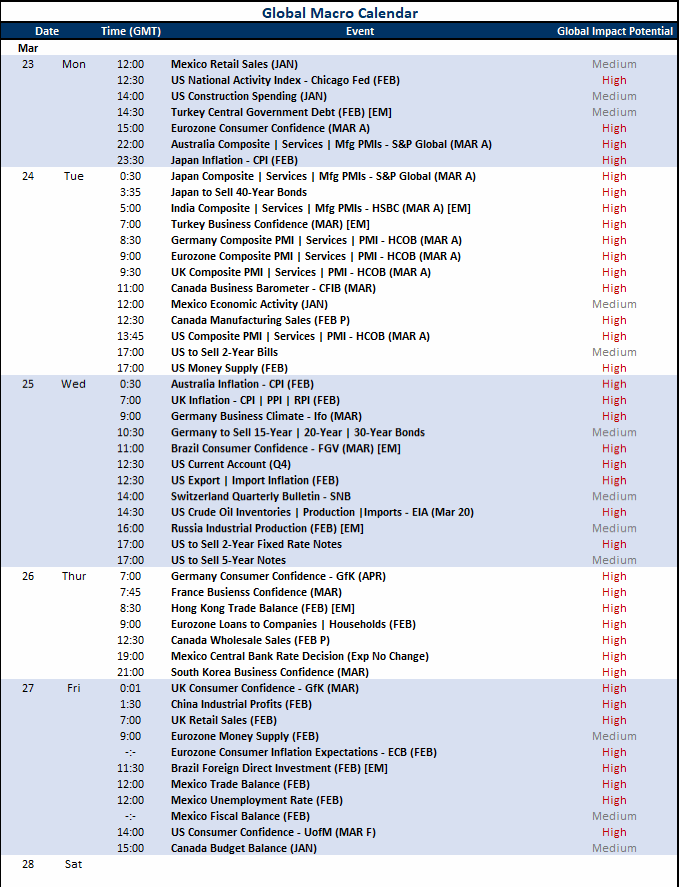
If we were to judge the global macro calendar purely on the merits of its listings, it would look like we are facing a quiet week ahead. However, the technical backdrop of a progressive slide from risk benchmarks and the fixation on headline-oriented fundamental matters will add systemic context to otherwise low key events while sentiment represents a motivation unto itself. From the listings we have going forward, it is worth highlighting three meaningful categories that will cater to broader concerns and draw our focus forward to economic speculation: growth through March PMIs; inflation risks through CPI and other related figures and the fragile state of confidence through sentiment surveys.
Calendar of Top Global Macro Event Risk Source: John Kicklighter
Now, the Timely Economic Activity Proxy Matters…
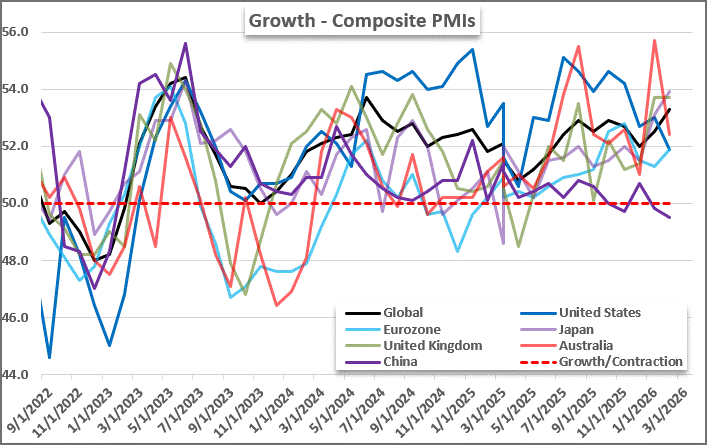
I will regularly look to the monthly PMIs from Standard & Poor’s as they represent a high correlation and timely update on economic activity for major economies. Over the past few years, concern around threats to expansion have not been material enough that concern had escalated to the point of making this particular line of event risk market moving. That may have changed with the evolution of the news cycle and market course headings. Generally speaking, the composite PMIs – the balance between manufacturing and services – have reflected robust expansion (China has been the exception). Yet, with higher energy costs and a tempered outlook for demand, the risk of a downshift in growth expectations is tangible. Should these leading measures take a dive, it is far more likely to register as further evidence that the economy is coming unmoored form its resolute growth pattern.
Chart of Major Economy Composite PMIs (Monthly) Source: Standard & Poor’s; John Kicklighter
Where Was Inflation Before the Energy Spike Kicked In?
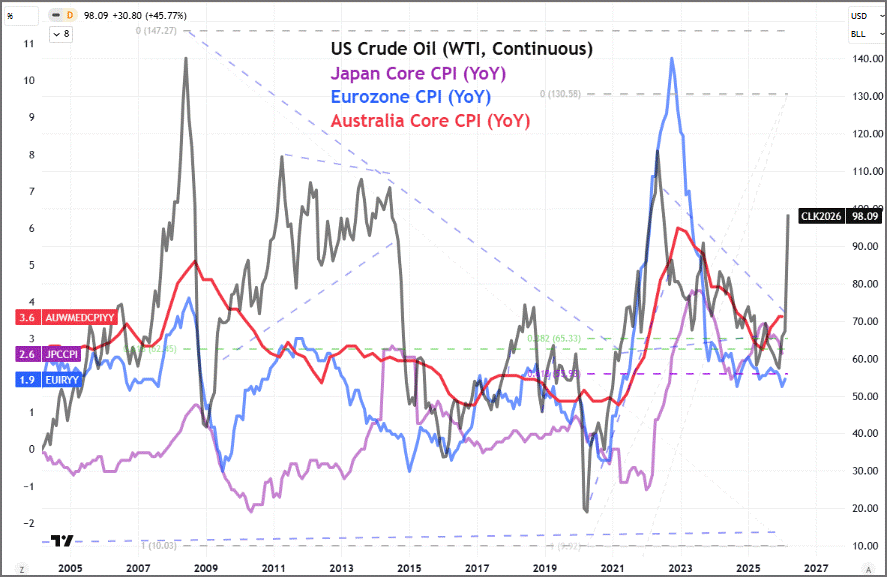
Inflation expectations have shot higher with rate expectations in tow. However, thus far, the metrics are forecasts rather than tangible readings. That is because we haven’t had many inflation readings whose survey period includes the extreme situation of the past three weeks. In the coming week, we will have another run of price measures that cover a look back period for February. Japan has its nationwide CPI, Australia is populating its recent monthly consumer figure and the UK will cover the breadth of inflation (CPI, PPI, RPI); but the coverage period is all for the previous month. The war didn’t kick off until after the closing date of the assessment period; but this may still be useful data. It can tell us where pressures were before the exogenous threat kicked in. Meanwhile, a side word for the ECB’s Eurozone consumer inflation expectations report which will offer a more forward-looking view. This said, energy prices are a key influence on consumer inflation – both outright and upstream.
Chart of US Crude Oil Futures Overlaid with Japan, Eurozone and Australia CPI (Monthly) Source: TradingView; NYMEX; John Kicklighter
A Sentiment Update with More Critical Insight
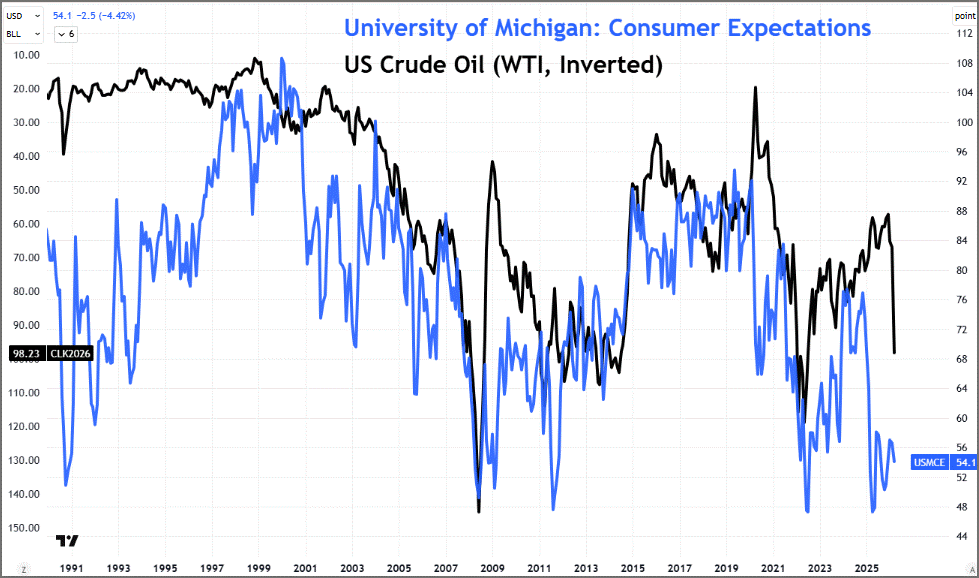
One last highlight through the week worth keeping tabs on – but perhaps one that most would write off – is the University of Michigan Consumer Confidence survey. Overall, the indicator is an important one as its focus group is the largest component of economic influence in the world’s largest economy. However, this Friday’s reading is a ‘Final’ reading. In other words, we have already seen a first steer on the indicator – and the reading offered a seemly mild month-over-month retreat for expectations from 56.6 to 54.1 – but the added time and accuracy will likely downgrade the initial reading. The additional time from the initial February 17th to March 9th observation period has not evolved encouragingly for the American consumer. How much adjustment can we expect, and how much added discount could a poor showing contributed to this already-deflated market? We will see.
Chart of Relative Monetary Policy Standing of Major Central Banks Source: TradingView.com; University of Michigan; NYMEX; John Kicklighter
Access More Global Macro Insights, Forecasts and Tools
Stay connected to timely global macro analysis designed to help market participants navigate shifting economic conditions and evolving risk. Gain access to regular market commentary, updated quarterly forecasts, a comprehensive two-week forward economic event calendar, and specialized tools built to support informed trading and risk management decisions.
The subsidiaries of StoneX Group Inc. provide financial products and services, including, but not limited to, physical commodities, securities, clearing, global payments, risk management, asset management, foreign exchange, and exchange-traded and over-the-counter derivatives. These financial products and services are offered in accordance with the applicable laws in the jurisdictions in which they are provided and are subject to specific terms, conditions, and restrictions contained in the terms of business applicable to each such offering. Not all products and services are available in all countries. The products and services offered by the StoneX Group of companies involve risk of loss and may not be suitable for all investors. Full Disclaimer. This content is not intended for residents of any particular country, and the information herein is not advice nor a recommendation to trade nor does it constitute an offer or solicitation to buy or sell any financial product or service, by any person or entity in any jurisdiction or country where such distribution or use would be contrary to local law or regulation. Please refer to the Regulatory Disclosure section for entity-specific disclosures. No part of this material may be copied, photocopied or duplicated in any form by any means or redistributed without the prior written consent of StoneX Group Inc. The information herein is provided for informational purposes only. This information is provided on an ‘as-is’ basis and may contain statements and opinions of the StoneX Group of companies as well as excerpts and/or information from public sources and third parties and no warranty, whether express or implied, is given as to its completeness or accuracy. Each company within the StoneX Group of companies (on its own behalf and on behalf of its directors, employees and agents) disclaims any and all liability as well as any third-party claim that may arise from the accuracy and/or completeness of the information detailed herein, as well as the use of or reliance on this information by the recipient, any member of its group or any third party.
Our market expertise, advanced platforms, global reach, culture of full transparency and commitment to our clients’ success all set us apart in the financial marketplace.
Reach
With access to 40+ derivatives exchanges, 180+ foreign exchange markets, nearly every global securities marketplace and numerous bilateral liquidity venues, StoneX’s digital network and deep relationships can take clients anywhere they want to go.
Transparency
As a publicly traded company meeting the highest standards of regulatory compliance in the markets we serve, our financials and track record are matters of public record. StoneX’s commitment to “doing the right thing over the easy thing” sets us apart in the industry and helps us build respect, client trust and new partnerships.
Expertise
From our proprietary Market Intelligence platform to “boots-on-the-ground” expertise from award-winning traders and professionals, we connect our clients directly to actionable insights they can use to make more informed decisions and achieve their goals in the global markets.