Featured | U.S. Tariffs on Brazilian Products
Late Wednesday afternoon (the 9th), the President of the United States, Donald Trump, announced import tariffs of 50 % on all Brazilian products starting August 1.
U.S. – Brazil Trade Balance
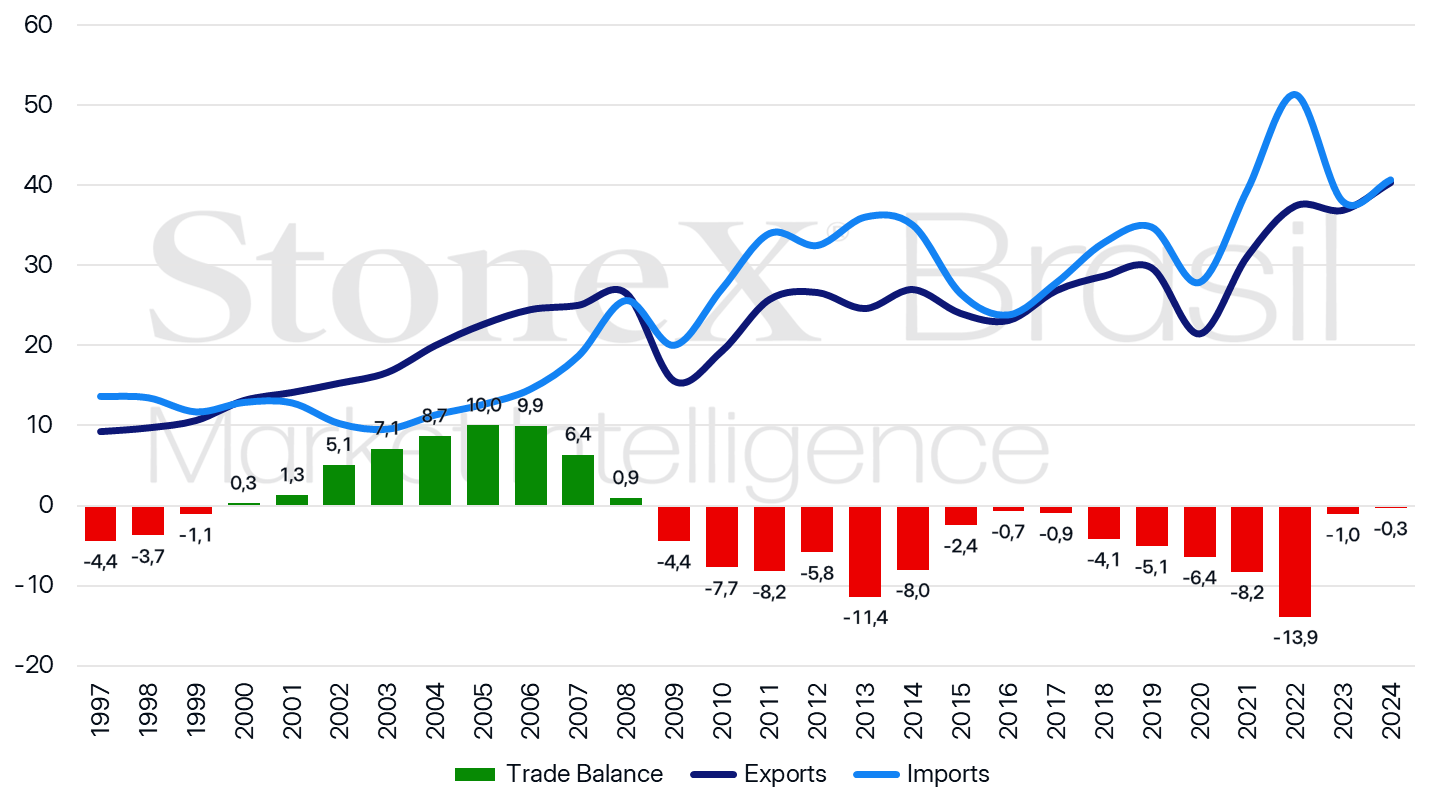
Brazil's exports, imports, and trade balance with the United States (US$ bn)
Source: Comexstat. Prepared by StoneX.
The United States is the second-largest destination for Brazilian exports, behind only China. According to MDIC data, Brazilian exports to the U.S. in the first half of 2025 totaled US$ 20.02 billion, or 12 % of total exports. Additionally, Brazil has run a trade deficit with the United States (i.e., importing more than it exports) since 2008.
Main Products Exported to the U.S.
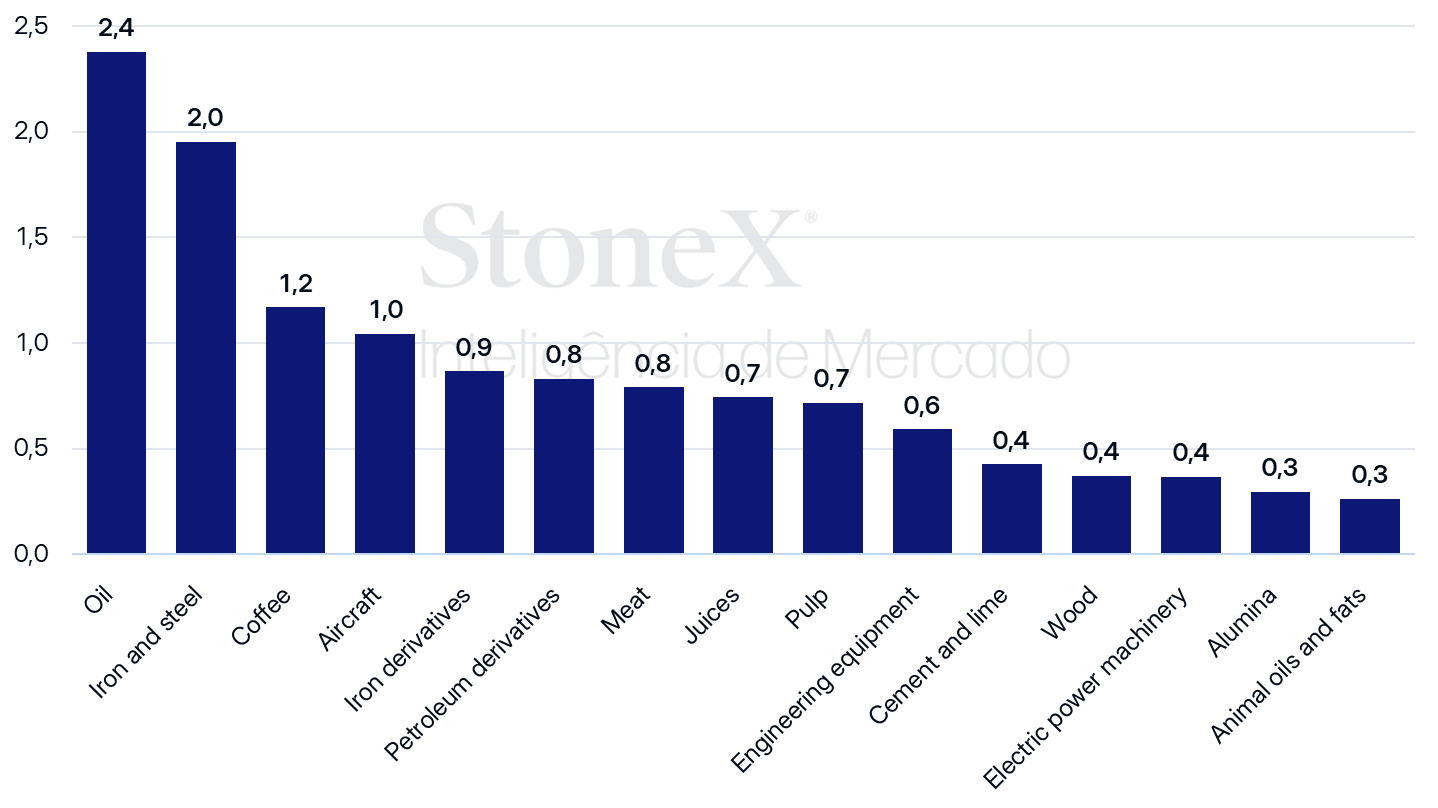
Main Brazilian products exported to the U.S. in the first half of 2025 (US$ bn)
Source: Comexstat. Prepared by StoneX.
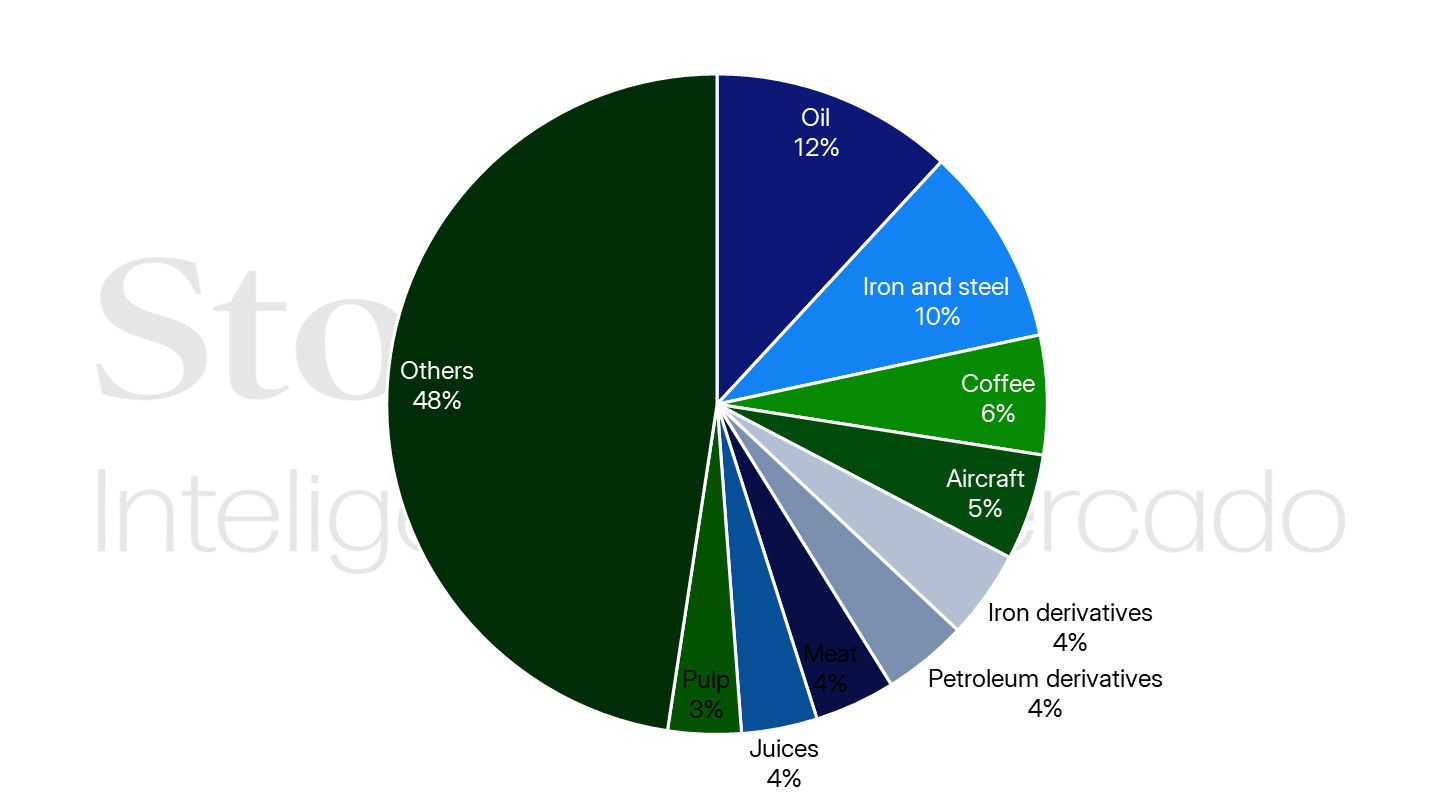
Breakdown of export revenues to the U.S. in the first half of 2025 by product (%)
Source: Comexstat. Prepared by StoneX.
Among the main Brazilian products exported to the U.S. are the so-called hard commodities, primarily oil, metals and their derivatives, which accounted for about 30 % (US$ 6.0 bn) of revenue in the first half of 2025.
Next, products from the agricultural and forestry sectors—such as coffee, meat, juices, pulp, wood, and animal fats and oils—also represent a significant share of Brazilian sales to the U.S. market, around 14.4 % (US$ 5.1 billion).
Furthermore, some manufactured products—such as aircraft and aeronautical equipment, civil engineering machinery, and electric-power sector equipment—accounted for 10 % (US$ 2.0 billion) of revenues.
Overall, Brazilian exports to the U.S. remain heavily concentrated in the extractive and agricultural sectors, considering not only raw materials but also the industrial products generated by these sectors. In this respect, the implementation of U.S. tariffs on Brazilian products has heightened fears of revenue reductions in these areas, with the market still uncertain about the actual impacts of the announced measures.
Brazilian real
In the hours immediately after the U.S. President announced he would raise import tariffs on Brazilian products, the dollar recorded a strong rise against the real.
Partly, this movement is explained by the fact that tariffs of this magnitude can severely harm Brazilian exports, since the U.S. is currently the second-largest destination for national exports. This represents a reduction in foreign currency inflows, which tends to depreciate the real.
Additionally, the decision increases unpredictability and perceived risks for investments in Brazilian assets, deterring foreign investment and likewise tending to depreciate the real.
Oil and Diesel
The United States accounts for 11.3 % of Brazil's oil exports, which averaged 209 kbpd in the first half of 2025, according to MDIC data. This volume is 22.7 % below the average recorded in the first half of 2024 (271 kbpd), as Brazil expanded exports to the Asian market—57 % (1,058 kbpd) of its overseas sales. The European Union also accounts for a significant share, receiving one-quarter (465 kbpd) of Brazil's exports.
Brazil, in turn, is not a major oil supplier to the United States. According to the EIA, Brazil accounted for less than 3 % of U.S. imports in 2025, down from the previous year. The U.S. depends more on other producers, such as Canada (65 %), Mexico (7 %), and Saudi Arabia (4 %), as well as imports from other Latin American countries like Venezuela and Guyana. Thus, if Brazilian oil is not exempt from the new tariffs, American importers will likely seek alternate suppliers.
Depending on whether the measure is upheld, Brazil may see a shift in its oil buyer profile, with a possible increase in Asian country participation at the expense of the U.S. share, driven by the loss of competitiveness of Brazilian oil in the U.S. market. Short-term impacts may include a decline in Brazilian oil exports while these adjustments occur, depending on Brazil's ability to redirect its flows to other consumers.
Regarding petroleum derivatives, Brazil relies on U.S. imports for 24 % of its diesel volume in the first half of 2025 (5.4 million m³) and 34 % of its gasoline (410,000 m³). Therefore, if Brazil retaliates, the country may turn to new suppliers—such as Russia and producers in Asia and the Middle East—potentially raising import costs.
Meat
The United States is a strategic destination for Brazilian meat exports, ranking second and accounting for 12 % of Brazilian beef shipments. In 2025 (January–June), exports to the U.S. grew 33 % versus the same period in 2024, reflecting stronger trade ties and higher demand.
Brazil was the third-largest meat supplier to the U.S. in 2024 but took the lead in 2025, surpassing Australia and Canada, which typically command higher prices.
Although Brazil and the U.S. might still reach an agreement before August 1 to lower the rate, the announced tariff has already raised concerns. Once previously contracted Brazilian shipments arrive and face the new tariff, the resulting price increase will severely undermine the competitiveness of Brazilian products in the U.S. market.
If the 50 % tariff is maintained, and considering Brazil already pays 26.4 % on imports outside the “Others” category, the total tariff burden would rise to 76.4 % from August 1.
Such a high tariff could markedly shift U.S. import dynamics, potentially boosting demand for Australian beef (assuming Australia maintains its current 10 % rate). It is essential to monitor this closely. Australia is the second-largest global beef exporter, though its volumes are less than half of Brazil's. It will be important to see how Australia can meet any new demand if Brazilian exports remain restrained.
Vegetable Oils and Fats
Although vegetable oils have a limited share of Brazilian exports to the U.S., beef tallow could be heavily impacted. Since 2023, Brazil has dramatically increased its tallow exports, with the U.S. as the main destination. In 2024, of the 319 thousand tons exported, 303 thousand tons (94 %) went to the U.S., making Brazil the largest supplier of beef tallow to the U.S., accounting for about 38 % of U.S. imports. In 2025, this share remains near 90 %. June marked the highest monthly tallow export volume on record—72.8 thousand tons, of which 71.6 thousand tons were purchased by the U.S.
New U.S. biofuel policies had already signaled tougher conditions for Brazilian suppliers. The fiscal credit 45Z will not incentivize fuels produced with imported inputs, and proposed Renewable Fuel Obligations (RVOs) would grant only 50 % of a RIN to fuels with imported feedstocks. As a result, Brazilian tallow’s competitiveness was expected to decline in the U.S. market from 2026, leading to lower exports.
Until then, shipments were expected to remain firm through December, as U.S. buyers took advantage of favorable prices. With a possible 50 % tariff in place, however, Brazilian tallow exports are likely to face significant headwinds later this year.
Coffee
Two groups would be strongly affected by the tariff: Brazilian coffee exporters and the U.S. coffee industry and consumers. The United States is the world’s largest coffee consumer and Brazil’s top buyer. In 2024, Brazil exported 8.13 million 60-kg bags of coffee to the U.S., representing over 16 % of Brazil’s total exports that year, according to Cecafé (Brazilian Coffee Exporters Council).
Other major destinations for Brazilian coffee include Germany (7.6 million bags), Belgium, Italy, Japan, and Spain, among others. USDA data show that in 2024, Brazil accounted for nearly 34 % of all U.S. coffee imports, underscoring the strategic importance of Brazilian coffee to the American market.
The tariffs would substantially reduce the competitiveness of Brazilian coffee in the U.S., hindering market access and squeezing exporters’ margins.
Conversely, the U.S. coffee industry and consumers would face higher costs. Since 2024, global coffee prices have risen sharply due to climate-related production challenges, driving up retail prices in the U.S.
U.S. Bureau of Labor Statistics data show that cumulative inflation for roasted and ground coffee reached 32.4 % as of May 2025, straining consumption. The new tariffs are likely to further amplify consumer price inflation.
According to the U.S. National Coffee Association (NCA), the coffee industry’s economic impact in the U.S. reached US$ 343.2 billion in 2022, supporting about 2.2 million jobs. Each dollar spent on imported coffee generates US$ 43 in the American economy, highlighting its strategic significance.
Another factor is U.S.-Canada trade. Canada is a key destination for U.S. roasted and ground coffee exports and green coffee re-exports. However, Canada recently imposed tariffs on U.S. products, which may further challenge the U.S. coffee industry.
Additionally, the U.S. has imposed tariffs on other major coffee suppliers: 10 % on Colombia, 20 % on Vietnam, and 32 % on Indonesia. This indicates that key coffee exporters to the U.S. are facing trade barriers, suggesting the American coffee sector may be among the most affected by these measures.
Ethanol
The United States is a crucial partner in the ethanol trade, accounting for 90–95 % of global anhydrous ethanol trade over the past five years. Between 2020 and 2024, Brazil exported an average of 480 000 m³ per year of anhydrous ethanol to the U.S., all from its Central-South region. Meanwhile, Brazil’s Northeast, which is ethanol-deficient, imported about 400 000 m³ annually (40 % from the U.S.) during the same period.
U.S. demand for Brazilian ethanol is driven by the national Renewable Fuels Standard (RFS) and California’s Low Carbon Fuel Standard (LCFS). Although the U.S. produces more ethanol than it consumes, it imports cane ethanol annually—primarily from Brazil—to meet renewable fuel mandates.
Cane ethanol has a carbon intensity (CI) that can reduce emissions by over 50 % compared to gasoline, outperforming U.S. corn ethanol in this respect.
The new tariffs pose barriers to Brazilian ethanol in the U.S. market. In the short term, impacts should be limited, as Brazil will blend 30 % anhydrous ethanol into gasoline in August, likely absorbing surplus domestically. Over the medium/long term, Brazil may target other markets—such as Japan and Southeast Asian countries (e.g., Vietnam)—that lack sufficient domestic production.
Conversely, if Brazil retaliates by raising its ethanol import rate from 18 % to 50 %, it could tighten Brazil’s own ethanol supply–demand balance in 2025 and trigger import needs at certain times of the year, potentially driving domestic ethanol prices higher.
Grains and Cotton
Brazil and the United States are among the world’s top producers of soybeans, corn, and cotton. Both ensure self-sufficiency and lead global exports. For soybeans and cotton, Brazil ranks first, followed by the U.S. For corn, the U.S. leads, followed by Brazil.
Since neither country is a net importer of these commodities, U.S. tariffs on Brazil—and any Brazilian retaliation—have limited direct impact.
The primary effect on these markets is via exchange rates. With the real depreciating after the White House tariff announcement, Brazilian commodities may gain competitiveness globally.
Fertilizers
Brazil is a major fertilizer importer because domestic production does not fully meet agricultural demand. Therefore, the new U.S. import tariffs should not directly affect Brazil’s fertilizer market.
However, two factors merit attention. First, currency depreciation resulting from trade tensions could raise the cost of imported inputs. Nitrogen and phosphate fertilizer prices are already high, and with the 2025/26 crop season approaching, a weaker real could further pressure production costs.
Second, the U.S. is a key supplier of certain fertilizers to Brazil—such as NP (nitrogen-phosphorus blends) and sulfur. Any Brazilian retaliatory measures affecting this trade could have unintended side effects that deserve monitoring.