

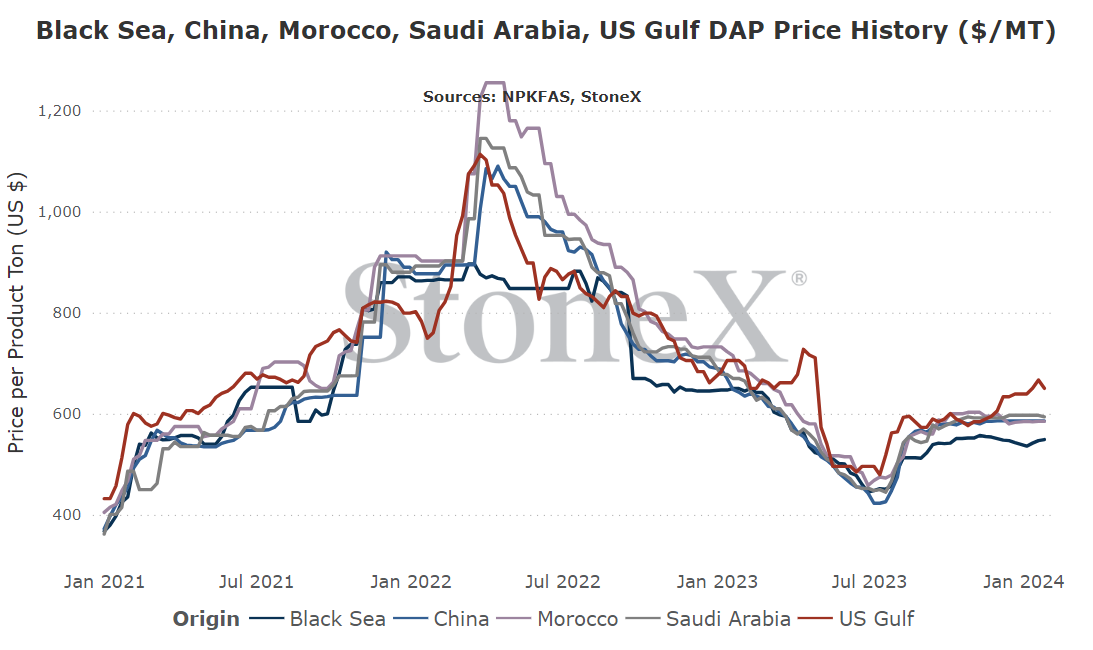
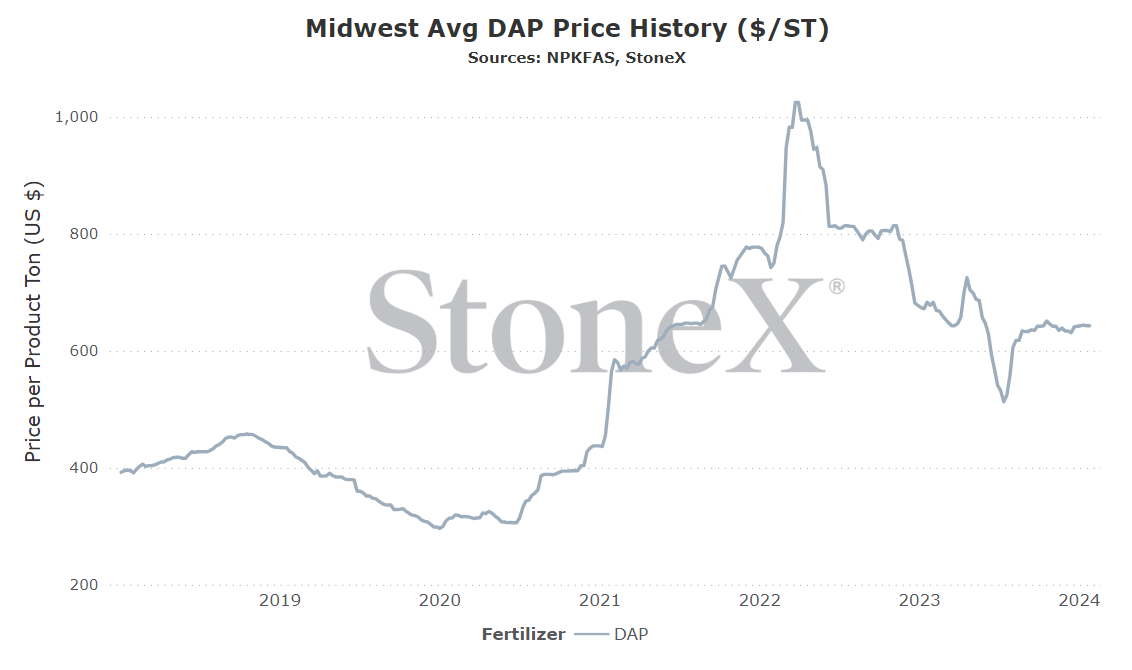
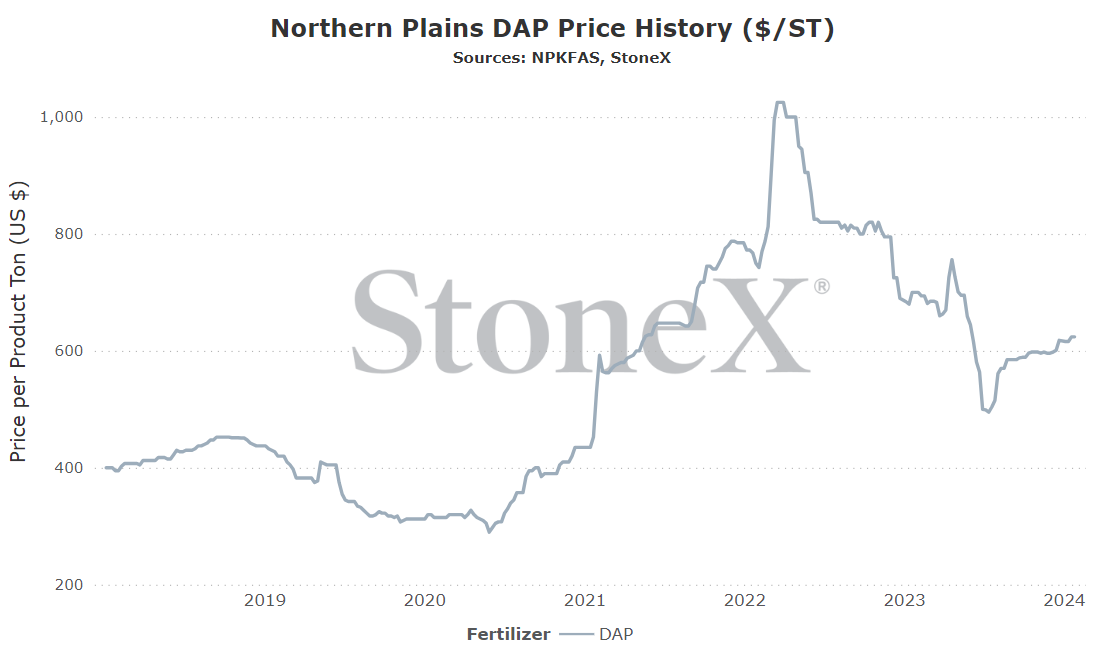
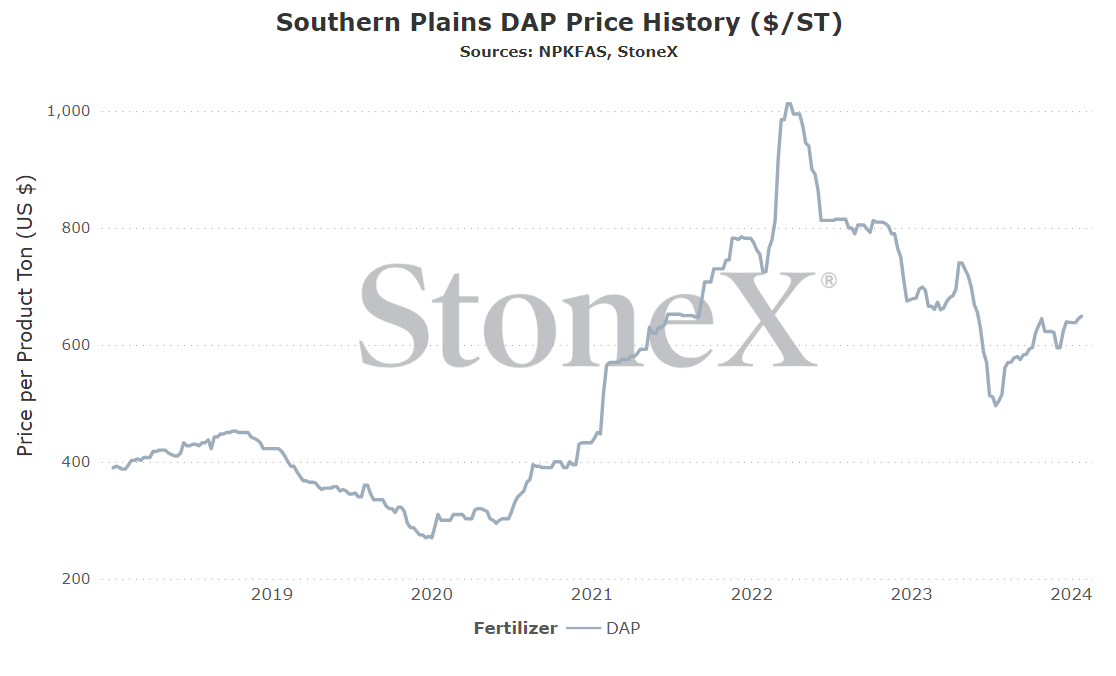
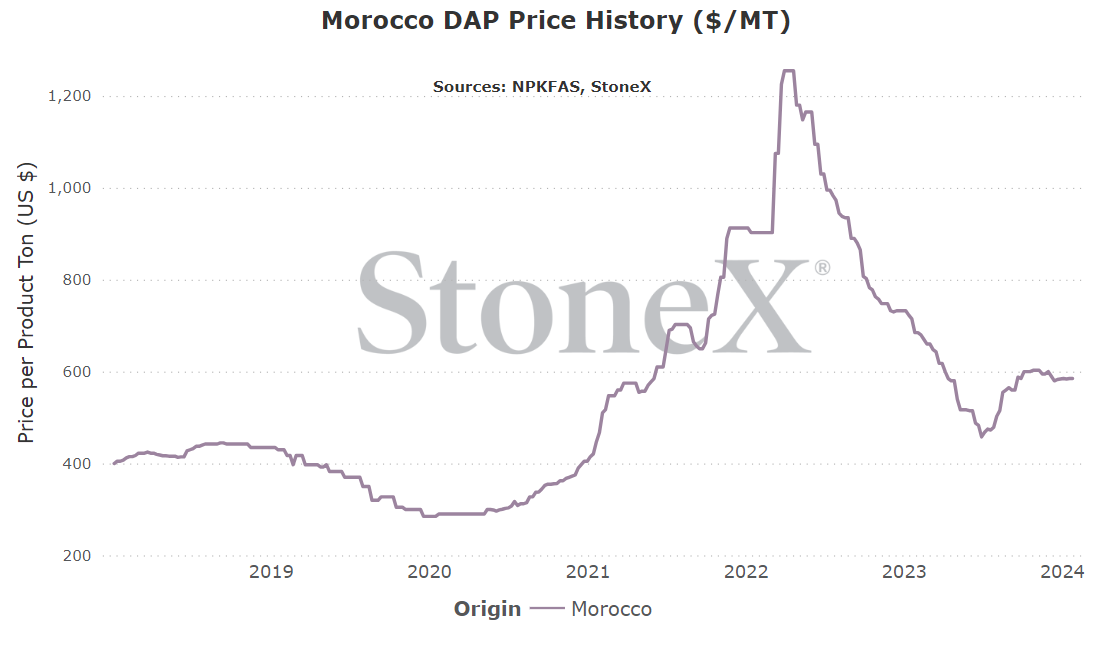
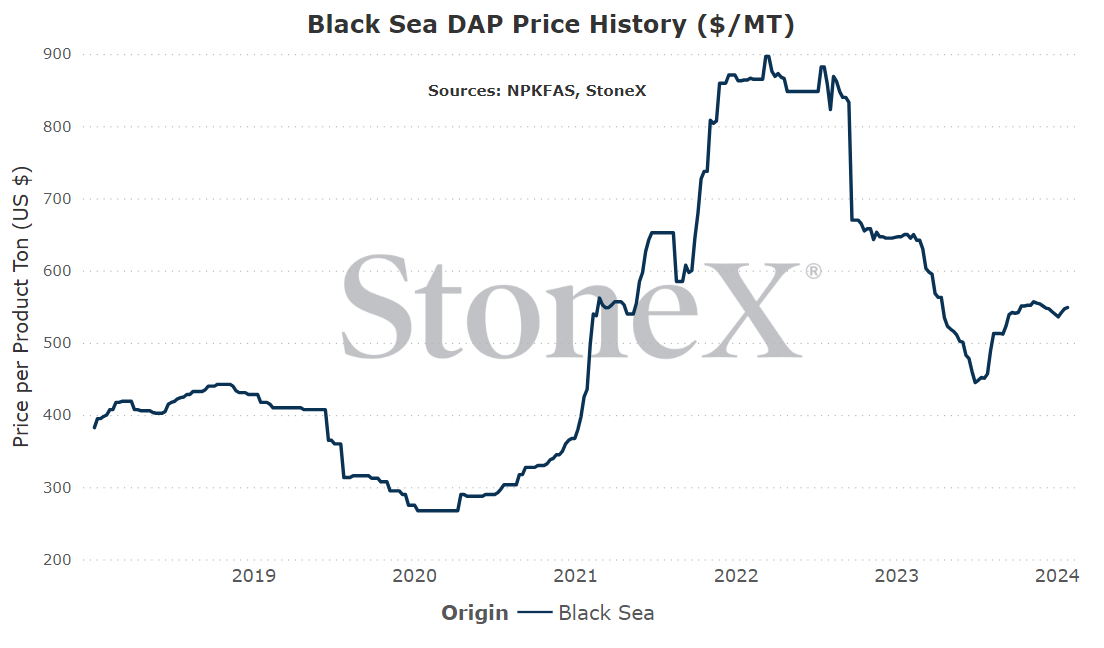
I will say this now and will say it going forward to eternity: these are the flat price graphs for each individual location. Your price where you are is going to be different. There are logistics. There is the cost of storage/interest/insurance/etc. These graphs should not be taken as "it shows the price at $700, why isn't my price $700". These graphs should be used to give an appreciation for price movements.
All values are in metric tons and USD currency.
Global
I'm starting to get a little skeptical of global phosphate values. There has been decent sales activity being reported and there is still the fear of Chinese exports being blocked...yet values are mostly flat. What happens when the buying dries up and/or China comes back to normal?
As the world prepares for coming application demand, values should hold but beware. I cannot help but have a gut feel that lower values are coming?
Unfortunately, I do not think the correction will happen in the next month or two. There is too much demand around the world. However, once things slow down, I'm worried about how the industry will handle it.
North America
North America is still struggling with U.S. duties on 3 of the largest phosphate exporters in the world: China, Morocco, Russia. That means less opportunity for outside help to refill the coffers before spring. Also, the large fall emptied warehouses so logistics are currently more stressed than normal trying to get prepared for spring.
The lead up to spring should see values relatively supported (should see some volatility as different POV's fight) thru preplant season. However, a solid reset should be expected following the spring run...unfortunately, not in time for spring applications.
There are a lot of reasons to be bearish the phosphate market today but unfortunately, I do not think those situations will trigger in time to matter for the coming application.
While the fertilizer futures market is far from as liquid as its grain counterparts, it is still active and gives us an insight into what the market is thinking.
Please note that the values below can and will change daily. This is merely a look at where they are as of writing:
|
Westward bound Saudi Arabian vessels dealing with Red Sea difficulties
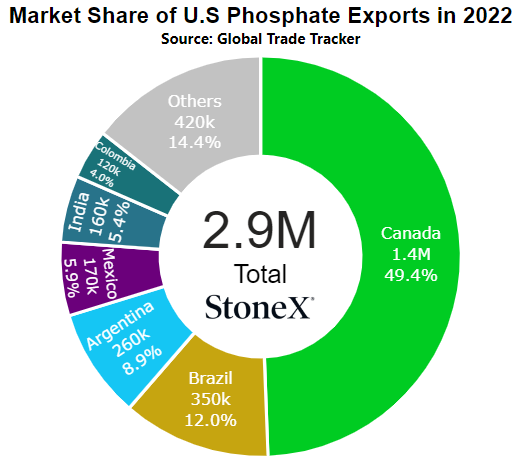
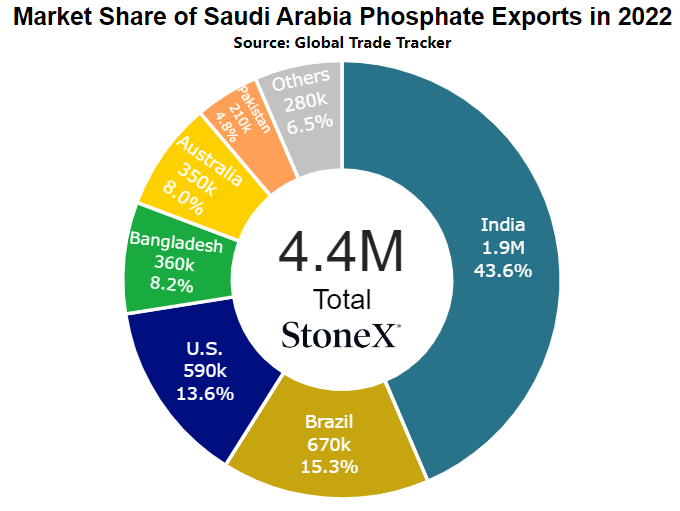
For a lot of phosphates heading to North/South America, the Red Sea situation has not been a major news story. However, that is not the case for Saudi Arabia who has been so very important an import partner for North America as one of the few major points without duties.
Fortunately, the attacks in the Red Sea which has discouraged some vessel lines to stay away does not mean it is impossible to reach the west. The route around the south tip of Africa is available...but it comes with costs. The freight rate per vessel goes up by hundreds of thousands of dollars. While less than stellar, that cost is not nearly as bad when spread across a 30 - 40K ton load.
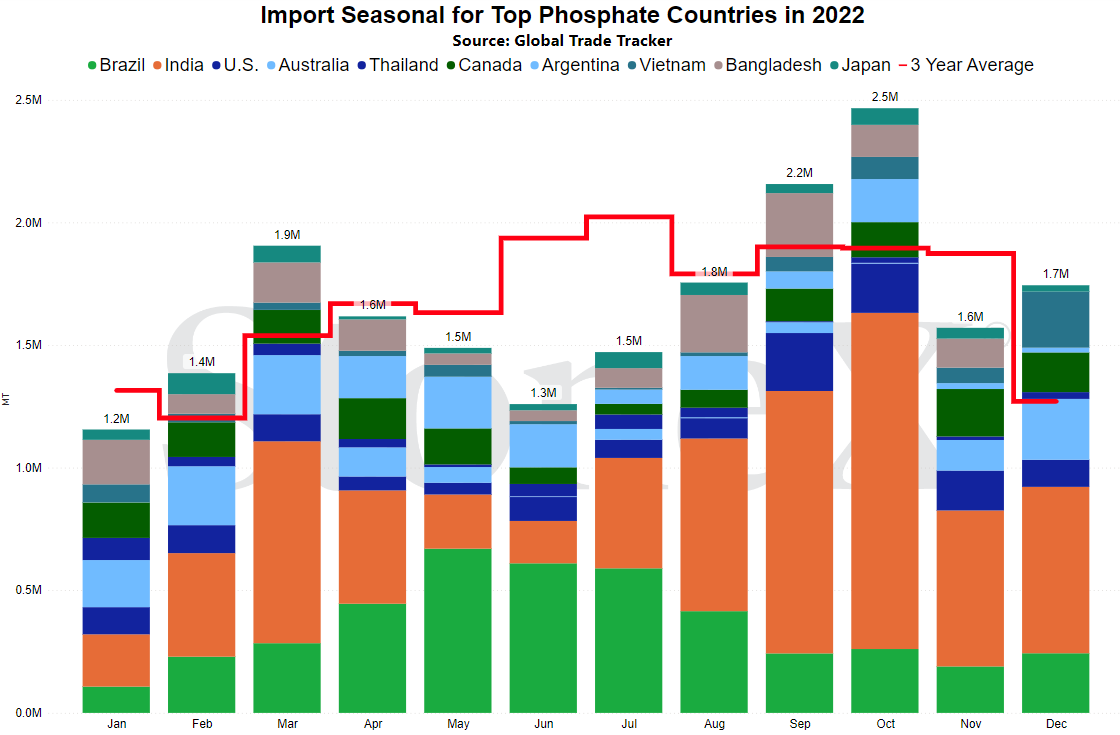
The worse issue is the timing with N.A. spring application coming quickly. The south route takes a reported 10 - 15 additional days. For most of the calendar, that isn't a big deal but in the lead up to spring following such a large fall run that emptied the system, this could cause issues.
Ultimately, the Red Sea is not shut down completely as vessels are mostly opting to transit. For those not willing to risk it, it changes things for them and for N.A.
Still watching China for any changes to their export programs
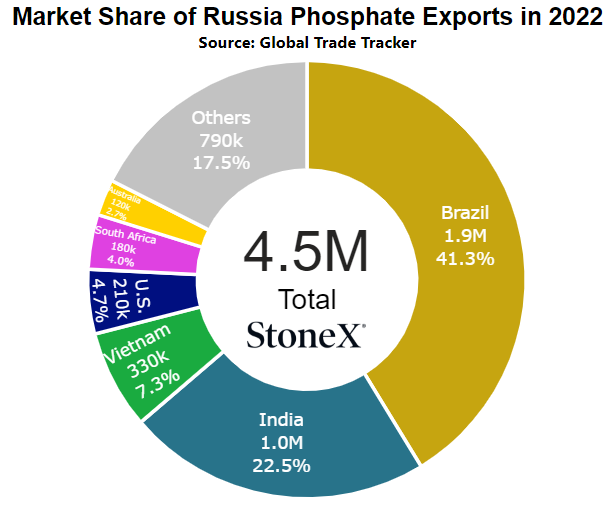
As mentioned repeatedly in the past, China is typically the world's largest DAP/MAP exporter. That was when fertilizer markets were allowed to flow freely. However, with the last 3 years of massive price volatility and supply concerns, the central government is now paying attention and making demand to what does and does not happen.
In regards to their urea exports, the government stepped in and reduced their output by approximately 40% on average per month thru all of 2024, until March 2025. China represents about 10% of global exports (normally) so this was seen as a decent loss of available tonnage in the world which helps keep values higher. The fear is that big cuts will be made to phosphate exports as well. If it is a big deal for the urea market, it would be huge for phosphate.
Unfortunately, it is China. That means it is very difficult to impossible to figure out fact from fiction. Even when announcements are made, we have to always watch for changed. We have seen China say that they will not provide much urea to an India tender and then shock the world by selling 1M ton. The next tender we expected them to play a major part...just to back peddle and largely not participate.
Hopefully we will see them play a normal role and keep the world decently supplied. Unfortunately, we need to keep an eye on them.
Still no firm details on U.S. countervailing duties
The U.S. countervailing duty saga continues and the story isn't getting much clearer.
As a quick recap, Chinese produced phosphates had duties in place during the Trump administration and those have not changed. As a result, China no longer sends product here. Then, back during the summer of 2020, phosphate prices plummeted to values below some U.S. producer production values. Some production was curtailed in an effort to rebalance the S&D and bring values above their production costs. While it ultimately worked, they were backed into a corner.
As a result, Mosaic filed paperwork asking for countervailing duties to be put into place against Russian and Moroccan produced phosphate. That case was ultimately approved and supplies from both nations slowed down to a crawl...then the world caught fire. Global values started to skyrocket with the combination of high grain prices and heightened political tensions around the world causing fear that exports would cease to exist. Even during this near record high value period, the duties remained.
Today, a lot of challenges have risen from multiple organizations across the U.S. putting pressure on D.C. to reconsider the duties. Now, we live in a world where we are in the middle of some decisions being made, new challenges being brought forward, reconsiderations by the ITC/DOC, etc. It has become very hard to figure out what is fact and what is fiction. Whether this is just part of the process or part of the plan to keep the market uneducated doesn't matter. Duties are still in place.
It is still important to note that even without duties against these 3 countries, North American values would still be high. Going back thru price graphs, NOLA values track higher and lower with world values. That is just the way free markets work. However, this winter/spring might have felt significantly better without the rates. NOLA DAP has moved to as high as a $50 - $60 premium over the world's next highest major price point in Saudi Arabia. That is not historically typical. We also would have likely seen much more adequate supplies available to N.A. Logistics may have struggled to get everything in place, but the product would still likely be here.
In the end, this is here we sit. Import supply chains from 3 of the world's largest exporting countries remain largely blocked and we are staring at a spring season that could deal with tight inventories.
Spring demand questions rising with higher price/lower corn price
Speaking of high prices, it is very hard to look at current phosphate values and get excited. Certainly not with grain values where they are which is leading us to the question of spring demand.
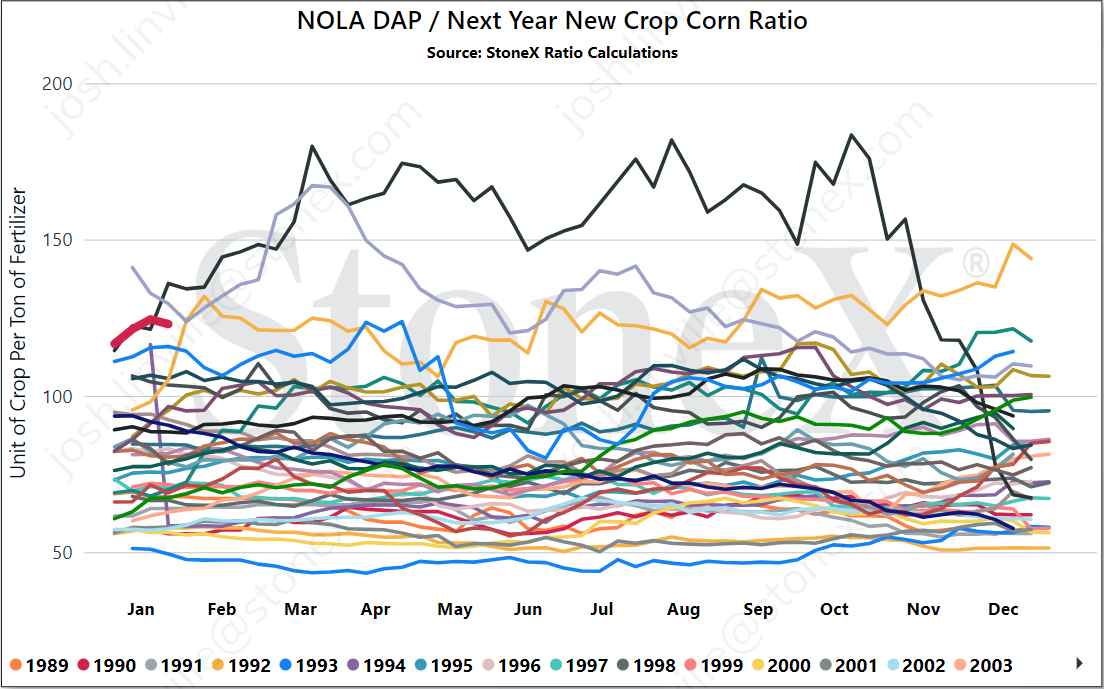
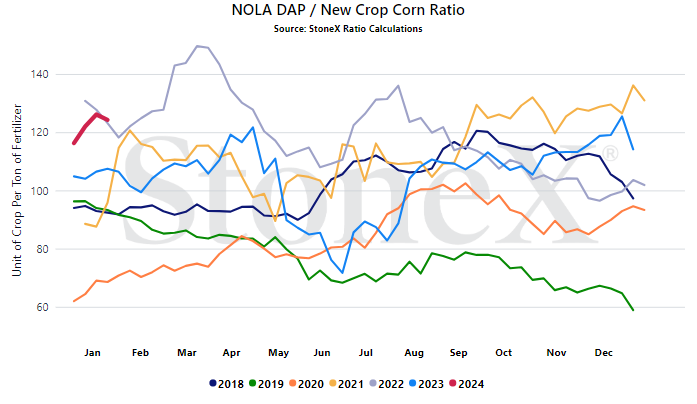
Focusing on the corn/DAP relationship, the start of 2024 has been rough. The ratio graph section below shows the Chicago corn/NOLA DAP ratio going back to 2018. For the first week of the year, 2024 started as the 2nd highest in that period. To better put to scale just how high the start of the year was, I've included the same graph which goes all the way back to 1989. This wasn't just the 2nd worst start to a year since 2018. It was the 2nd worst since 1989. Now, as we begin February, December '24 corn is sitting at $4.80 and NOLA DAP at $580 for a ratio of 121. That puts the start of February in the top 4 going back to 1989.
Now, there are a ton of different inputs that have to be factored into a farm equation. One simply cannot cut phosphate because it is high price and put top end yield at risk. There is too much at stake. On the flip side, for those with healthy phosphate soil levels, a reduction of rate may not make any difference. Also, "fringe" corn acres (those that were not corn prior to the ethanol boom) may not have a choice but to cut input costs to help balance 2024. Phosphate is likely going to be near or at the front of that line.
Unfortunately, even if we see demand wane this spring, the effect will not likely take place until late spring/summer. Wish that were not the case.
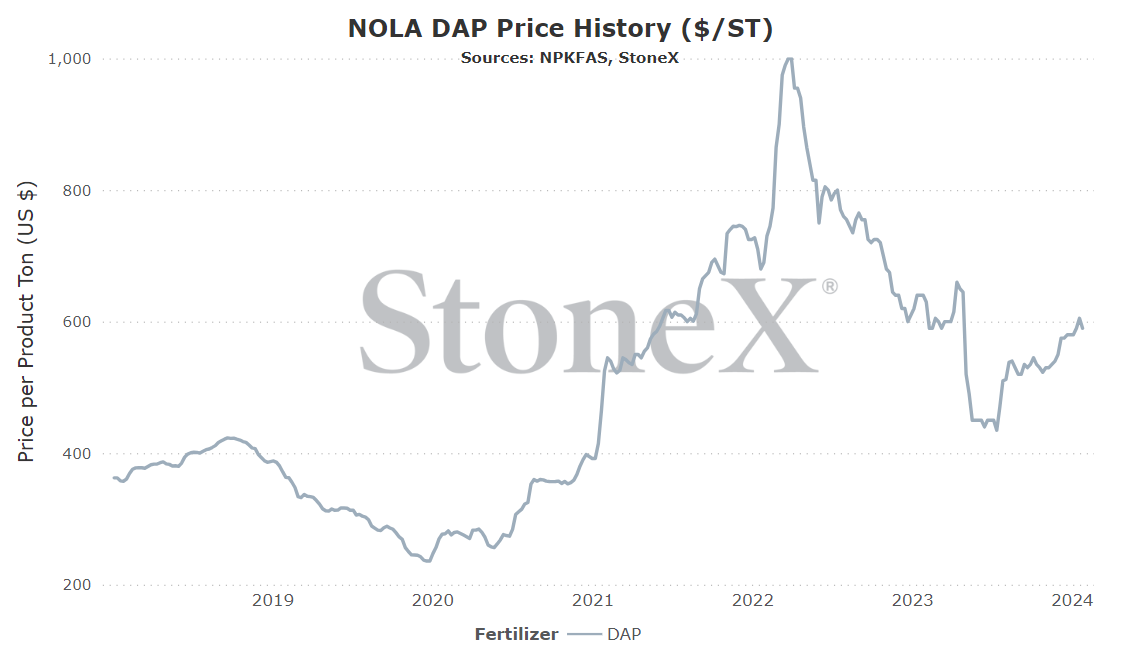
NOLA/New Orleans, Louisiana DAP price comparison
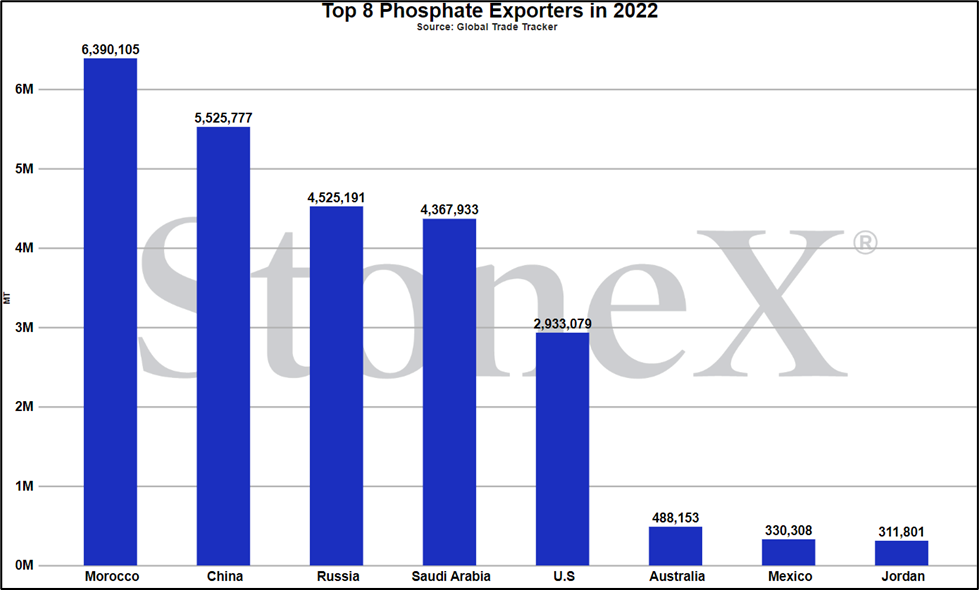
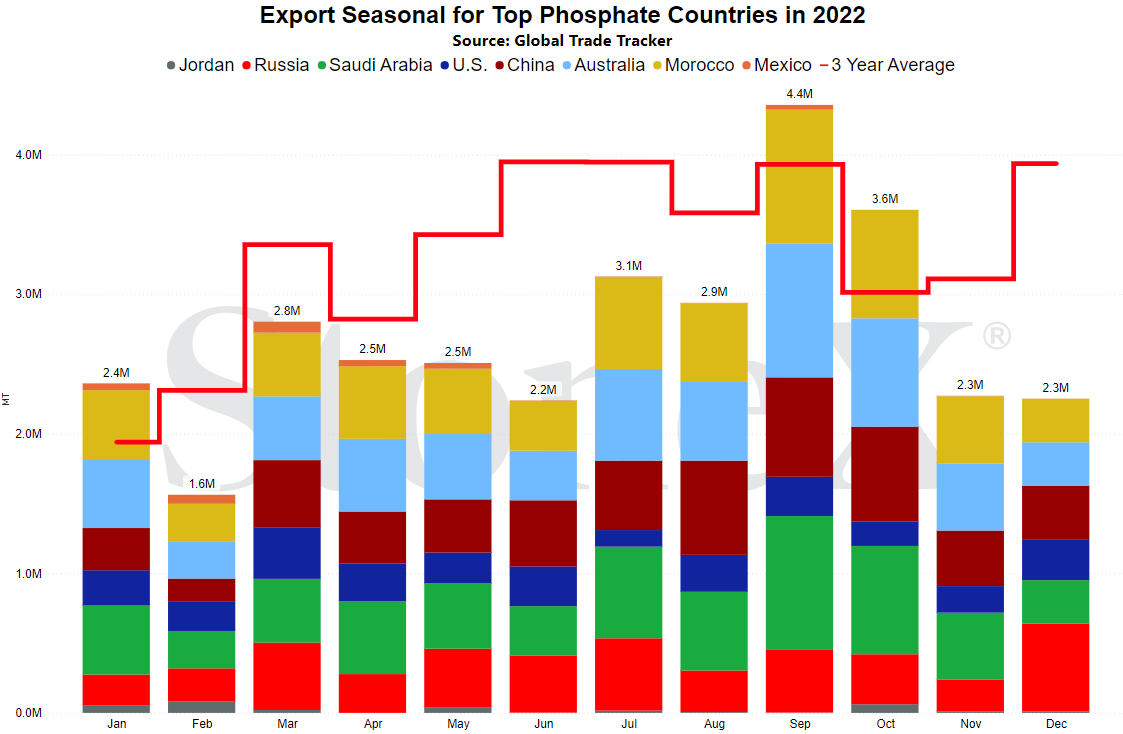
Number 5 global exporter in 2022
Price comparisons
Vs 30 days ago - +2% or approximately $10 higher
Vs 90 days ago - +11% or approximately $60 higher
Vs 6 months ago - +26% or approximately $120 higher
Vs 1 year ago - -8% or approximately $50 lower
U.S. Midwest Average (using multiple points across Midwest) price comparison
Vs 30 days ago - unchanged vs last month
Vs 90 days ago - -1% or approximately $9 lower
Vs 6 months ago - +19% or approximately $104 higher
Vs 1 year ago - -7% or approximately $45 lower
U.S. Northern Plains Average price comparison
Vs 30 days ago - +1% or approximately $6 higher
Vs 90 days ago - +4% or approximately $26 higher
Vs 6 months ago - +24% or approximately $120 higher
Vs 1 year ago - -11% or approximately $76 lower
U.S. Southern Plains Average price comparison
Vs 30 days ago - +2% or approximately $10 higher
Vs 90 days ago - +3% or approximately $16 higher
Vs 6 months ago - +29% or approximately $145 higher
Vs 1 year ago - -7% or approximately $50 lower
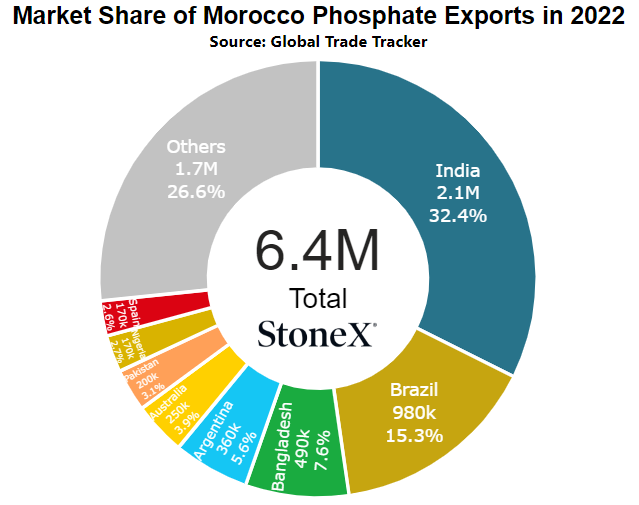
Morocco DAP price comparison
Number 1 global exporter in 2022
Price comparisons:
Vs 30 days ago - unchanged vs last month
Vs 90 days ago - -3% or approximately $15 lower
Vs 6 months ago - +24% or approximately $113 higher
Vs 1 year ago - -15% or approximately $100 lower
Black Sea DAP price comparison
Number 3 exporter of DAP/MAP in 2022
Price comparisons:
Vs 30 days ago - +1% or approximately $6 higher
Vs 90 days ago - unchanged vs last month
Vs 6 months ago - +22% or approximately $98 higher
Vs 1 year ago - -16% or approximately $102 lower
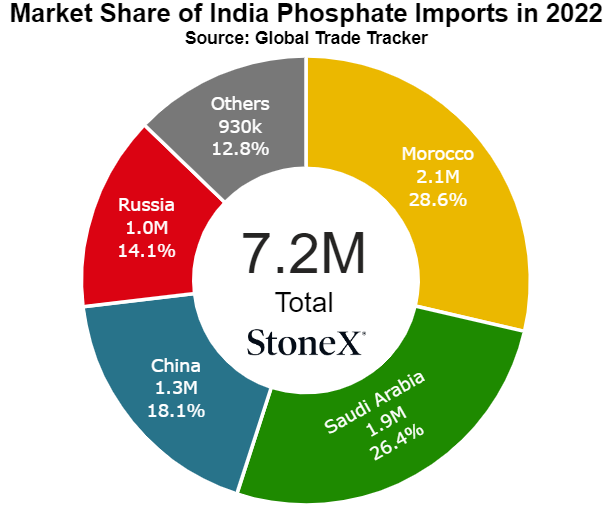
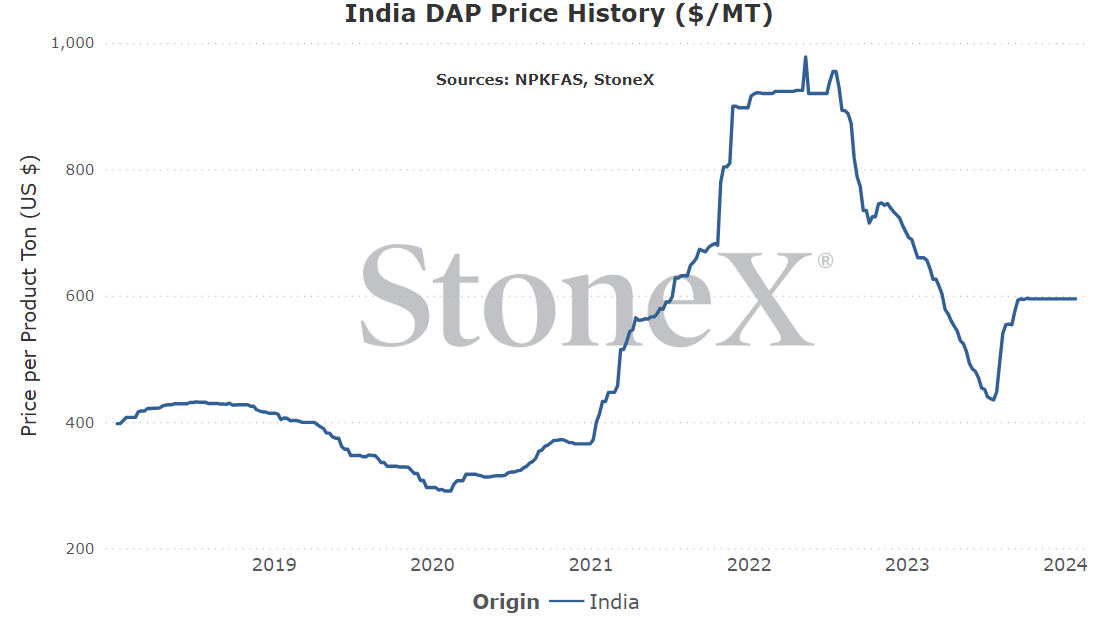
India DAP price comparison
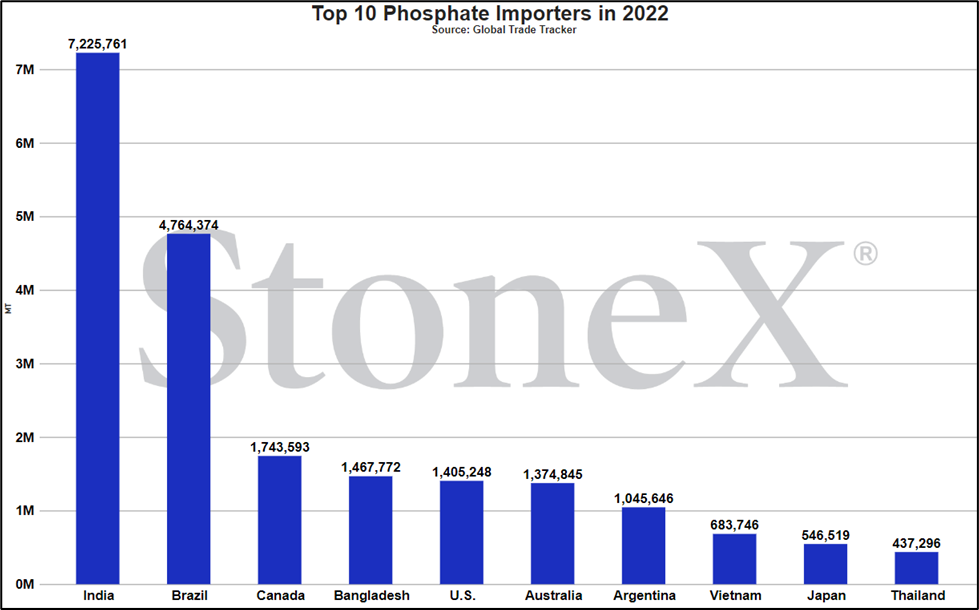
Number 1 global importer in 2022
Price comparisons:
Vs 30 days ago - unchanged vs last month
Vs 90 days ago - unchanged vs 3 months earlier
Vs 6 months ago - +37% or approximately $160 higher
Vs 1 year ago - -10% or approximately $65 lower
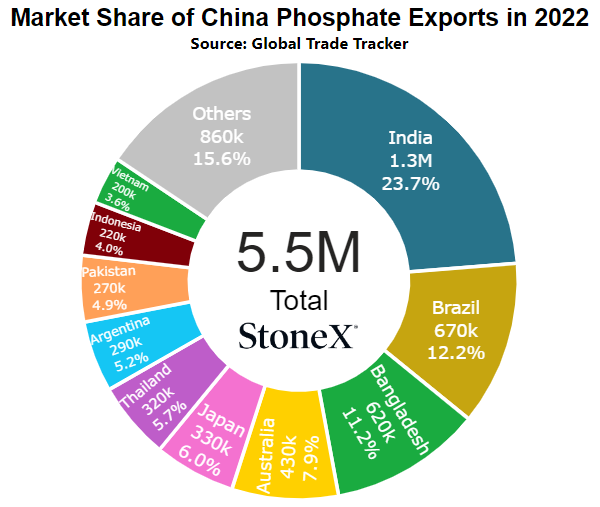
China DAP price comparison
Number 2 global exporter in 2022
Price comparisons:
Vs 30 days ago - unchanged vs last month
Vs 90 days ago - +1% or approximately $4 higher
Vs 6 months ago - +38% or approximately $161 higher
Vs 1 year ago - -9% or approximately $57 lower
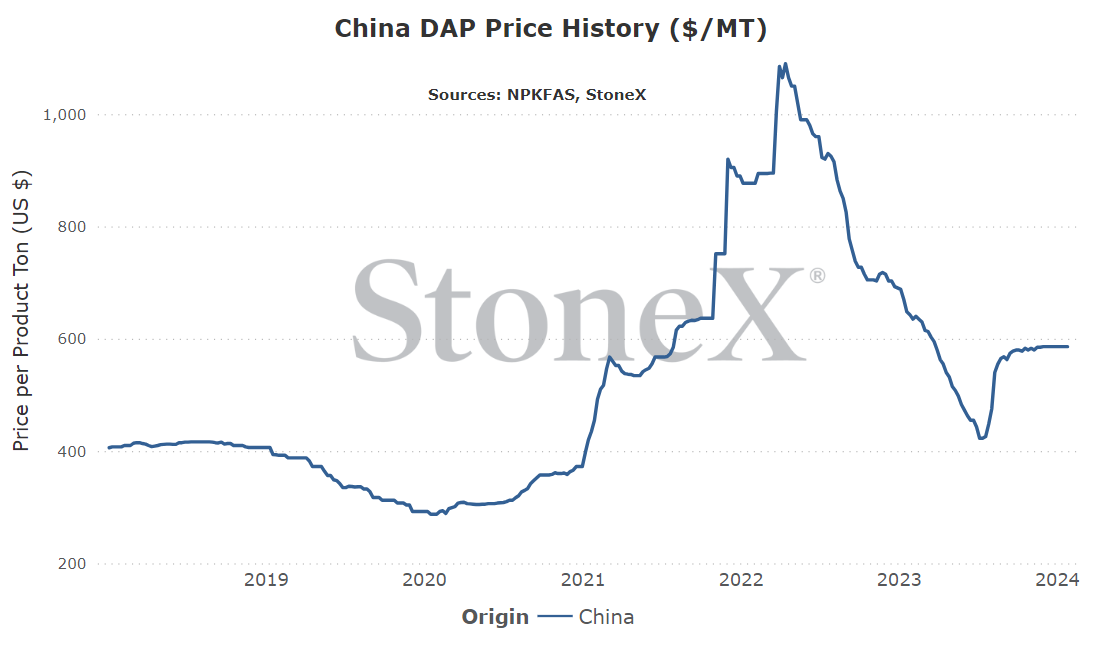
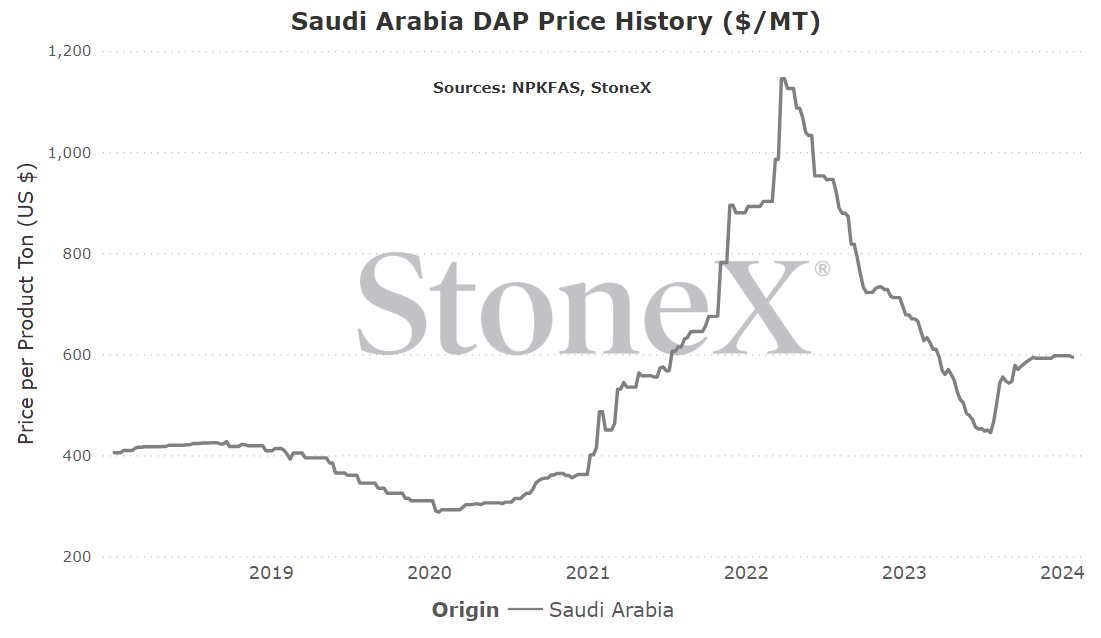
Saudi Arabia DAP price comparison
Number 4 global exporter in 2022
Price comparisons:
Vs 30 days ago - -1% or approximately $4 lower
Vs 90 days ago - +1% or approximately $4 higher
Vs 6 months ago - +33% or approximately $149 higher
Vs 1 year ago - -11% or approximately $77 lower
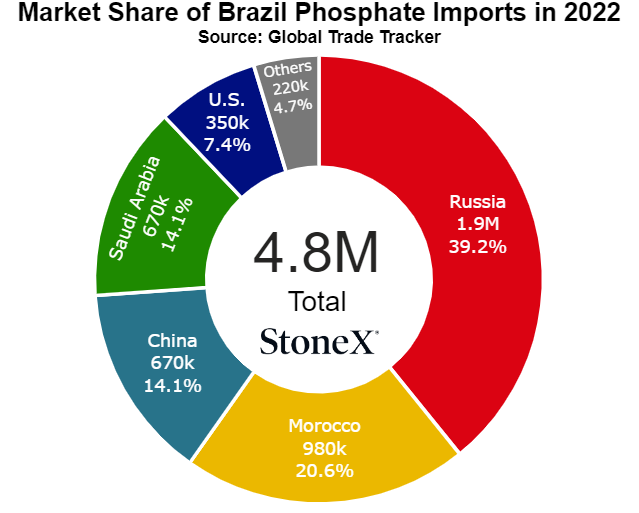
Brazil DAP price comparison
Number 2 global importer in 2022
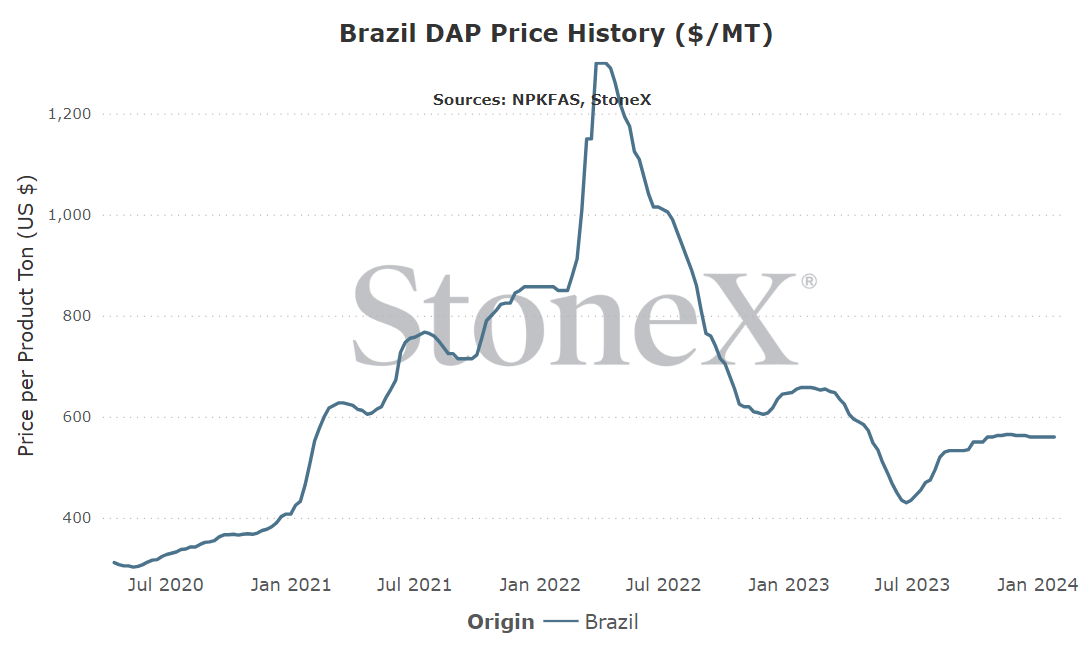
Price comparisons
Vs 30 days ago - unchanged vs last month
Vs 90 days ago - unchanged vs 3 months earlier
Vs 6 months ago - +19% or approximately $90 higher
Vs 1 year ago - -15% or approximately $98 lower
- China continues to follow thru with export cuts – China is typically the largest producer and exporter of DAP/MAP in the world. If they continue to follow thru with cuts, it will leave a supply hole in the world of phosphate which will likely be filled with higher pricing. It is China so we never know what the government will decide to do but so far, we need to proceed with the expectation that they are going to restrict exports.
- N.A. inventories remain tight leading into spring – North America is in a tough spot. The large fall emptied the system. Short time between end of fall and start of spring. The U.S. continues to keep duties in place for Moroccan/Russian/Chinese produced phosphate (3 of the world's largest). The system is tightly supplied today which is why values continue to hold where they are...with the possibility of pushing higher.
- Further attacks in the Middle East further impede vessel traffic – North America has become a large receiver of phosphate from Saudi Arabia following U.S. duties. However, Houthi rebel attacks on vessels transiting the Red Sea have caused some lines to opt for war time conditions in contracts and sail south around Africa. This adds a couple week's sail time...and adds a lot of additional cost on logistics that eventually find their way to the end user.
- High phosphate values in relation to grain values hurts demand – I have had some in the industry push back on this concept that the high price will hurt demand. They believe that farmers have to apply it so will be forced sooner or later. They might be right but I know when things get hard (financially speaking), cuts need to be made to inputs. A certain amount of application cuts can be made to some fields without risking overall yield potential. If there was ever a time to mine the soil, this is it.
- Fears of carrying inventories to late spring/summer cause a sell off – this is the emotion of the marketplace. Right now, the supply side is in almost complete control. Supplies are tight and spring is right around the corner. However, at some point, nerves will fray. Folks will become nervous that they may carry inventories into late spring/summer...at substantially lower values. At some point, it is better to cut price a little and ensure some sales to offload positions. If one starts, others may very well follow. More likely an early April situation.
- China exports at a heavier pace than expected – I do not know what the Chinese government is going to do. Most others do not know what they are going to do. It is conceivable that we could find out that they have changed their minds and start exporting at normal/heavy paces. If that happens, the world market is going to take notice and it will be very difficult for prices to hold.
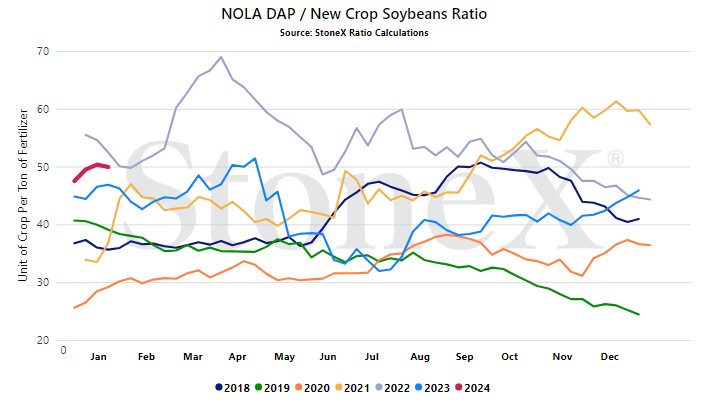
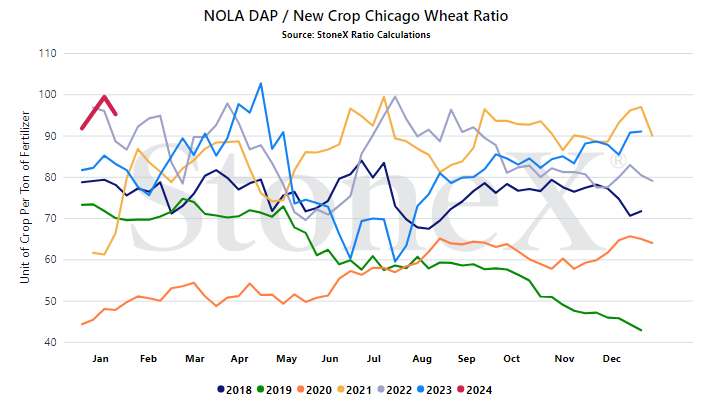
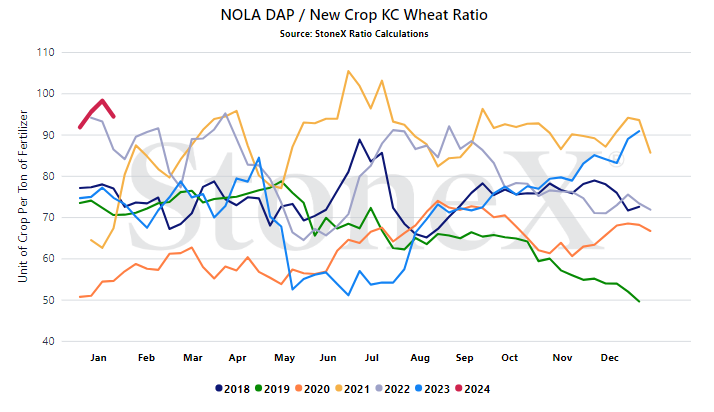
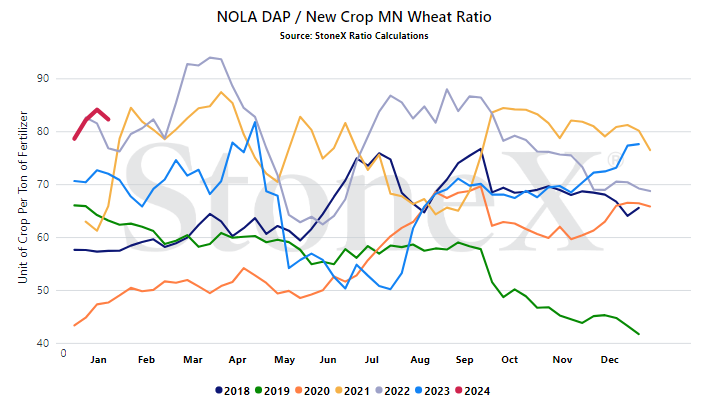
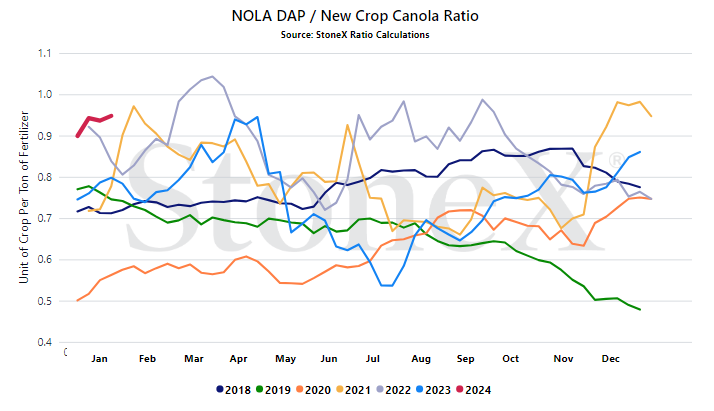
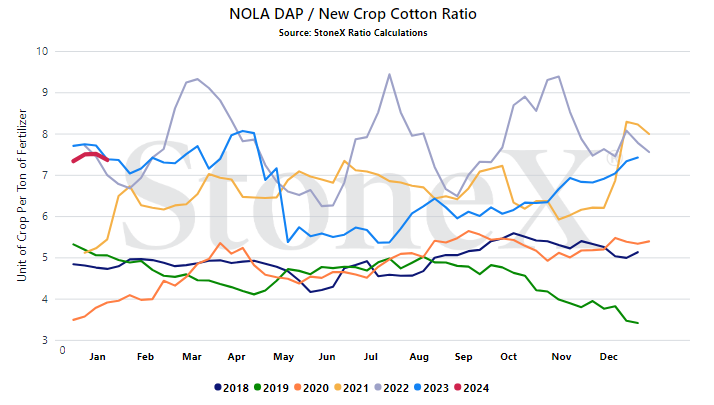
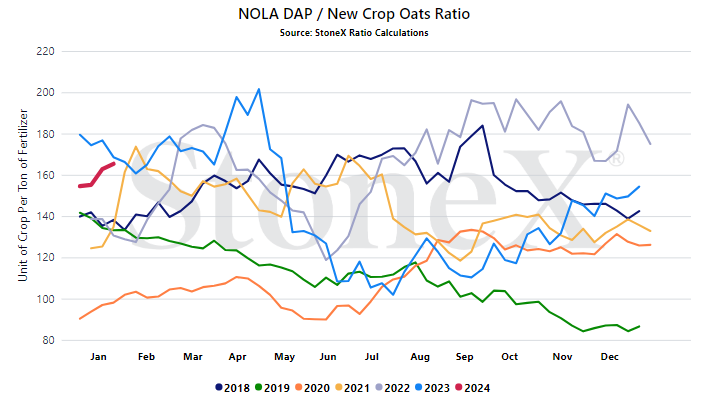
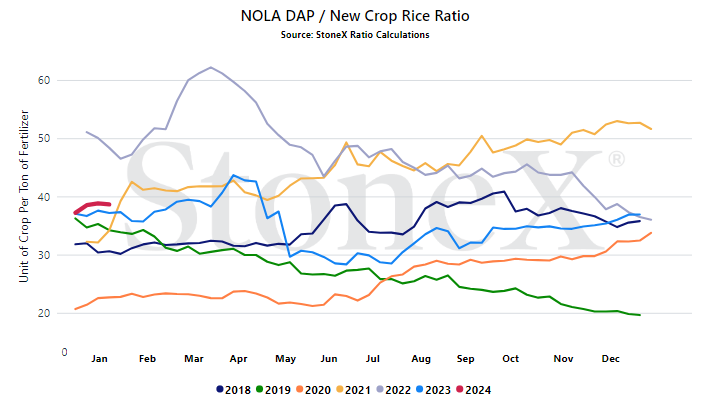
We believe that only looking at the flat price of either grains or fertilizer can be misleading:
-
Only selling grain can hurt you if fertilizer prices rise substantially
-
Only buying fertilizer can hurt you if grain prices fall
We look at the ratio "value" to get a better indication of where we are or how many bushels of X does it take to pay for 1 ton of fertilizer.
Would you rather:
-
Spend 150 bushels to pay for 1 ton of DAP
-
Spend 80 bushels to pay for 1 ton of DAP
When we compare the current ratio value against recent years, we start to see if we are high or low.
YOUR VALUES MAY LOOK DIFFERENT
This graph looks at the NOLA DAP price vs the flat grain price. There are no logistics on either product. Your location will look different due to fertilizer logistical costs, grain basis, etc.
- Red Sea vessel shipment ability - this isn't nearly as important as it is for urea, but for those in the west, it is still important given Saudi Arabia's location. If the Red Sea continues to a risk option for sailing, vessels may continue to opt to go south around Africa. That means larger freight rates as well as long sail times. Those timelines and price increases ultimately make their way down the supply chain.
- Middle East tension - the Middle East is currently on edge following the attack on U.S. service members in Jordan which resulted in 3 dead and 30+ injured. The region is holding its breath to see how the U.S. will retaliate. Will it stay focused on Syria? Will Iran be targeted given their backing of the group? If the latter, will the region be plunged into a wider war...which could affect phosphate production in the region.
- Phosphates high price vs grain values - phosphate prices are high when looked at just from a flat price perspective as well as from a grain/phosphate ratio perspective. In fact, for corn/NOLA DAP, 2024 started with the 2nd highest year beginning ratio going back to 1989. While prime farmland will likely continue to pour coals to the fire, "fringe" acres will have decisions to make to be profitable in 2024. That could easily result in lower phosphate application rates.
- N.A. small ending inventories coming out of last fall - we cannot forget about how little was left in the system at the end of the fall season in North America. Part of the reason for elevated prices is the simple fact that it is very hard to refill the system in 90 days. Logistics are stressed. That low supply should keep prices supported.
- Ongoing U.S. countervailing duty rates against Morocco/Russia/China - another reason N.A. values are elevated due to the lack of importer options. The U.S. continues to have duty rates against Moroccan/Russian/Chinese phosphates which means a large portion of global exports will struggle to make their way to N.A. That will keep N.A. aching for supplies in a time when imports were sorely needed.
StoneX Ratio Calculation
The ratio calculation is derived from Bloomberg historical grains values as well as fertilizer values from StoneX, NPKFAS, and Argus.
The calculation is simply dividing the fertilizer price by each grain price.
All data was sourced from StoneX unless otherwise noted.




