

There are two things to consider regarding the global phosphate market.
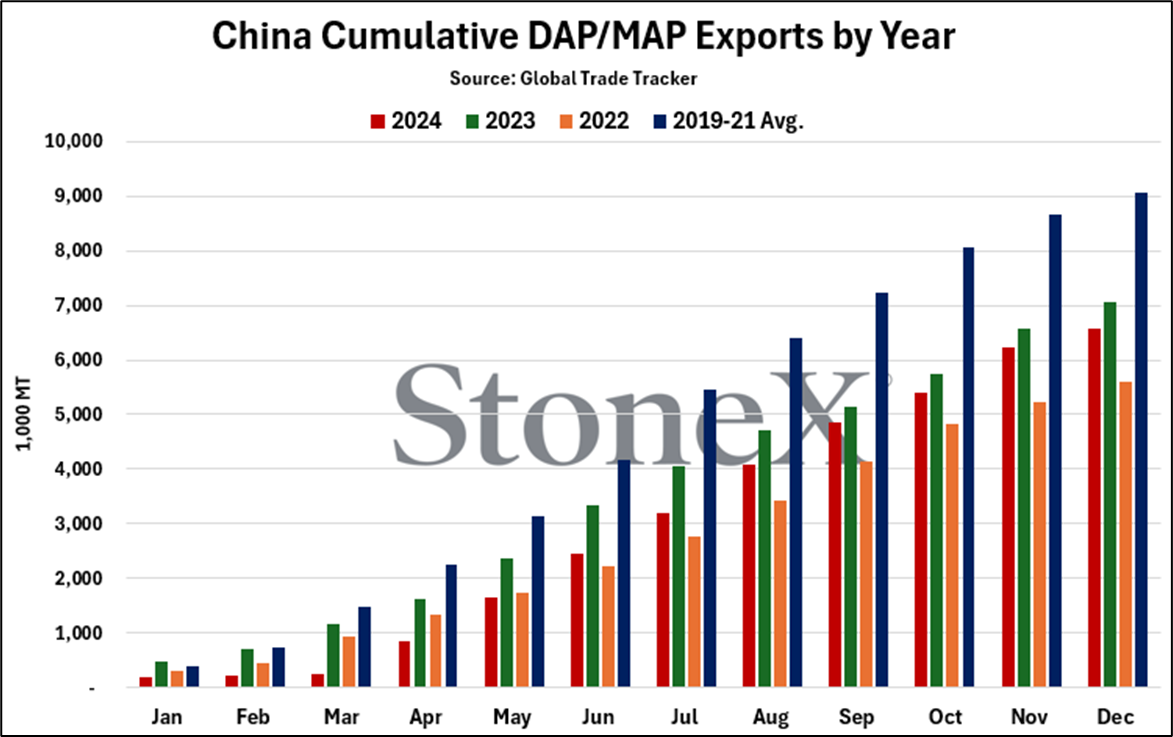
On the one hand, the global S&D is still tight. Chinese exports finished 2024 at just shy of 6.6M tons of DAP/MAP. That is a healthy amount...until you consider that their historic norm is 10M tons. India, the world's largest buyer, started 2025 behind. They were normally start the new year at a comfortable 2M tons in stockpiles. This year they started at 1.2M by some estimates. That creates a fairly tight and supportive fundamental POV.
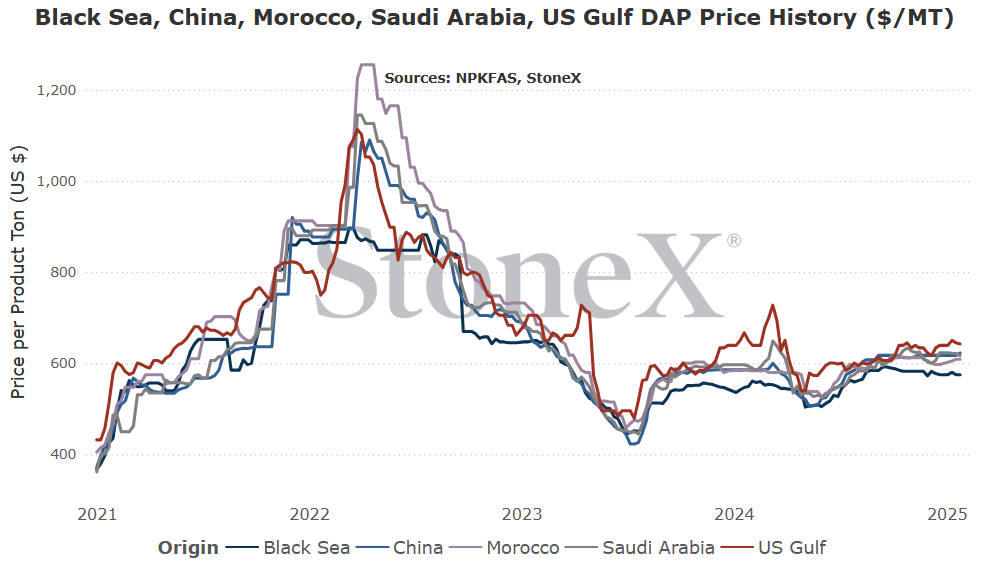
However, then there is the emotion. Farmers around the world are tired of these high prices. Phosphate values never corrected like nitrogen and potash did after early 2022 high's. They only dropped by half, and then have since pushed higher. They are high vs historical values. They are high vs grain values. There just isn't a great way to look at phosphate and feel good. That has caused buyers to be a little more reluctant and consider lower application rates.
Unfortunately for buyers, fundamentals usually win out if nothing changes and right now, nothing looks like it is going to change near term. There is still plenty of global demand even with prices higher. China doesn't look to come back to normal export form. This should keep values steady to higher over the next couple months.
However, as we start looking to April and beyond, it changes. Suddenly, the long northern hemisphere summer starts to loom large. The thought of carrying inventories with a very high month to month rate starts to factor in. Hopefully we will see later Q2/early Q3 price easement...but do not get too excited. Not much reason for prices to drop hugely.

China closes 2024 well behind normal phosphate export levels
We finally have the December 2024 trade data from China...and it certainly didn't help the global phosphate market outlook.
As usual, a bit of backstory to put this into context for those that are new.
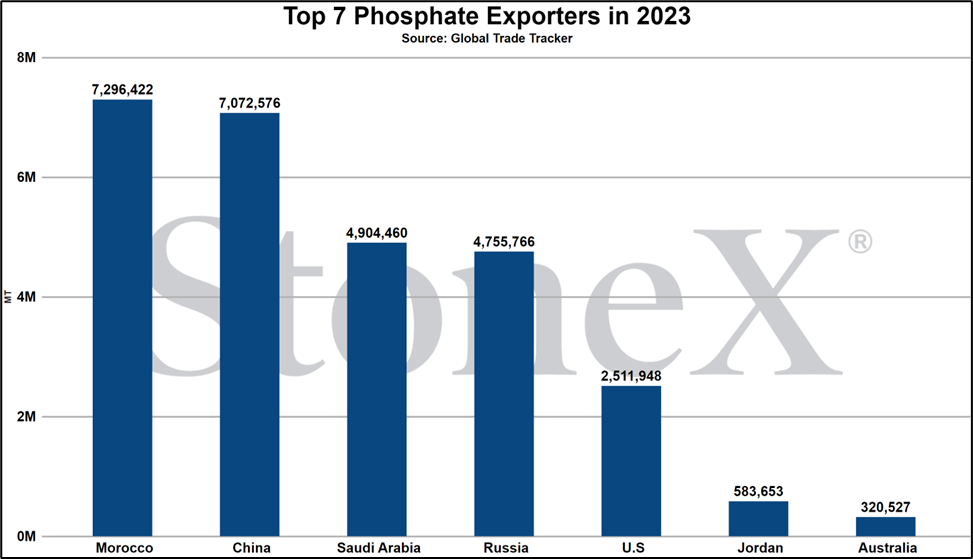
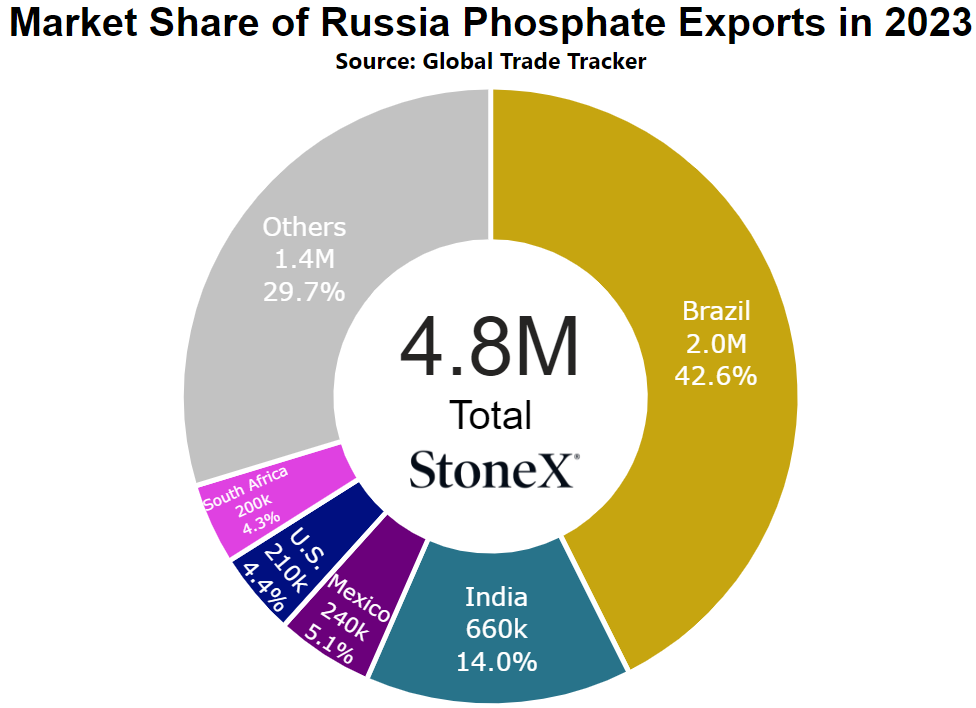
Historically, China is the world's largest DAP/MAP exporter with averages around 10M tons per year. That was considered normal as recently as 2021. Then, the 2021/22 cycle happened. Global tension started to come to a head which caused the market to start fearing major exporters like Russia due to their surprise invasion of Ukraine. Exports started to slow as certain nations started taking cautious approaches to sales either due to fear of exporting too much and leaving their own demand begging...or for higher prices. The lid was really lifted with grain values spiking.
During this time, the Chinese government started to become more involved in the fertilizer industry. Their strategy was to lower exports to help domestic farmers. By slowing exports, their own stockpiles grew creating adequate supplies for their own people as well as pushing price ideas lower. This has been especially felt in the urea market but phosphate also took its lumps. Fortunately for Chinese farmers, this strategy has worked. Unfortunately for world farmers, this strategy worked and continues to be used today.
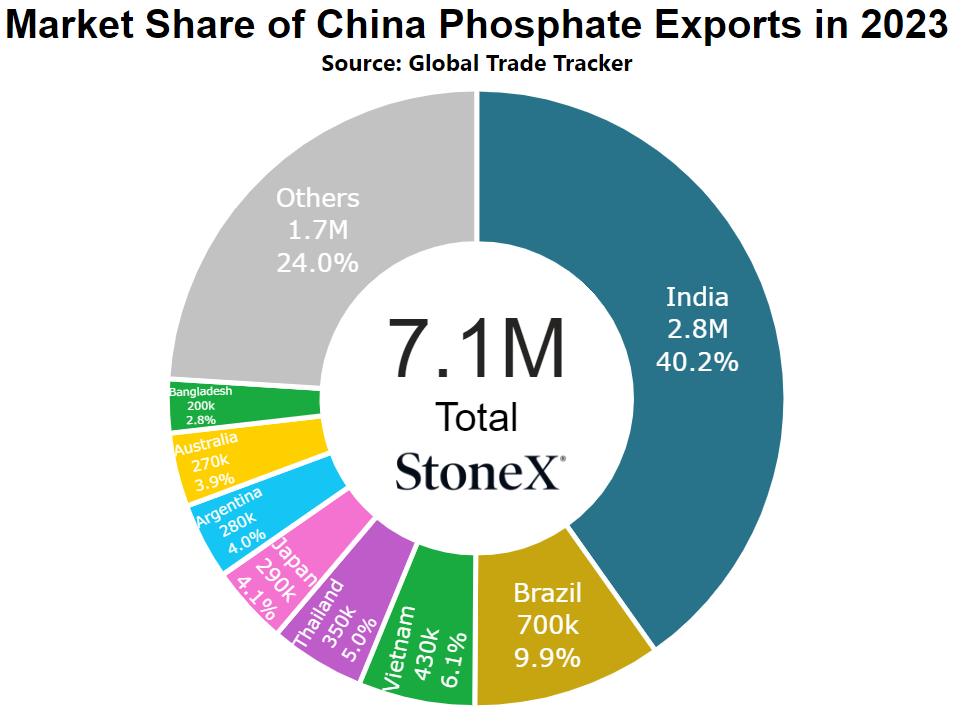
As you can see on the graph below, exports have not stopped but they are down substantially with the last 3-year average being close to 6M. While this may not seem a major event to some, when the world's largest exporter cuts back by 40%, it matters.
2024 did see a bit of a rebound with exports reaching 6.6M tons, but it is still far from normal and that leaves a gaping hole in the global S&D. This is a large reason why global and domestic values continue to stay elevated. As with most things China, we do not have great insight into their decision making. Even when you find something with an inside look, that connection is lost relatively quickly. For now, we are forced to take a reactive approach to the world's largest player. We can hope that their exports return to 10M tons per year and allow prices to go back to normal values...but hope is not a strategy.
What does this mean for farmers?
When the world's largest supplier cuts back on their export flows, global values react.
When the world's largest supplier starts getting feared that already scaled back export flows are going to restrict even more, global values react.
Hopefully this is just that, fear. This is China we are talking about. We do not know what they are going to do. Just as soon as we think we know, they turn a 180.
Ultimately, the world is still reactionary to their news and with their being the biggest part of the global phosphate market, that makes a hard situation worse.
India continues to struggle to maintain stockpiles, forced back to market
India has started 2025 in much the same way that it spent a decent part of 2024, behind on stockpiles.
Again, background:
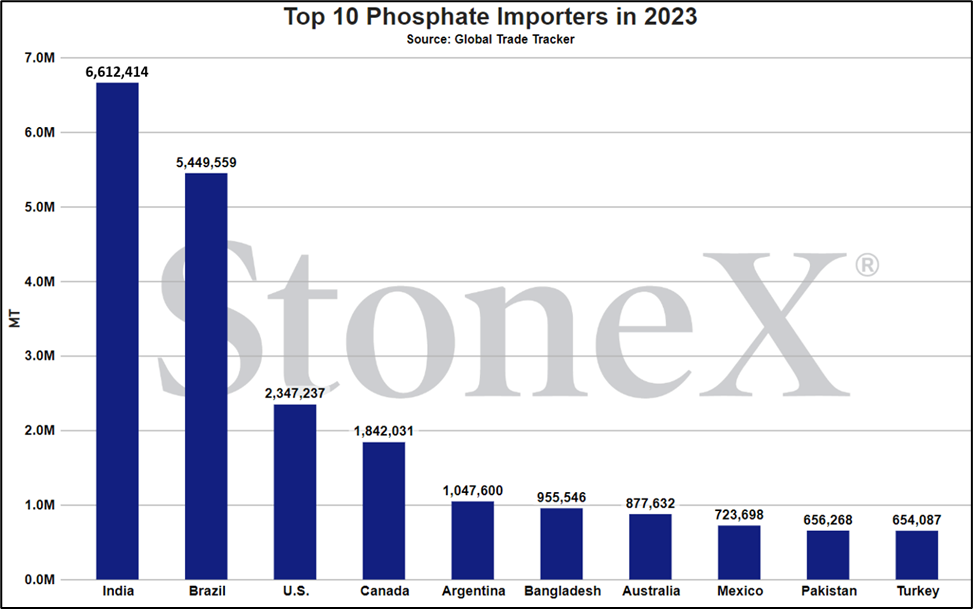
India is the world's largest phosphate buyer and is somewhat unique in their approach. Indian farmers are not subject to global price movements and the government largely regulates imports thru purchase tenders. Since the farmer price can be below the import price, the government sets subsidy rates that are intended to fill the difference so that importers can operate without massive losses.
This approach has worked for a very long time, but obviously recent year price liquidity has made that much more difficult. Later Q2 '24/early Q3 '24, global phosphate values were starting to fall with the anticipation of Chinese exports returning to normal. The Indian government, after a couple years of massive subsidy payments due to high global prices, tried to save a little money. The subsidy was cut below global values in hopes that it would pause demand, cause sellers to have to drop their price to sell, and they would be able to save. This approach worked...for a very short time.
Suddenly, China wasn't coming back. Export restrictions started to get more strict and global values reacted higher. Suddenly, the India strategy wasn't working and they were slow to respond. As a result, imports slowed drastically while domestic demand continued. By the time they started to get ahead of the situation, national stockpiles were nearing dangerously low levels. In the end, they did fix their subsidy and actually sent a contingency to Morocco to purchase a large block of tons to kickstart rebuilding efforts.
With global supplies still very tight, India has continued to stay ahead of this situation. Normally, at the start of the calendar year, 2M tons is considered a comfortable level. For 2025, estimates put their stockpiles at 1.2M tons. Yes, this is a large number of tons to most, but not for a market the size of India.
Because of this and their continued demand domestically, we foresee India as having to continue to play catch up thru Q1 '25. That means in addition to the story above where the global leading exporter continues to scale back supplies, the global leading importer needs to catch up.
That makes for a rough global S&D and plays the other reason global prices are so high.
What does this mean for farmers?
We are already worried that China, the world's largest historic exporter, may cut their flows further. Now, the data shows that the world's largest importer still needs to catch up on stockpiles.
This is a dangerous situation for the world. If both stories did play out, it would be hugely impactful to the global S&D. Values are already too high...but do not think for a moment that they cannot go higher.
Price comparisons
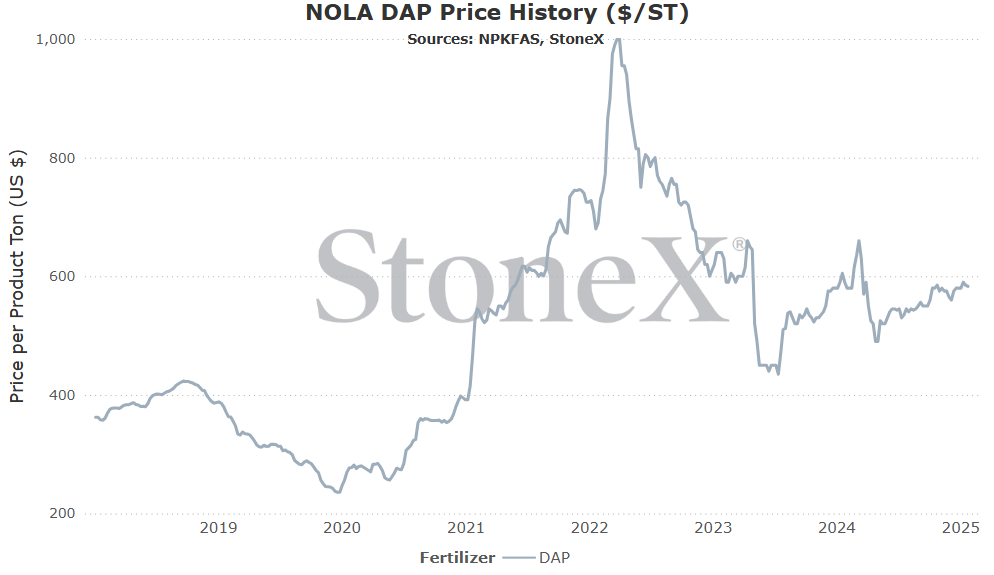
Vs 30 days ago - 1% or approximately $3 higher
Vs 90 days ago - 1% or approximately $3 higher
Vs 6 months ago - 9% or approximately $48 higher
Vs 1 year ago - -1% or approximately $7 lower
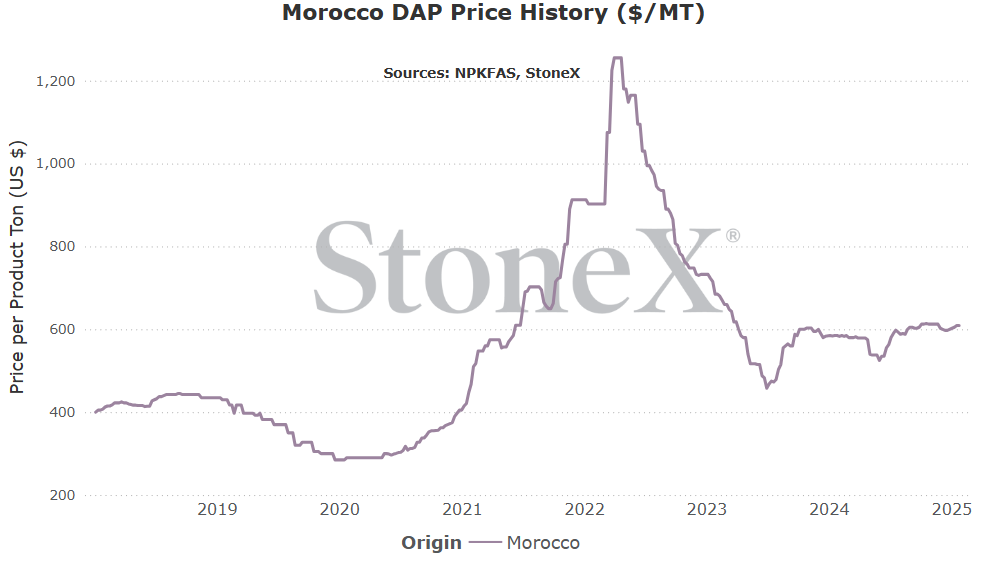
Morocco DAP price comparison
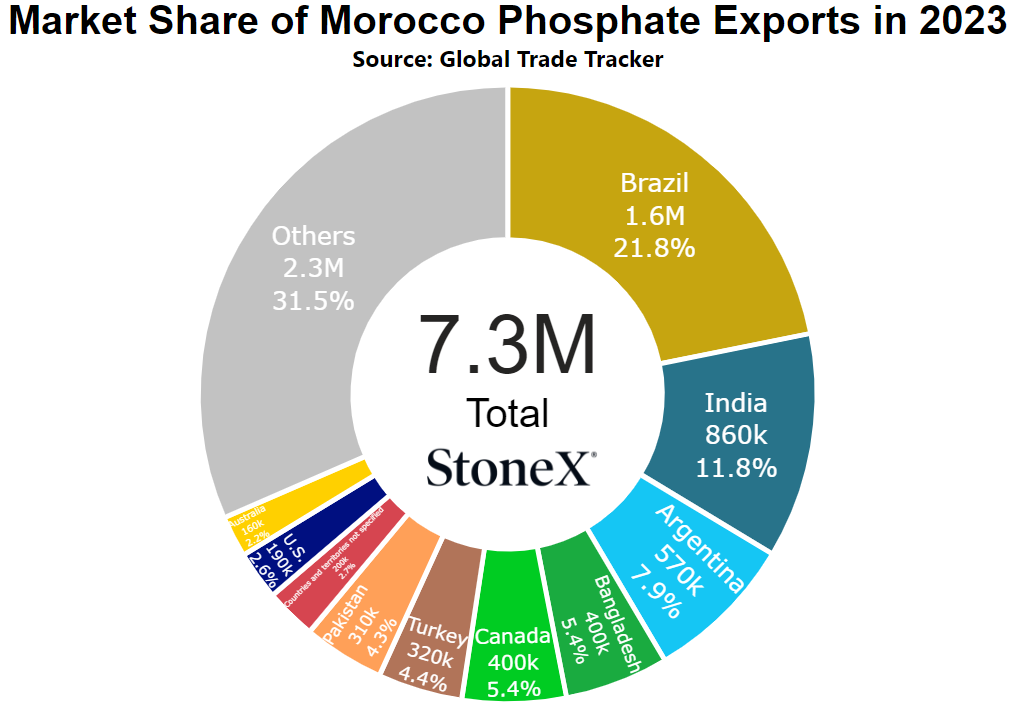
Number 1 global exporter in 2022
Price comparisons:
Vs 30 days ago - 2% or approximately $12 higher
Vs 90 days ago - -1% or approximately $5 lower
Vs 6 months ago - 2% or approximately $12 higher
Vs 1 year ago - 4% or approximately $24 higher
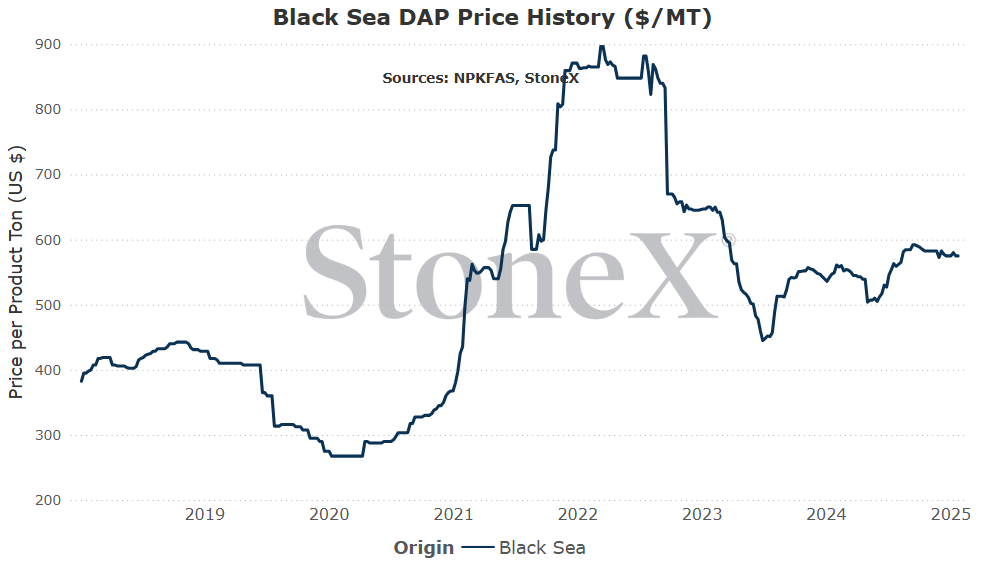
Black Sea DAP price comparison
Number 3 exporter of DAP/MAP in 2022
Price comparisons
Vs 30 days ago - unchanged vs last month
Vs 90 days ago - -1% or approximately $8 lower
Vs 6 months ago - 2% or approximately $13 higher
Vs 1 year ago - 5% or approximately $27 higher
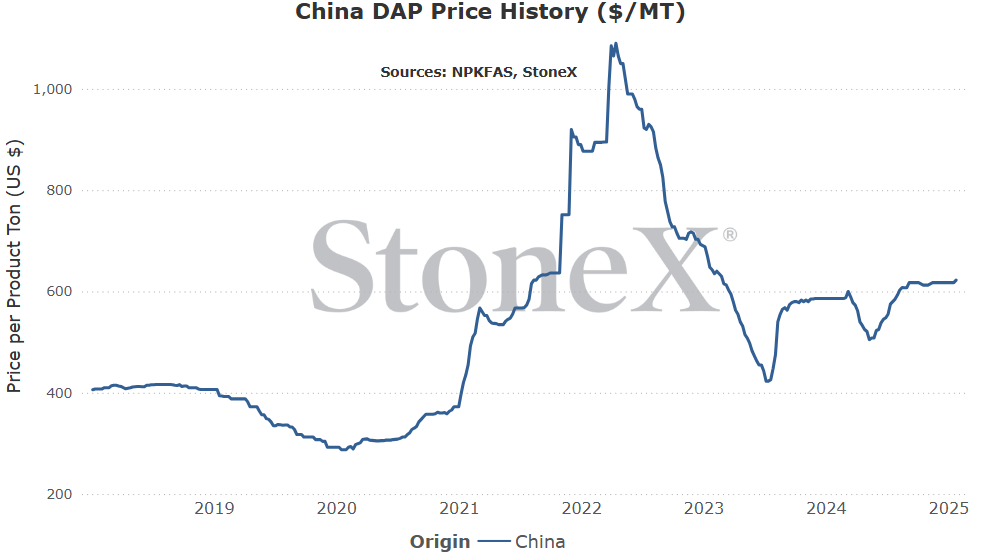
China DAP price comparison
Number 2 global exporter in 2022
Price comparisons
Vs 30 days ago - 1% or approximately $5 higher
Vs 90 days ago - 2% or approximately $10 higher
Vs 6 months ago - 7% or approximately $43 higher
Vs 1 year ago - 6% or approximately $37 higher
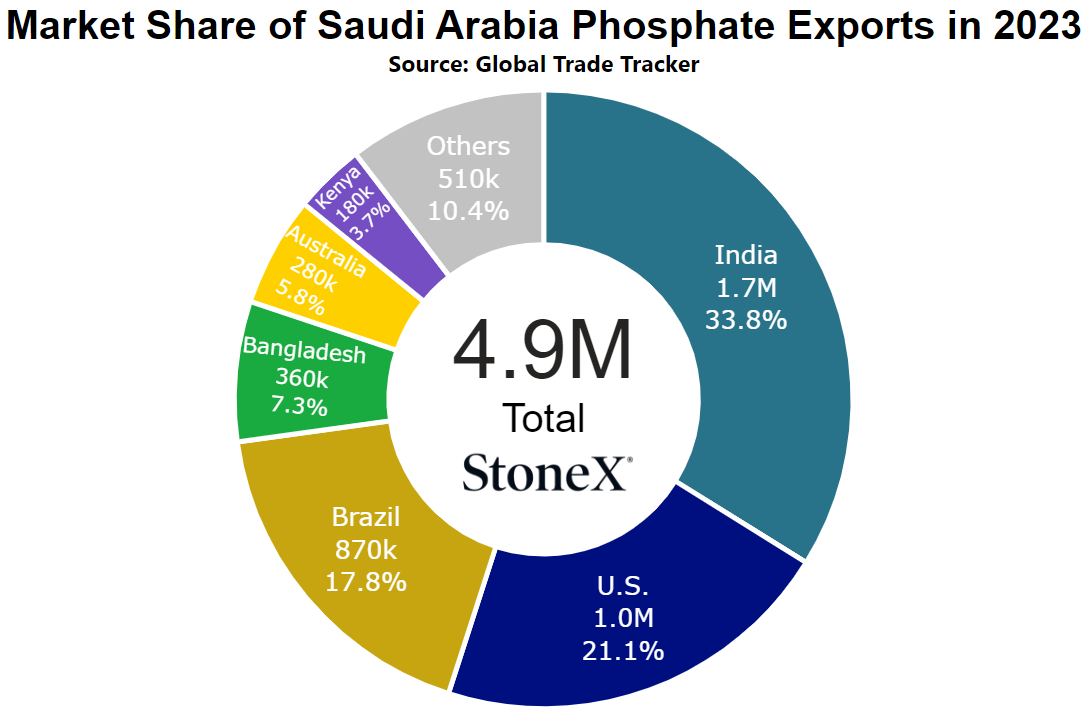
Saudi Arabia DAP price comparison
Number 4 global exporter in 2022
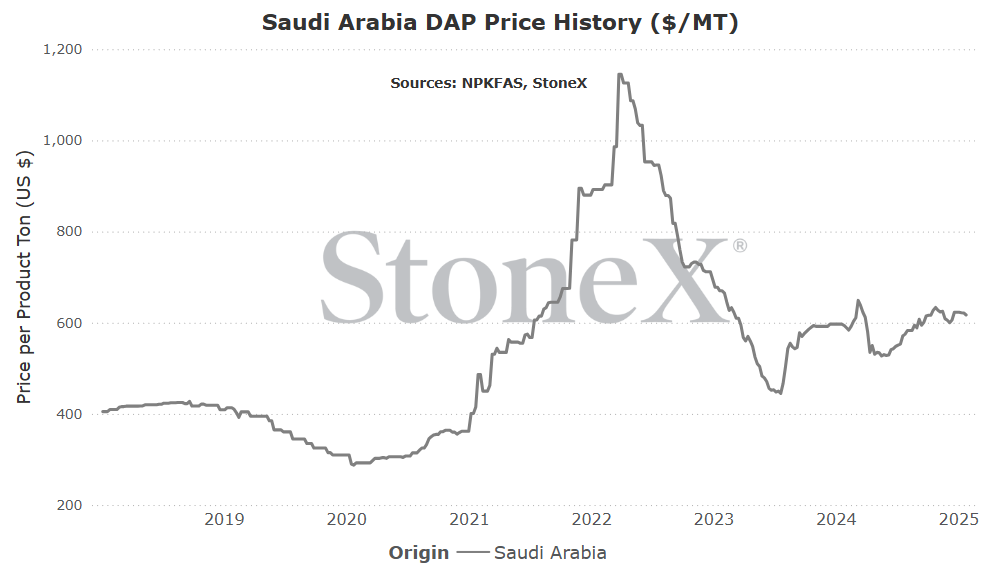
Price comparisons
Vs 30 days ago - -1% or approximately $6 lower
Vs 90 days ago - -2% or approximately $11 lower
Vs 6 months ago - 8% or approximately $46 higher
Vs 1 year ago - 4% or approximately $24 higher
- Chinese exports remain low/go lower – China has historically exported around 10M tons of DAP/MAP per year. That is how many tons they exported back in 2021...however, the world has grown accustomed to their lower levels. 2024 finished with only 6.6M tons. Now, that "feels" decent vs where they have been but is still well short of normal. That is 3+M tons missing from the global S&D which is bad. If the Chinese government starts to restrict exports on phosphate more (similar to urea), then bad goes to worse very quickly.
- Global demand delayed due to high price, hammers the market – farmers around the world are unhappy with phosphate values. They are high. There is no other way to look at it. High prices cause buyers to delay purchases in hopes that something changes...but eventually the calendar forces its hand and the northern hemisphere is getting there quick. Farmers are running out of time and demand is still seen as big. When the wall breaks, there could be a flood of demand that hammers the phosphate market and drives prices higher still.
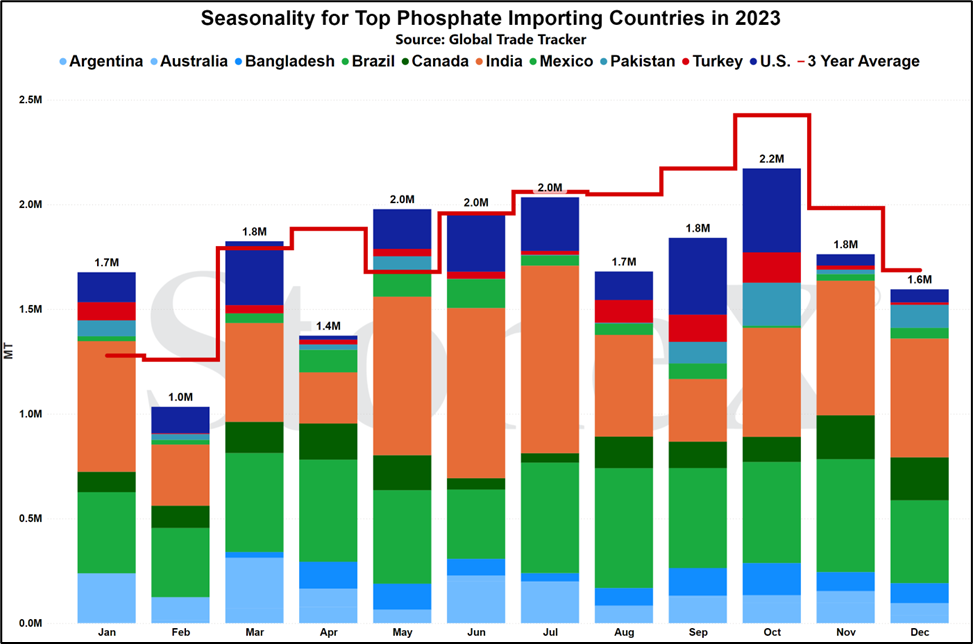
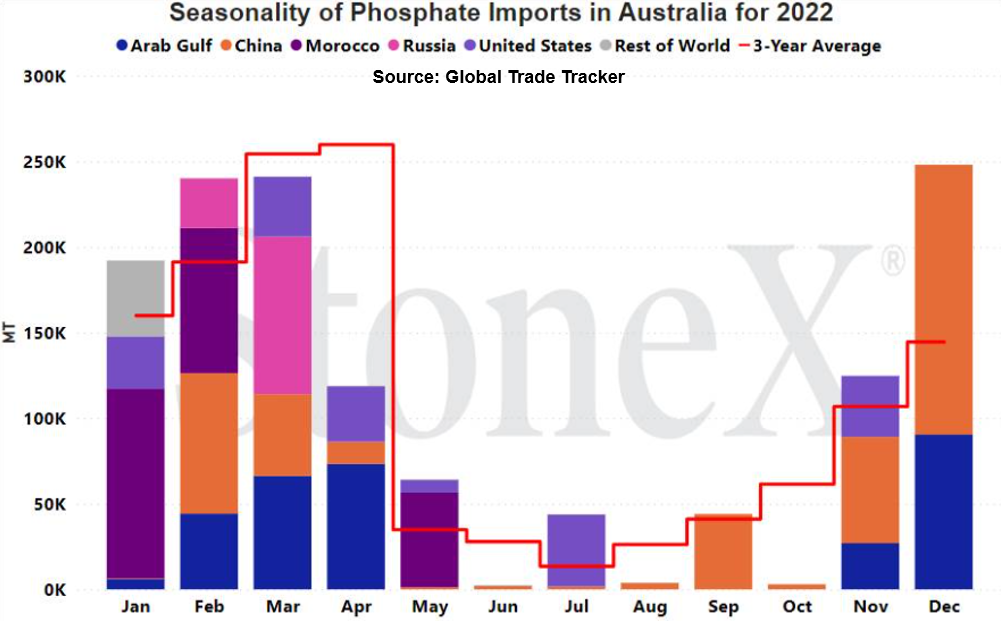
- Australian S&D could get tighter – importers are in a tough position. Global values are very high, which means there is a lot of price risk for every vessel purchased. Typically, high prices tend to have importers scaling back on purchases. Better to buy less and ensure profitability than to buy more and risk not selling it. If enough importers take this approach, supplies could be very tight to start application season.
- Later March/April forces market to consider carryover to summer – eventually, at some point on the calendar (very late March/April/May), the supply market will stop looking at a tight spring S&D and will start looking at possible summer price resets. While it is doubtful this would happen soon enough to drop retail prices to farmers, it is something to consider.
- Adequate imports acquired push back on global price increases – if global phosphate prices start to rise, Aussie values could look cheap in comparison. With a lot of imports likely already acquired, those companies will be more worried about making sure they get those tons sold than trying to capture higher values.
- Any fear of lower demand – phosphate demand in Australia is pretty typical year to year. It doesn't change that much. Importers are able to fairly accurately predict what they will sell which means securing those tons in advance. However, if application season begins and demand is poor, you could see desperation in the market as suppliers try to get rid of their high priced product. This seems a bit of a stretch factor but still something to consider.
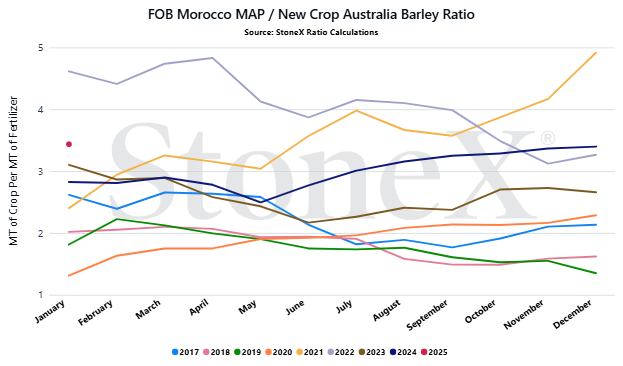
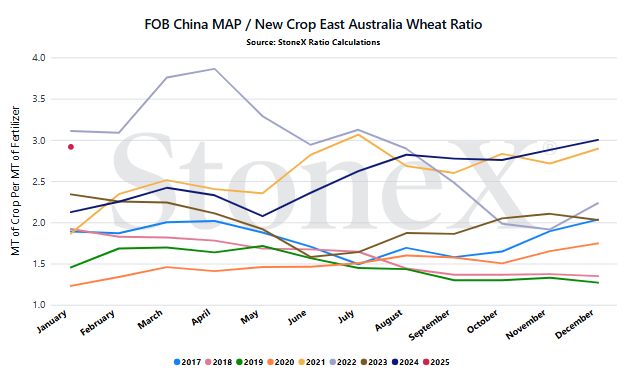
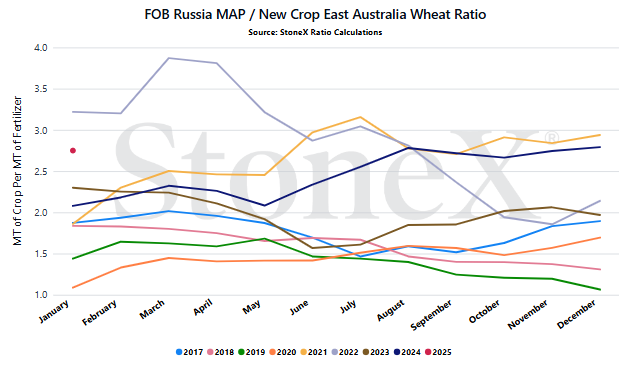
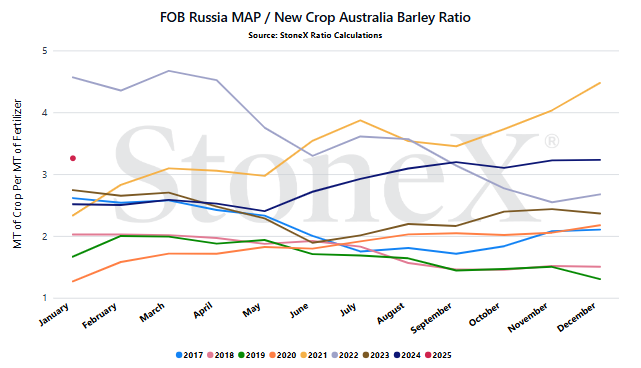
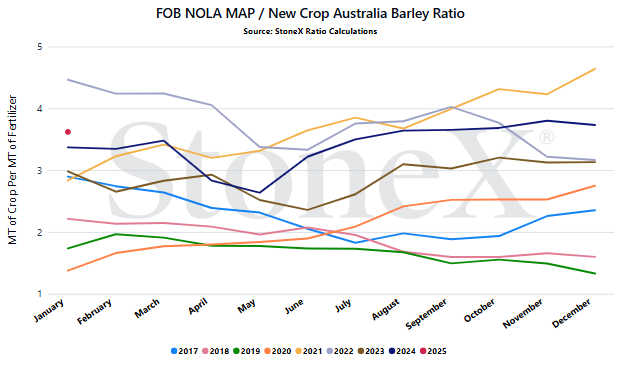
We believe that only looking at the flat price of either grains or fertilizer can be misleading:
-
Only selling grain can hurt you if fertilizer prices rise substantially
-
Only buying fertilizer can hurt you if grain prices fall
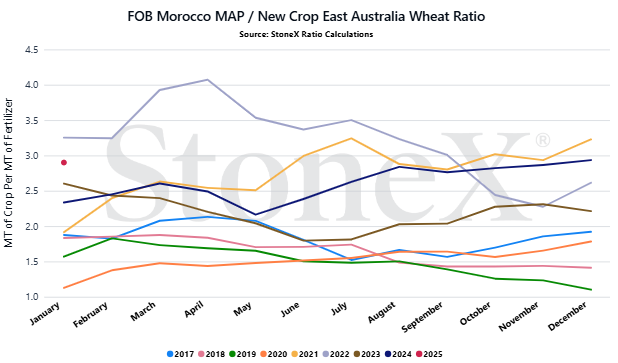
We look at the ratio "value" to get a better indication of where we are or how many bushels of X does it take to pay for 1 ton of fertilizer.
Would you rather:
-
Spend 4 ton of grain to pay for 1 ton of MAP
-
Spend 1.5 ton of grain to pay for 1 ton of MAP
When we compare the current ratio value against recent years, we start to see if we are high or low.
YOUR VALUES MAY LOOK DIFFERENT
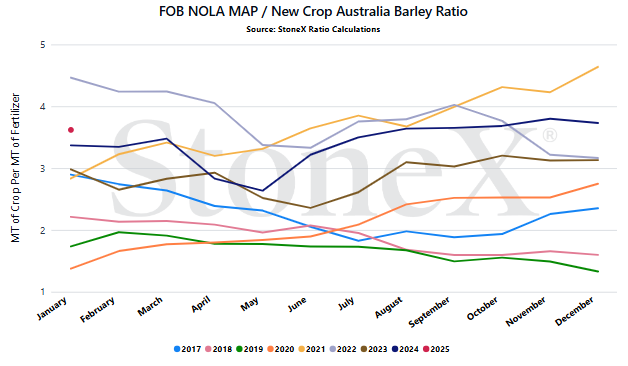
- Chinese exports in 2025 - one of the most popular phosphate talking points of 2024 continues to carry over into 2025. So far, there is still very little expectation that China will return to their former phosphate export glory. In fact, there are still some fearing that further restrictions will be put into place. When you look at Chinese domestic urea values vs global urea values, that strict export approach has worked. Why not implement it on phosphate? What they do or do not do has global ramifications.
- India buying patterns - India is the world's largest DAP and MAP buyer which means what they do or do not do matters. The problem is that their government has been all over the place with their import strategy. They are either too slow to respond to global price movements or overcorrect and miss opportunities. To start 2025, several have estimated that their phosphate stockpiles are close to 1M tons vs a normal and comfortable starting 2M ton level. Their buying patterns have been odd, but the global manufacturers have been using it to their benefit. Possible India gets it figured out, but the last 6+ months would say otherwise.
StoneX Ratio Calculation
The ratio calculation is derived from Bloomberg historical grains values as well as fertilizer values from StoneX, NPKFAS, and Argus.
The calculation is simply dividing the fertilizer price by each grain price.
All data was sourced from StoneX unless otherwise noted.




