

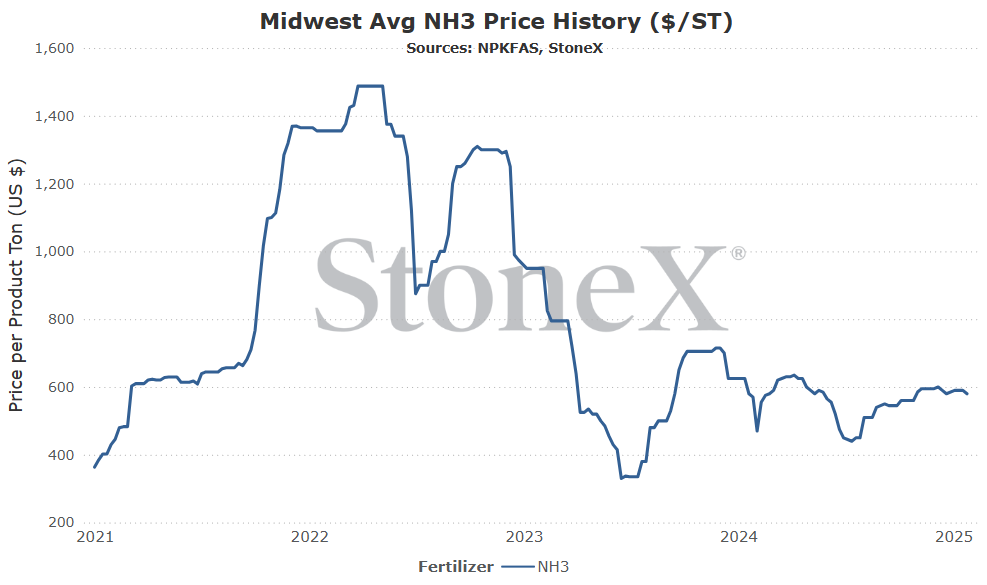
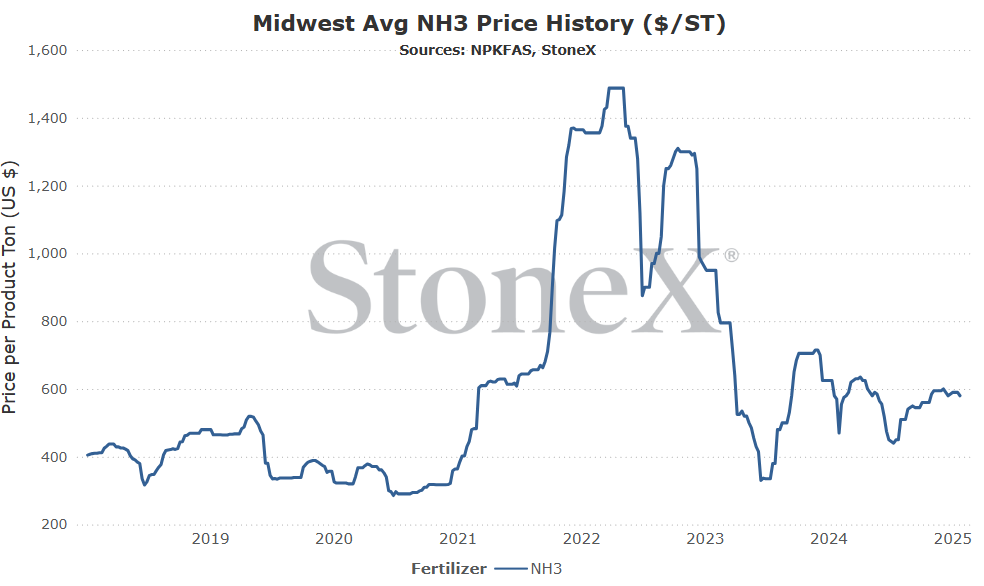
The first graph is the AVERAGE of the entire Midwest U.S. region. That means your local value WILL be different than what the graph reflects. Please do not take this into your retailer and say "why isn't my price the same as here". That is comparing apples to oranges. You might be on the cheaper or more expensive side of this graph. This doesn't take into account logistics/storage/interest/insurance/shrink/etc.
This graph looks at the price from a short ton and USD currency POV.
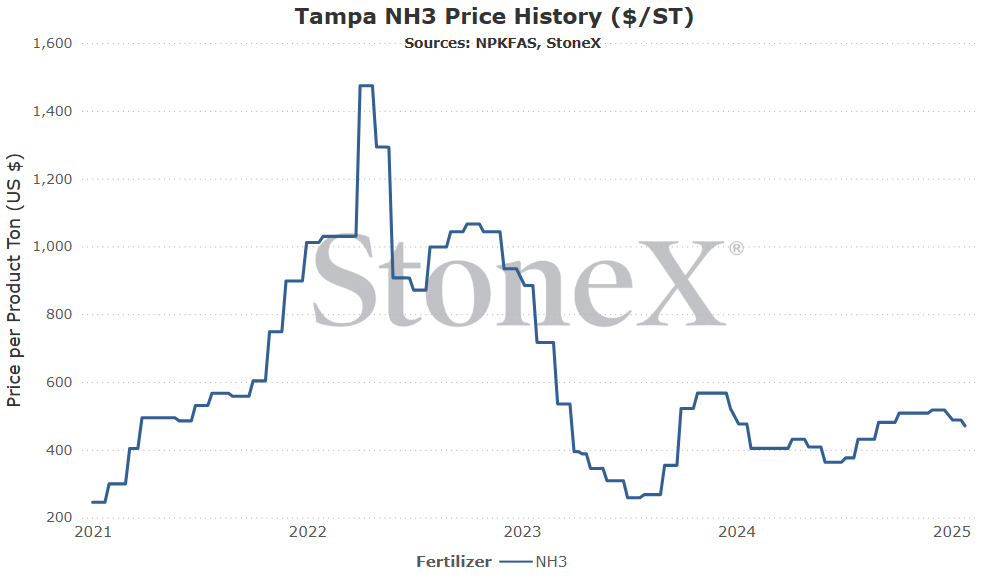
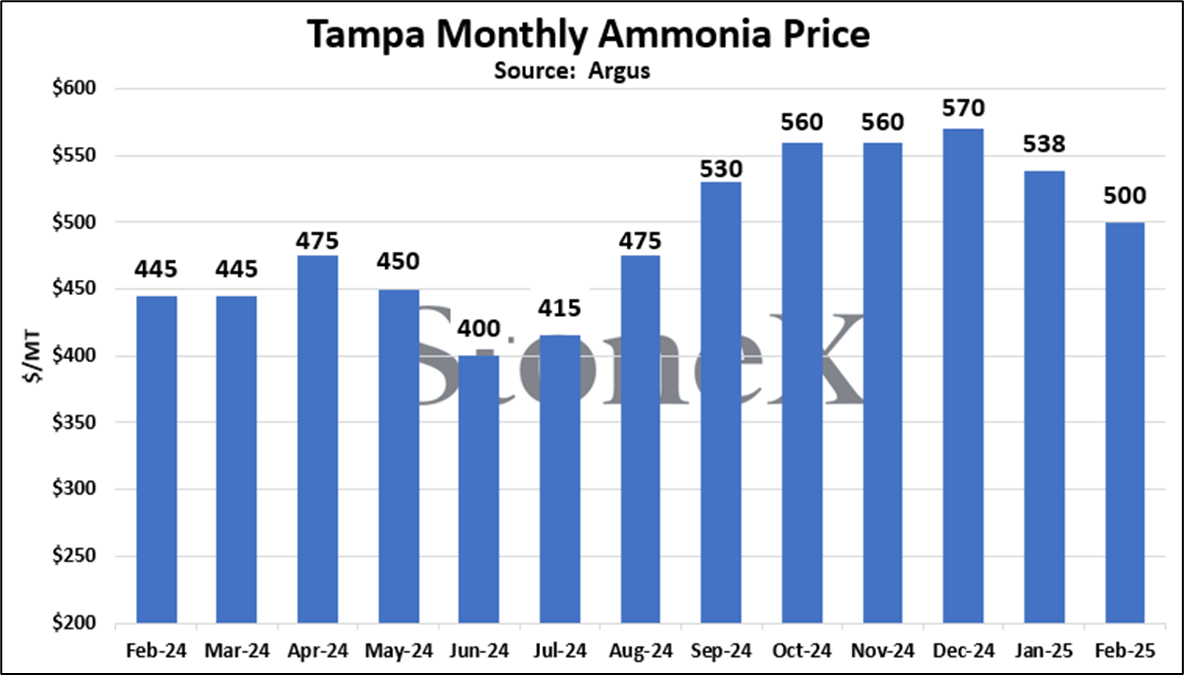
This second graph looks at the price set for Tampa NH3. This value does not have a high correlation to Midwest values. It is a talking point used when prices are rallying...yet somehow gets skipped on the way down. This price is more an indication of the global price. This price is set by two parties (purchaser - phosphate producer in Florida / seller - international producer providing NH3 to FL phosphate production).
This graph CAN be used as an indication of global market price direction/trends. This graph SHOULD NOT be used to determine a Midwest value. Tonnage is listed in short ton and currency in USD.
In the last month, we have seen price strength from urea and UAN, haven't seen any indications of demand falling off, no indications of Russia's export return, yet prices are lower.
I should be happy!
I suppose the lack of any new news has caused the market to get stale and when fertilizer markets get stale, they tend to slide. Now again, the lower prices are not hugely so but they are trending lower.
Now, we do need to continue to watch Russia. They are still my biggest game changer. If/when they return, it should turn the market on its head, but until then, things are steady and quiet.
Unless something new changes the scope of the NH3 market, prices are likely to remain flat and more likely lower in the coming months.
North America
Unfortunately for buyers, I do not think inland N.A. NH3 values are going to follow their global counterparts.
The inland market has been seeing its S&D get worse, not better, in the last month.
One we already knew was the decent fall run. While far from a record and nowhere near normal on the calendar, it was successful enough to help clear most inventories. That means that manufacturers had plenty of their own space to refill before spring starts in March. That gives them an advantage.
Then, we have been seeing N demand grow. Corn acres continue to pop higher as corn acres improve. We started 2025 thinking it would be 92M. Just before my family and I went to Orlando, we improved it to 92.5M and felt good. I wasn't gone a week and it jumped to mid-93M acre range. Now, with bean fears of a massive S.A. crop tearing up pricing and seed companies indicating solid corn seed sales at the expense of beans, some are indicating as high as 95 to 96M acres.
All of this and nothing has changed for inland storage or logistics. Add to it strength in the urea and UAN markets.
All of these things together continue to press a bullish outlook for inland NH3 markets for preplant. It is VERY hard to see values falling before we start planting.
February Tampa price falls further $38 on quiet global markets
For the 2nd month in a row, the Tampa NH3 fell. It dropped a further $38 month over month and has dropped $70 since December.
Some have been scratching their heads on the reason why. To start, it isn't as though this has dropped it to ultra low values. It is just getting more in line with "normal" for the last year or two. Second, it has been quiet and fertilizer struggles with quiet. With no new supply shortages, spikes in demand, production hiccups, etc. for the market to fret over, prices tend to slide. Last, Trinidad production has been going well (reduces reliance on U.S. tonnage to backfill) and hopes are rising that Russian exports will resume in some capacity sometime Q1 '25. Now, that is a story that we have been repeating for a long time. The only update is to change the expectation month one further ahead! However, hopes are rising there.
For anyone looking at this price increase that applies NH3 in the spring, do not let it get your hopes up too much as this isn't an indicator that inland prices will drop. As always, Tampa is a price point that is determined by two parties: Mosaic and Yara. This price gets discussed when it is rising and Midwest prices are rising. When Tampa starts to fall, typically it starts being ignored on the sales side. It just doesn't have the impact some believe.
Still, it does give hope that someday better prices will come.
What does this mean for farmers?
Honestly, not much today.
With spring right around the corner, Tampa values falling likely isn't going to affect inland values. Certainly not with corn acres, and as a result nitrogen demand, rising.
Maybe it helps lower summer fill price ideas but that is so far away from today that it isn't anything to get excited about.
It means so little to farmers that I contemplated not even including it but I think it is important to have an understanding of the world.
Inland N.A. NH3 values seeing support with higher nitrogen markets/corn demand
To have an idea of where we are for spring NH3 application, we have to have an idea for what the fall was.
We went into the start of fall application season with high expectations. Prices were somewhat attractive vs grain values. Harvest went well and finished on-time to early. The biggest issues was widespread drought conditions that made the dirt hard and unable to be worked. By the last week of October, that made way to extremely wet conditions that kept farmers out of the fields for the exact opposite reason. Fortunately, a window opened Thanksgiving week thru Christmas.
The end result was that we fell short of our forecast (around 90%). With our forecast having been higher, that meant we settled into a very normal fall run. Not too much, not too little. That set the stage for a rather manageable spring run.
Then corn acre expectations started to rise...
We started 2025 with our corn forecast at 92M acres. We had been there for a few months. Just before my family and I departed for our vacation in Orlando, the market started to shift slightly so we revised our number slightly higher to 92.5M acres. Nothing substantial but a sign of the times.
I wasn't in Orlando a week.
When I came back, we had moved to 93.5M acres...and we were on the lower end of some estimates. There are folks who are pointing to seed sales and the current corn/bean ratio as justification for upwards of 95 - 96M acres. We are not there yet as we like to take a bit more conservative approach to spring. It is easier to build into it than it is to back away as we start. Still, those ranges give you some sense of market talk.
The issue is that every additional acre of corn is additional nitrogen demand and first up to the plate is NH3.
This does not mean there will be shortages. It merely means that nitrogen demand is growing just before the start of spring. Having it jump now means there is little to no time for the market to pivot and acquire additional supplies that are not already in the pipe. What is in place, en route, or already planned is what there is. In effect, it means that the market is even more on edge and could result in prices jumping even further.
What does this mean for farmers?
This means the chance that NH3 prices will continue to go higher has increased.
There are no guarantee's. Manufacturers/suppliers will be a bit more cautious because NH3 is so dependent on weather playing nice. NH3 could be free but it doesn't matter if the ground is frozen or wet. However, urea/UAN prices increasing will impact NH3 quicker. Demand stepping forward will impact NH3 quicker.
Basically, it makes a bad situation worse.
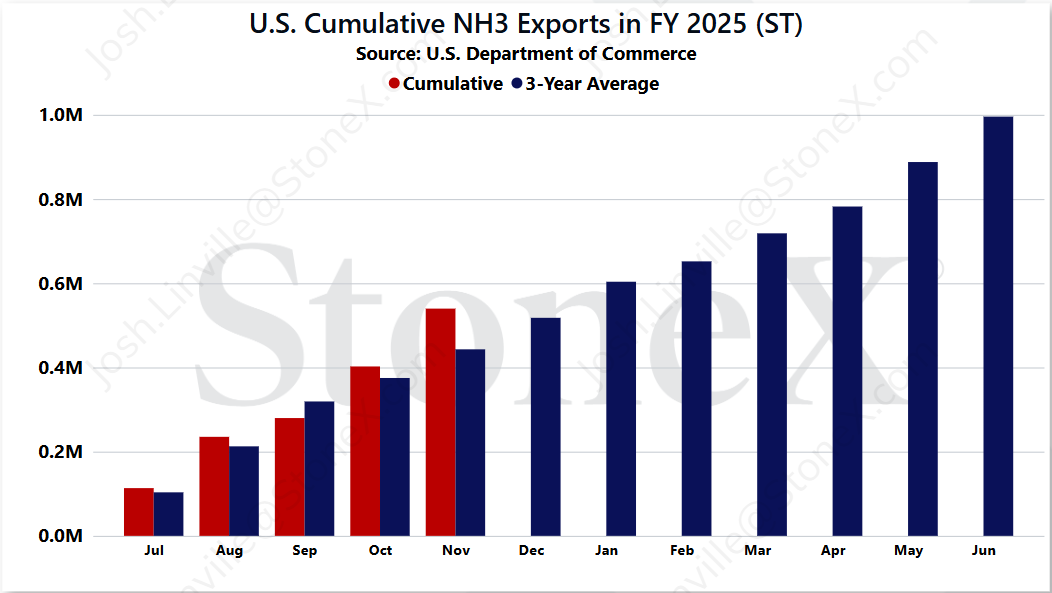
U.S. continues to export huge amounts of NH3
While this is unfortunate for the N.A. NH3 S&D, it is reality and needs to be known.
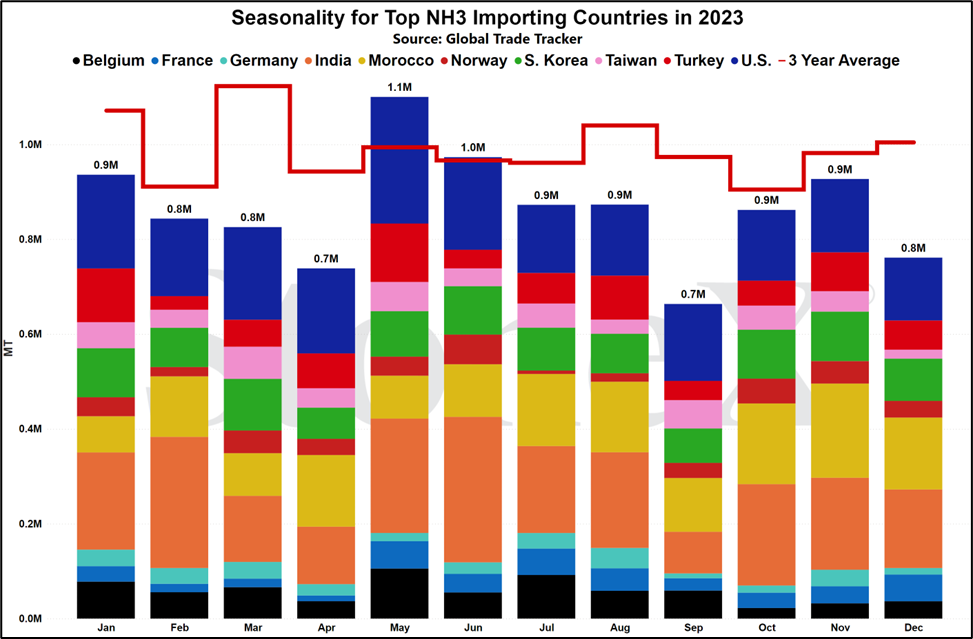
It is not uncommon for U.S. produced NH3 to be produced. However, these flows have significantly increased since the Europe/Russia spat began which caused Russian gas supplies to stop and force values there significantly higher which shut off nitrogen production. Several manufacturers shifted away from producing their own NH3 to upgrade to other products and opted to buy in cheaper product from the world. U.S. manufacturers, along with other global producers, stepped in to fill that void. This has become "normal" for the S&D and short term outlook.
So why are the July thru November exports so much more?
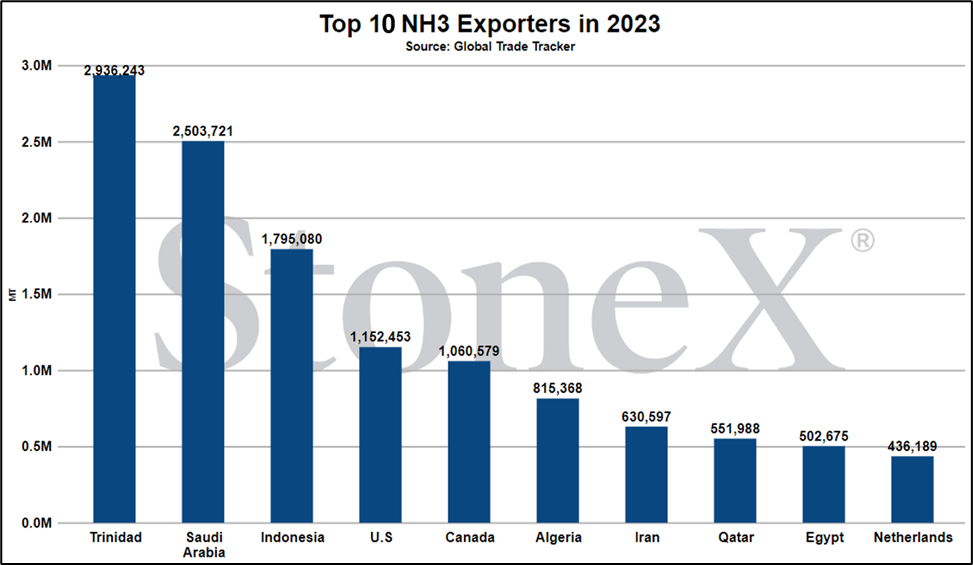
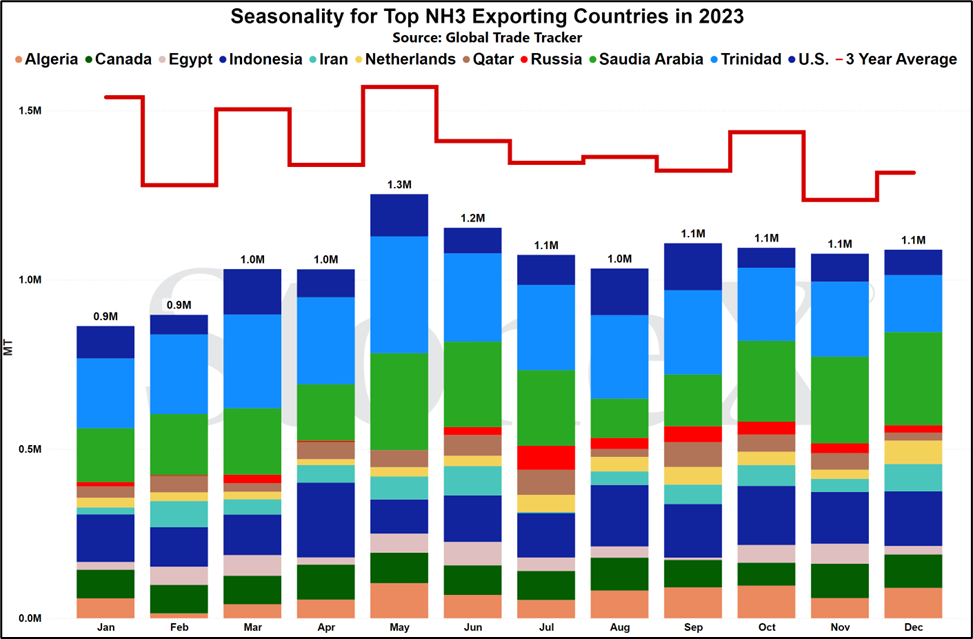
It falls to Trinidad who is a major exporter. In fact, with Russian product still not reaching the world market, Trinidad took over the top supplier spot. That means when they have production hiccups, the world has to shift and Trinidad had exactly that. They are a major gas producer which is why we see so much nitrogen fertilizer produced there. Better to produce it at the source of your biggest input. However, their demand has grown faster than their supplies and they end up with shortages that impacts production capabilities.
Fortunately, Trinidad has approved the exploration and development of previously untouched territorial waters. It is far enough along that partnerships have been penned and work is being done. Unfortunately, it takes time for the first flows to start.
When Trinidad production slows/stops, demand doesn't slow/stop. Those buyers were forced to shift to other areas which is where U.S. gulf production steps in. They were more than willing to step forward to make sales. That is their role, to make sales. Whether it is a sale to the domestic market or the international market, it doesn't matter. Best netback/option wins.
Production has resumed and we believe the coming trade data will reflect exports slowing but for this fertilizer year, those tons are lost. With N.A. production running as hard as possible, it will be very difficult to make up the difference until next year.
What does this mean for farmers?
High exports removes more nitrogen fertilizer from our supply models. It doesn't guarantee higher prices but it certainly make the market much more susceptible to price increases.
Fortunately, inland markets operate on a slightly different market so this isn't a dollar for dollar or ton for ton impact.
Canada/U.S. tariff war will impact U.S. NH3 markets
A big discussion point recently has been President Trump's threats of tariffs against Canada.
To start, there is a lot of conversation of whether these tariffs will see the light of day. In fact, as I was about to start writing this, Reuters published a story discussing sources talking a delay until March 1. Here is the article link:
https://www.reuters.com/world/trump-set-impose-tariffs-mexico-canada-st…
Other sources continue to say that the tariff will start February 1.
I am not a politician and contrary to popular belief, I do not talk to the President on a daily basis!!!!
All said, we need to be aware of what this means for markets IF it happens.
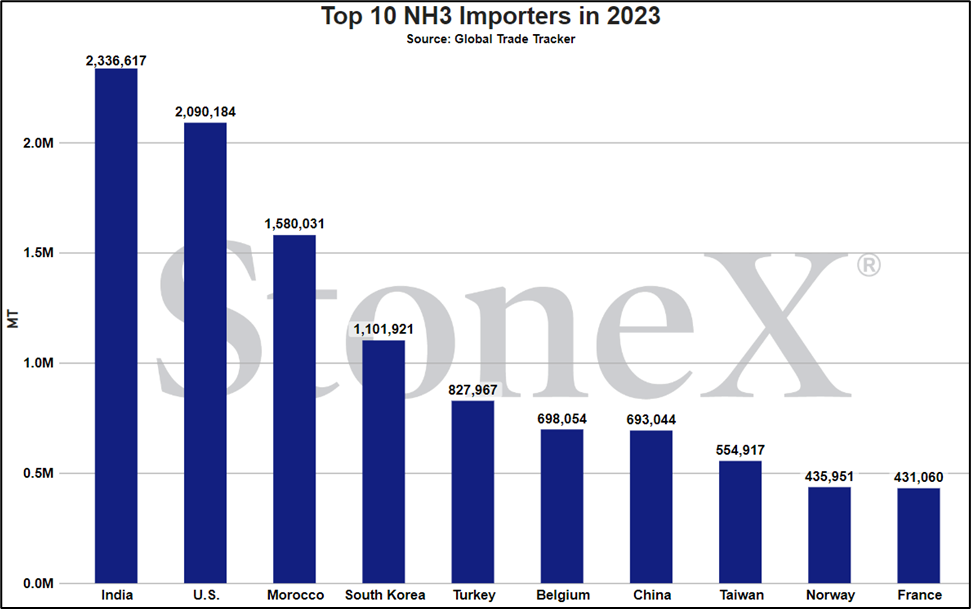
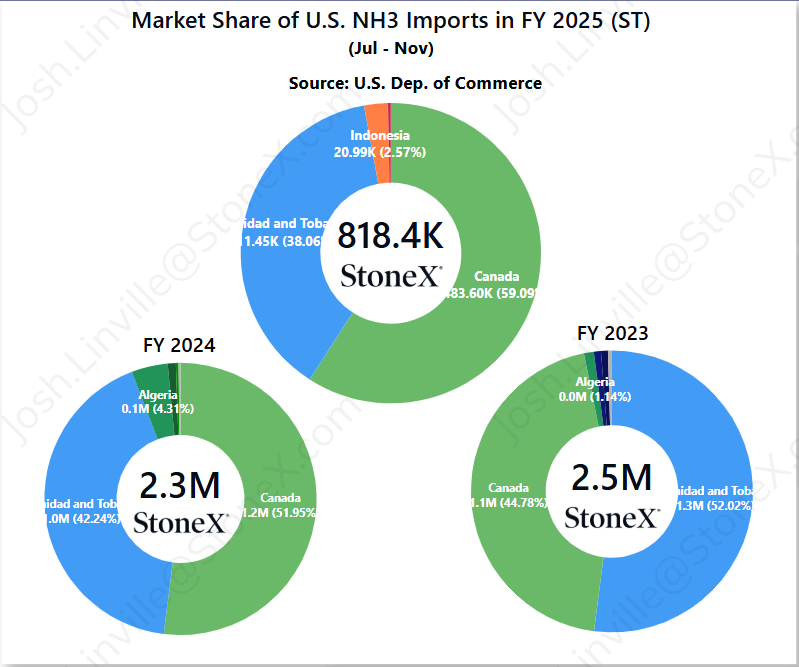
For NH3, the U.S. is reliant on Canadian produced NH3. As the pie chart below shows, approximately 52% of the 2.3M tons imported into the U.S. for fertilizer year 2024 came from Canada.
Now, some politicians would tell you that if the U.S. imposes tariffs, then the Canadians will pay it. They are right...to a point. Yes, Canadian manufacturers/exporters will pay the tariff, but they will also get that price back on the sale and that is what we are already seeing with new contracts. This is especially true in potash where contracts are now stating the price is X and any tariff imposed will also be paid by the buyer. Some may cry foul but it appears to be holding.
The biggest issue is the timing. There simply isn't enough time to pivot to other supply routes. If it was April 15th (end of most application), then the entire remaining spring/summer/fall stands ahead and that represents time to find product from somewhere else. That puts the pressure back on Canada. It isn't April 15th. It is February 1. There just isn't time to shift. That means the U.S. needs the product more than Canada needs the sales and the U.S. will bear the brundt.
Hopefully I will send this out and all tariff threats will go away. Nothing would make me happier.
How does this affect farmers?
For NH3 applicating farmers in Canada, this could be a blessing. If Canadian manufacturers see U.S. buyers push back tons, that suddenly helps to increase supplies which "should" help lower price ideas. Their pain is your gain.
For U.S. farmers, whether you rely on Canadian product or not, this should hurt and push prices higher. Either you are directly reliant on Canadian tons and your replacement cost will now start reflecting the tariff rate or you buy other tons. You might think those tons will not change but what do you think the northern buyers will do? They will try to buy from further away/southern/cheaper sources. That increases demand. That puts pressure on those southern points...and rallies price ideas.
Unfortunately for the U.S., at least as spring is involved, this will hurt us more than it hurts them.
U.S. Midwest Wholesale price average
Vs 30 days ago - unchanged vs last month
Vs 90 days ago - 4% or approximately $20 higher
Vs 6 months ago - 29% or approximately $130 higher
Vs 1 year ago - 2% or approximately $10 higher
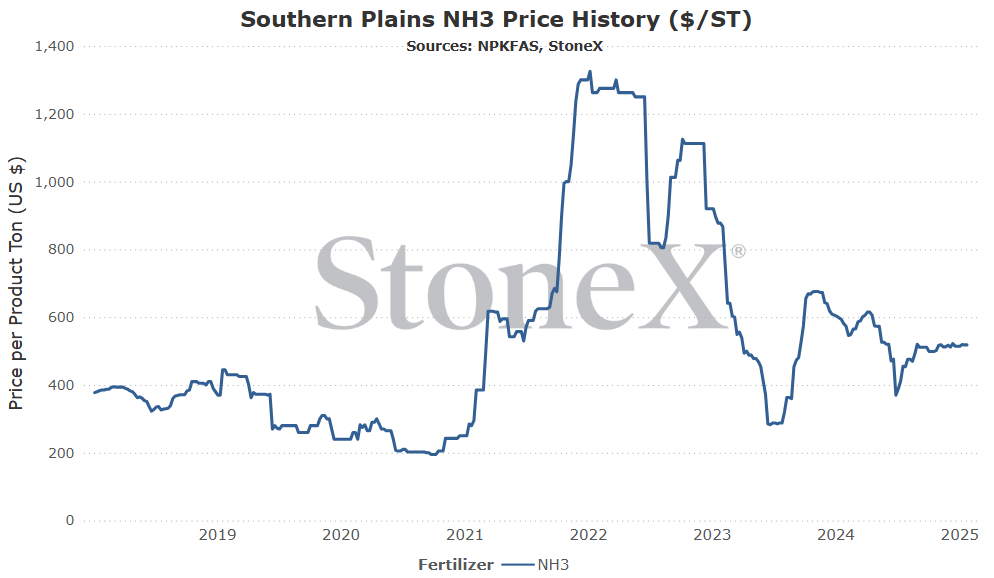
U.S. Southern Plains price average
Vs 30 days ago - 1% or approximately $4 higher
Vs 90 days ago - 4% or approximately $20 higher
Vs 6 months ago - 14% or approximately $63 higher
Vs 1 year ago - -11% or approximately $63 lower
- Russia continues to delay their export return - I am so sick of talking about when Russian NH3 exports are going to return. They still haven't...but we continue to see/hear that they are returning soon. Today, the story is they are back Q1 '25. If delays continue, it keeps the global NH3 marketplace much tighter supplied than it would otherwise be. That does not guarantee that prices always go higher. However, it does make any reaction to hiccups around the world much more severe.
- Trinidad has further gas supply tightness/production issues - with Russian exports still missing, Trinidad has been thrust higher on the list of important suppliers...and they have had production hiccups (which helped drive demand for supplies from the U.S. higher). Today, they seem to be doing well, but the risk of another gas supply shortage/production hiccup is always present. If that happens over the next month or two, it is hard to see the market not responding higher.
- N.A. corn acres continue to rise/wide open spring - we started 2025 with our U.S. corn acreage forecast at 92M. We moved it to 92.5M just before my family and I went to Orlando. When I returned a week later, we had moved to 93.5M acres. Now, we are hearing some that are saying 95 - 96M acres is a possibility based on corn/bean spreads, seed company feedback, etc. Every new acre of corn represents additional N demand. More demand is likely to move price ideas higher.
- Russia FINALLY returns to the export portal - if I say that Russia is going to return soon enough times, eventually I will be right. I mean, I haven't been in over a year, but eventually... If/when they return, that will signal a major bear factor to the world as it represents the largest global exporter returning. On day 1, it isn't a huge fundamental impact. It isn't like they will export 4M tons on day 1. However, emotionally speaking, folks will run for the hills.
- Global NH3 markets remain quiet - NH3 markets have been globally quiet, and fertilizer markets do not do well with quiet. Typically, we see price ideas slide when it gets like this as folks have time to sit around and justify dropping their price to get some action. Doesn't always happen, but it leans the market that way.
- N.A. weather delays/shortened spring season - N demand is growing with every additional corn acre forecasted...but that doesn't guarantee spring NH3 success. Mother nature makes that call. If it stays cold/wet into April, farmers may be forced to abandon NH3 application hopes to focus on planting. The sidedress NH3 area is not large, which means more demand flowing to urea and UAN to make the difference. That leaves a lot of additional NH3 supply looking for a home which typically weighs on price ideas.
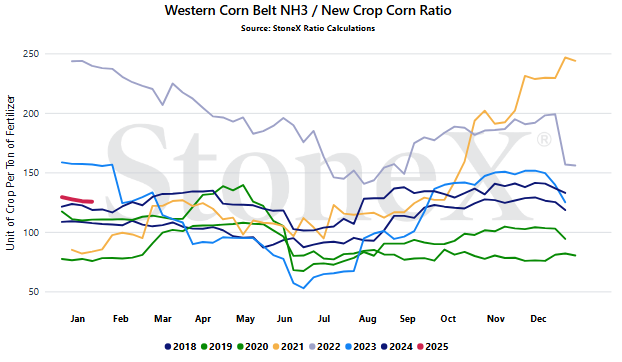
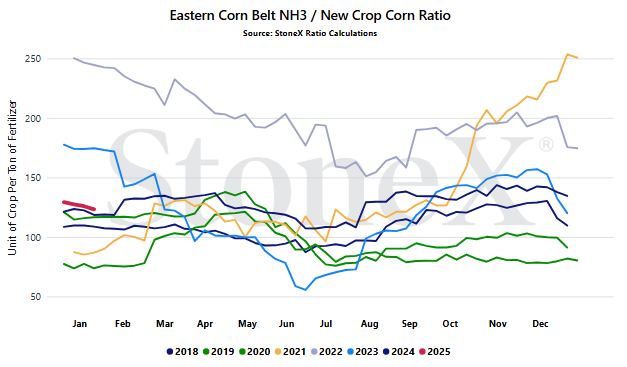
Where are the current NH3/grain ratio values today
We believe that only looking at the flat price of either grains or fertilizer can be misleading:
-
Only selling grain can hurt you if fertilizer prices rise substantially
-
Only buying fertilizer can hurt you if grain prices fall
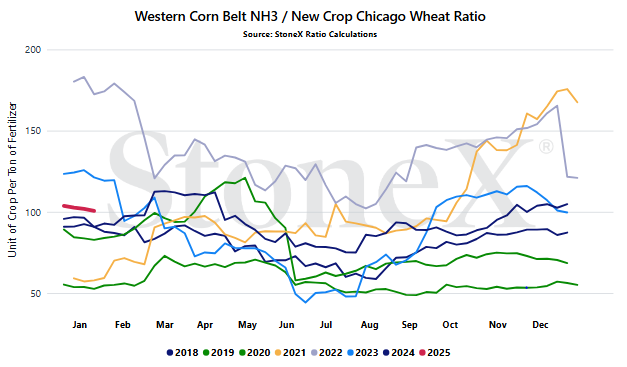
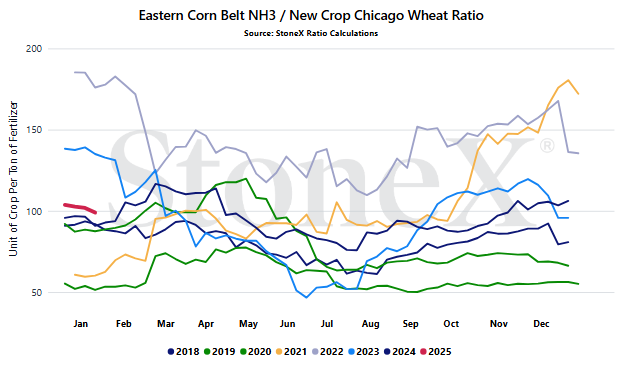
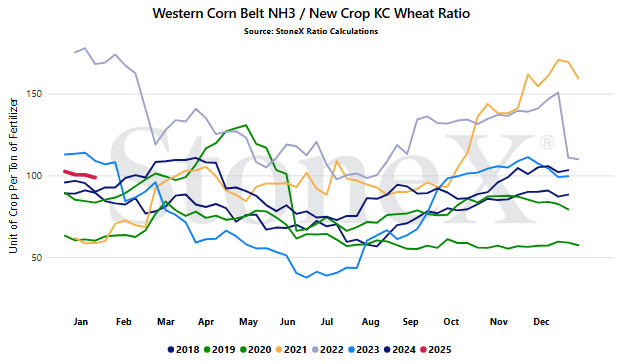
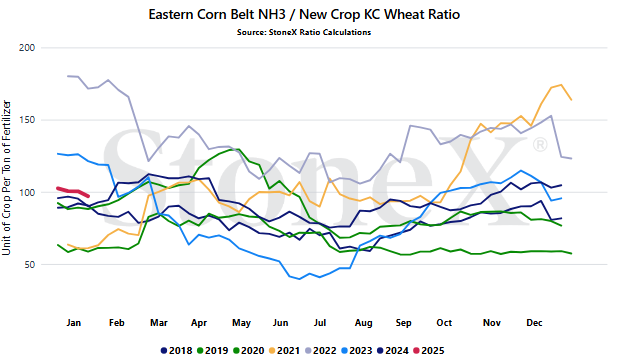
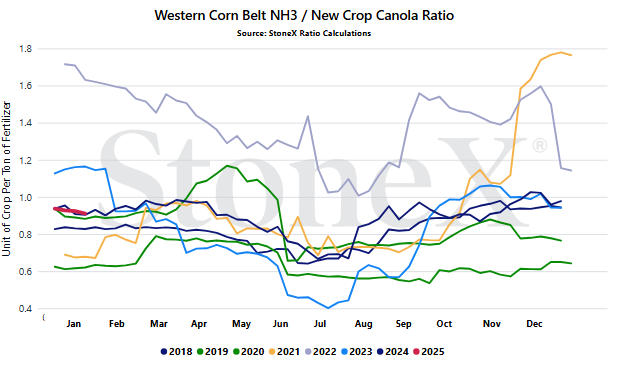
We look at the ratio "value" to get a better indication of where we are or how many bushels of X does it take to pay for 1 ton of fertilizer.
Would you rather:
-
Spend 150 bushels to pay for 1 ton of potash
-
Spend 100 bushels to pay for 1 ton of NH3
When we compare the current ratio value against recent years, we start to see if we are high or low.
YOUR VALUES MAY LOOK DIFFERENT
This graph looks at the NOLA NH3 price vs the flat grain price. There are no logistics on either product. Your location will look different due to fertilizer logistical costs, grain basis, etc.
- Russian exports - to our knowledge, Russia still hasn't returned to the NH3 export market. We continue to hear that the Teman facility is "almost done"...yet it never is. Eventually, one day, maybe, possibly it will be and if/when/maybe they do return, it will signal the return of the global NH3 gorilla. Until then, the world is still much tighter supplied than it would otherwise be.
- Rising N.A. demand in a short amount of time - if corn acres/N demand was rising prior to fall season, the market would be much more able to withstand everything happening. In that scenario, there are two application seasons ahead to make up the difference. However, that isn't the case. These numbers are rising with mere weeks before application begins. Now, there is no certainty that demand will be this big. We have seen this excitement before and saw the final number much lower. That is a big part of why we haven't seen prices move much...but keep tally in the next two months. As applications begin, the story will be told and if demand is up as much as theorized, watch out for prices.
StoneX Ratio Calculation
The ratio calculation is derived from Bloomberg historical grains values as well as fertilizer values from StoneX, NPKFAS, and Argus.
The calculation is simply dividing the fertilizer price by each grain price.
All data was sourced from StoneX unless otherwise noted.




