The planting intention figures for the US new crop were highly anticipated, as always, since they are the first estimates based on qualitative information collected from farmers.
What was not new was that the numbers surprised the market, as has happened on several other occasions. The results came in the expected direction for soybeans and corn, but the increase/decrease in acreage from the previous year was much more pronounced than expected.
Soybean
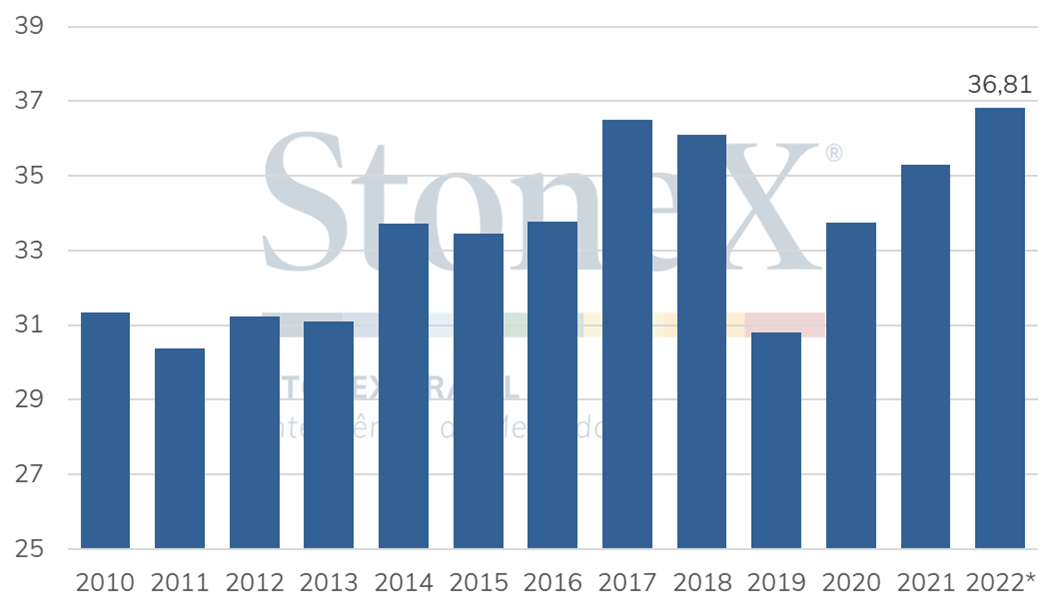
The expected planted area for the US 2022/23 soybeans came in at 36.8 million hectares when the average market expectations were 35.9 million. Since in the 2021/22 cycle, the North American area was 35.3 million hectares, the bets are for an increase of 1.5 million hectares from the previous year, which would be a result above the area estimated for corn, as can be seen in the following section about the cereal.
In case this area is confirmed, and considering the productivity estimate published in the Agricultural
Forum, at the end of February, the soybean production in the US could reach 126.2 million tonnes, which would be a historical record and a result of 4 million tonnes higher than the Forum's estimate.
However, it is important to highlight some points that may change this area's perspective. Besides the normal course of the cycle, with climatic issues that may result in last-minute switching between crops, there are other points to consider this year.
The possibility of an increase in the soybean area in the US has been fueled by the important crop failures in South America and the very high costs of fertilizers that have a greater weight on corn. However, it is necessary to consider the period during which this USDA survey of US producers was carried out, which probably did not include most of the period of Russia's invasion of Ukraine. Since the end of February, when the conflict started, corn prices in Chicago advanced proportionally more than soybean prices, which would favor the cereal compared to the oilseed when comparing Chicago prices for the end of 2022, when the new North American crop will enter the market.
Thus, even though this data has surprised, adjustments may still happen until the acreage update is released at the end of June.
Soybean acreage - US (million hectares)
Source: USDA. Design: StoneX. *Planting intentions.
Corn
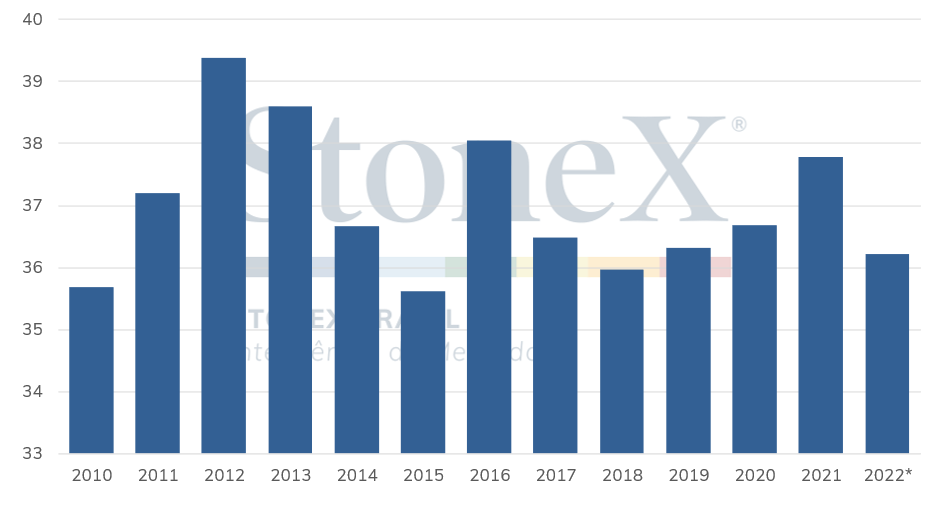
In the case of corn, the numbers brought in the planting intentions report had a bullish effect on grain futures in Chicago. The Department indicated that the US would plant 36.2 million hectares of corn, 1.6 million, or 4.2%, less than the 2021/22 crop and 1 million, or 2.7%, less than expected by the market. About the states, we highlight the decreases in the annual comparison of 242.8 thousand hectares (7.1%) in Minnesota and 202.3 thousand hectares (12.2%) in North Dakota.
In case the estimated area is realized and considering the percentage of the area that will not be harvested – that includes both the abandoned area and the area destined to silage – calculated by the Agricultural Forum (8.3%) and the yield at 11.4 t/ha (in line with the historical trend and considering normal weather), the country would produce 378.5 million tonnes, 5.4 million less than the 2021/22 season and 8.6 million below the estimated by the Agricultural Forum for the 2022/23 season, which tends to promote another year of strengthened prices, given the expectation of strong international demand and lower supply in the US.
However, as already mentioned, it is necessary to consider that a large part of the survey was carried out before the conflict between Russia and Ukraine, not fully accounting for the rally that the tensions in the Black Sea caused in corn prices due to the concern with a significant decrease in the international availability of the grain. Therefore, the planted area may be larger than estimated in the Planting Intentions.
Corn acreage - US (million hectares)
Source: USDA. Design: StoneX. *Planting intentions.
Wheat
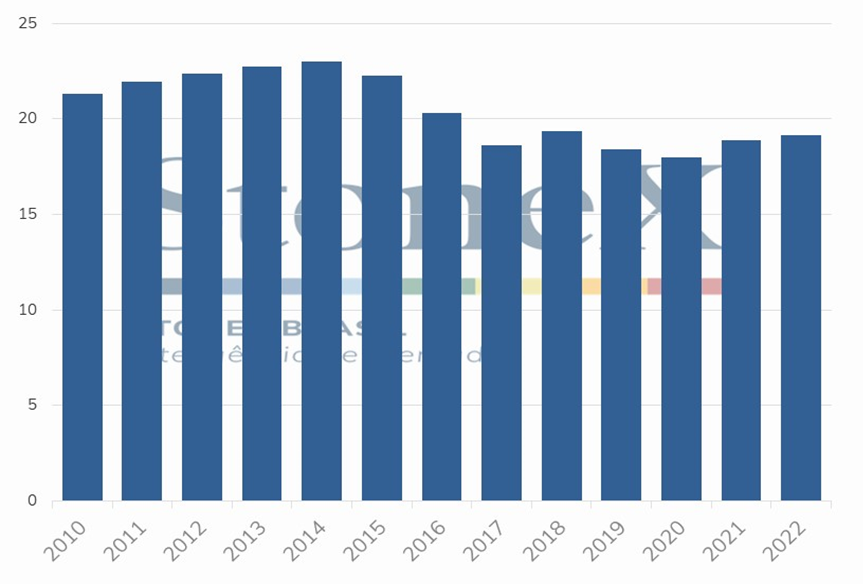
For wheat, the planting prospects for the US brought an increase of 1% in the total area against 2020/21, estimated at 19.2 million hectares - compared to the previous crop data. Still, if realized, it will be the fifth-lowest planted area since 1919, when the historical data began.
It is worth pointing out that the perspective of an advance planted area was largely due to winter wheat, which, if confirmed, should grow up to 2% compared to last year, with 14 million hectares. However, the expectation for 2022 spring wheat is down 2% from 2021 and is estimated at 4.5 million hectares. Finally, for
Durum wheat, a planted area of 800,000 hectares is expected, a 17% increase over the previous year.
In the main producing states of the US, Kansas and Texas, the perspective is that the planting area will increase by 1.4% for the former and remain constant for the latter, totaling 3 million hectares and 2.2 million hectares, respectively.
This balance of a larger wheat area for the US tends to be reflected in higher production. It is worth noting that about 9.6 million hectares are Hard Red Winter, 2.8 million hectares are Soft Red Winter, 1.5 million hectares are White Winter, and about 4.25 million hectares are Hard Red Spring wheat.
Wheat acreage – US (million hectares)
Source: USDA. Design: StoneX. *Planting intentions.
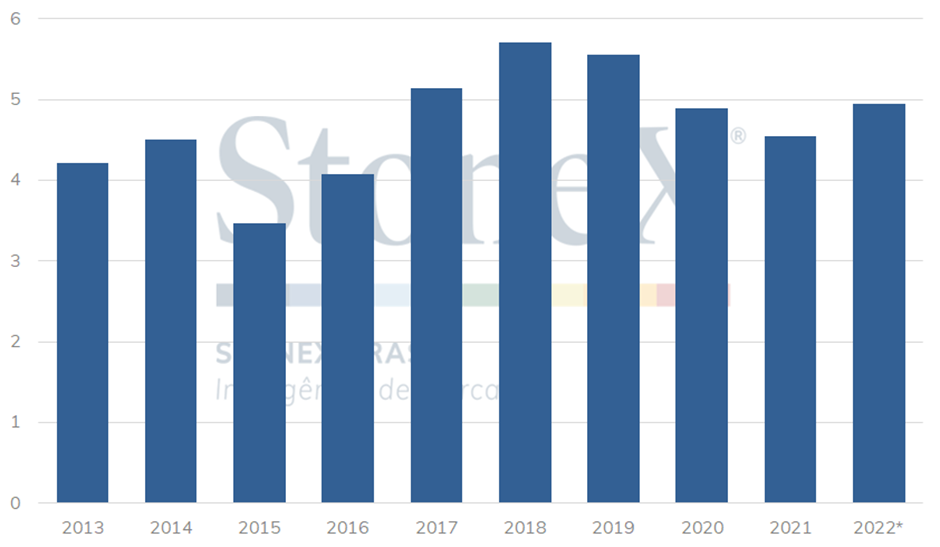
In the USDA’s report, the planting intentions for the 2022/23 crop pointed to acreage at 4.98 million hectares in the United States this year, high by 9% from 2021/22. The data did not bring many surprises to the market, expecting this increase.
In Texas, its main producing state, the area should increase 7.1% to 2.76 million hectares.
The Mississippi River Delta region is where the USDA projects the largest relative increase in planted area, at 18.4%. However, market expectations were already more optimistic a few months ago.
Cotton was a highlight in 2021 when prices had an annual high of 44%, relatively more intense if compared to the appreciations in the grain complex – which compete for areas in the Delta region. At the turn of the year, reflecting crop failures in Latin America and the war between Russia and Ukraine, cotton was losing some of its competitiveness to grains, although it is still extremely favorable for cotton growers worldwide – precisely, the area in the US will increase significantly.
For example, some market institutions have already estimated cotton planting in the region of 5.2 million hectares. Still, the current outlook in the first data from the USDA remains positive. It is worth noting that production will not necessarily be 9% higher, as productivity is the "second step" for North American supply.
The drought seen in the cotton belt, especially in Texas, is threatening yields in the US fields. Production costs, in turn, are barriers to production in the country, either by discouraging even larger sowing or by indicating less application of fertilizer – something that also directly impacts the productivity in 2022/23.
Therefore, the Planting Intentions report was more neutral for cotton. It points to an increase in the planted area expected by agents but a decrease compared to expectations from a few months ago. But it also does not necessarily explain a production increase in the same proportion in the United States, giving sufficient grounds for the market to remain cautious in their decisions for 2022/23. Worth pointing out that the December/22 contract (settled slightly above US¢ 110/lb), although on an upward trajectory, it did not have a sharp escalation as May/22 and July/22 futures, which are still in a scenario conducive to speculative attacks.
Cotton acreage – US (million hectares)
Source: USDA. Design: StoneX. *Planting intentions.
Production Costs - Fertilizers
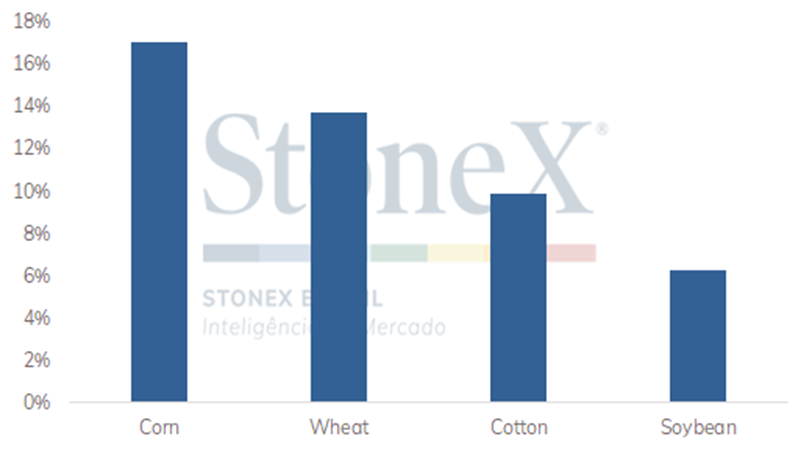
One of the main reasons for switching the area planted with corn to soybean for this next American crop is the lower production cost of corn compared to soybean, especially with fertilizers. According to historical data from the USDA, while fertilizers account for a little more than 6% of the soybean production costs, for corn, this representation grows to 17% on the national average. This scenario becomes particularly more delicate when we observe the variation in fertilizer prices in relation to the same pre-planting period a year ago: the price of urea in the US jumped 133% between the end of March 2021 and 2022, DAP is 83% more expensive, and potash 270%.
In addition to higher prices, fertilizer availability has also been a challenge during the US fertilizer procurement period. The war in Ukraine has only sharpened an NPK buying difficulty that had already been discussed in recent months. Despite the tightening in the current scenario, the strong imports recorded in recent months will hardly allow the lack of product internally throughout applications. However, reports of cuts in the volume applied to crops are concrete and should occur, to some extent, for both crops. It is still too early to estimate the intensity of an eventual reduction in applications and its effects on productivity at the end of the harvest. It will be necessary to follow closely the progress of the American crop over the next few months, as well as the development of the weather, which should play an even more important role this year, for the good progress of the American 2022/23 crop.
Average share of fertilizers in the total cost of each crop in the US
Source: USDA. Design: StoneX.