On Thursday (12), the USDA released its supply and demand report, which is always anticipated by the market, highlighting the first numbers for the 2022/23 crop.
Although it is early and much will still change over the new cycle, the report provided insights about what the Department expects for the coming months at a time of uncertainties, such as those related to the conflict in Ukraine.
Soybean
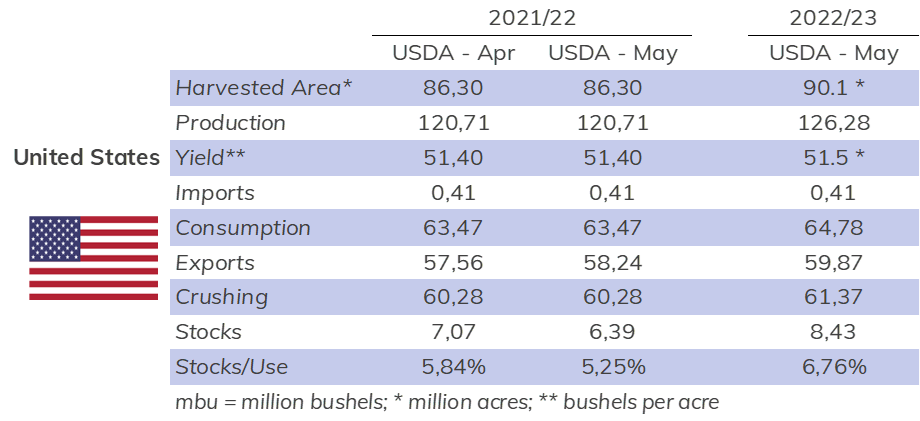
The USDA recycled the acreage released in the planting intentions report at the end of March and yield from the Ag Forum for the US new crop. With a large increase in acreage expected, production was seen at 126.3 million tonnes. With increases in domestic consumption and exports expected, ending stocks stood at 8.4 million tonnes, a tight balance still. For the 2021/22 cycle, it is worth highlighting the new increase in exports to 58.2 million tonnes, with ending stocks dropping to 6.4 million tonnes.
The 2022/23 balance needs to draw a parallel with what was released for corn and detailed in the corn section below. At the same time, the USDA estimates an increase in the US and world soybean consumption, and a drop in the US and world corn demand is expected, which sets up a somewhat conflicting scenario since the demand for both is strictly related to the feed market. Accordingly, the dynamic between these two markets should also change over time with the supply and demand figures reviewed.
For South America, the 2021/22 crop numbers deserve a highlight as the Brazilian production was kept at 125 million tonnes, while Argentina’s dropped to 42 million tonnes.
As for the Chinese demand, imports in the current cycle increased to 92 million tonnes after months of downward revisions. It is also worth mentioning that the country will start buying higher volumes of the oilseed in the 2022/23 season, with the import estimate standing at 99 million tonnes.
For the world balance, it is worth highlighting an increase in 2022/23 ending stocks to 99.6 million tonnes, while the current crop number was cut to 85.2 million tonnes.
Soybean S&D balance - US (MMT)
Source: USDA. Design: StoneX.
Corn
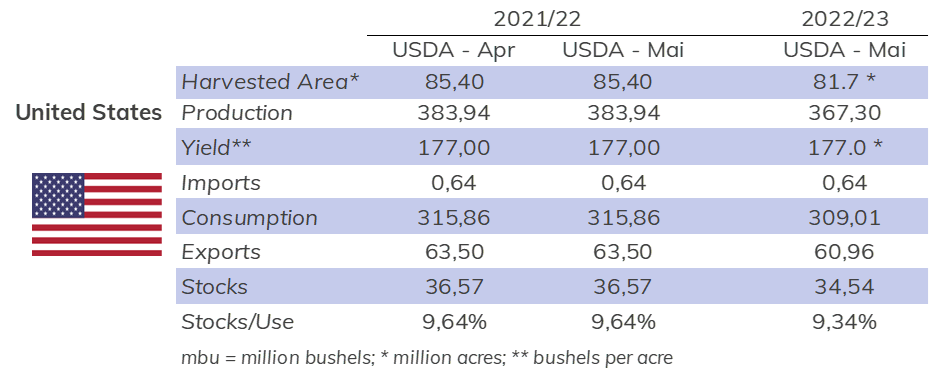
The USDA estimated production at 367.3 million tonnes for the US new corn crop, down by 4.3% from the previous year, resulting from the same intensity drop in the harvest area, estimated at 33.1 million hectares.
The yield was seen at 11.1 t/ha, the same trend yield from the 2021/22 crop but different from the one brought by the Agricultural Forum (11.4 t/ha), representing a change in the Department's methodology. For the past eight years, the USDA has used a model for preliminary yield calculation known as the W-J yield model, released at the Ag Forum and reused in the May report.
The Department stated that this 0.3 t/ha reduction in yield is a way to adjust the result obtained in the model used for the Forum with the significantly delayed planting pace, which is expected to limit the country's production potential. With this, the USDA "anticipated" a cut of 8.3 million tonnes or 2.2% in its production estimate.
Amid the lower US production, the USDA also reduced the country’s corn consumption. As a result, the domestic demand was estimated at 309 million tonnes, a drop of 2.2% compared to the previous crop, while exports reduced to 61 million tonnes, declining 4% from the previous year.
Even with the consumption rationing, the Department estimates a drop in the US ending stocks to 34.5 million tonnes, a volume 5.6% lower from 2021/22. As a result, the stock/use ratio dropped to 9.34%, 0.3 p.p. down from the previous crop.
Regarding the 2022/23 crop in other countries, the main highlights were Brazil's production estimate which stood at 126 million tonnes, 10 million tonnes higher than the estimate for the current crop, and Ukraine's production, which was seen at 19.5 million tonnes versus 42.1 million in 2021/22, reflecting concerns about the war impacts on the country's crop.
As for the world demand for corn, as observed for the US and highlighted in the soybean section, the USDA estimates a drop in consumption in the 2022/23 season to 1,185 million tonnes versus 1,199.4 in 2021/22. A demand reduction was expected since the Department projects an even sharper drop in global production from 1215.6 million tonnes in 2021/22 to 1180.7 million in 2022/23. However, as already mentioned, this scenario diverges from the soybean trend and the complementarity of using both grains for feed since corn is one of the main energy sources for animals. In contrast, soybean is the main source of protein.
Corn S&D balance - US (MMT)
Source: USDA. Design: StoneX.
Wheat
In its first estimate for the 2022/23 crop, the USDA drew attention to reducing 12 million tonnes (-4%) in world wheat stocks. This projection reflects high demand, unfavorable weather conditions permeating different producing regions, and the continuing conflict in the Black Sea.
The USDA pointed to bullish fundamentals for the 2022/23 crop for the US domestic wheat, whose domestic supply remains relatively low and with less domestic use and higher prices. As a result, wheat production in 2022/23 was estimated at 47.05 million tonnes as higher yields offset the reduced harvested area.
The US 2021/22 winter wheat crop was estimated to be down by 6% from the previous season. For the HRW wheat, the main variety in the US, the drop would be 21% to 16 million tonnes because of a drought in the Southern Plains. As for the spring planting, the USDA projected a significant recovery which will allow US total production to increase 0.5% from the previous year.
The highest abandonment recorded since 2002 for winter wheat also drew attention, with the highest levels in Texas and Oklahoma. Exports were estimated at around 21.09 million tonnes, down from the 2021/22 season, continuing at a slow pace and, if it materializes, it will be the lowest volume since 1971/72. This scenario is likely to continue should the US remain uncompetitive in most markets. Projected ending stocks for 2022/23 are 6% lower than last year at 16.85 million tonnes, the lowest in nine years.
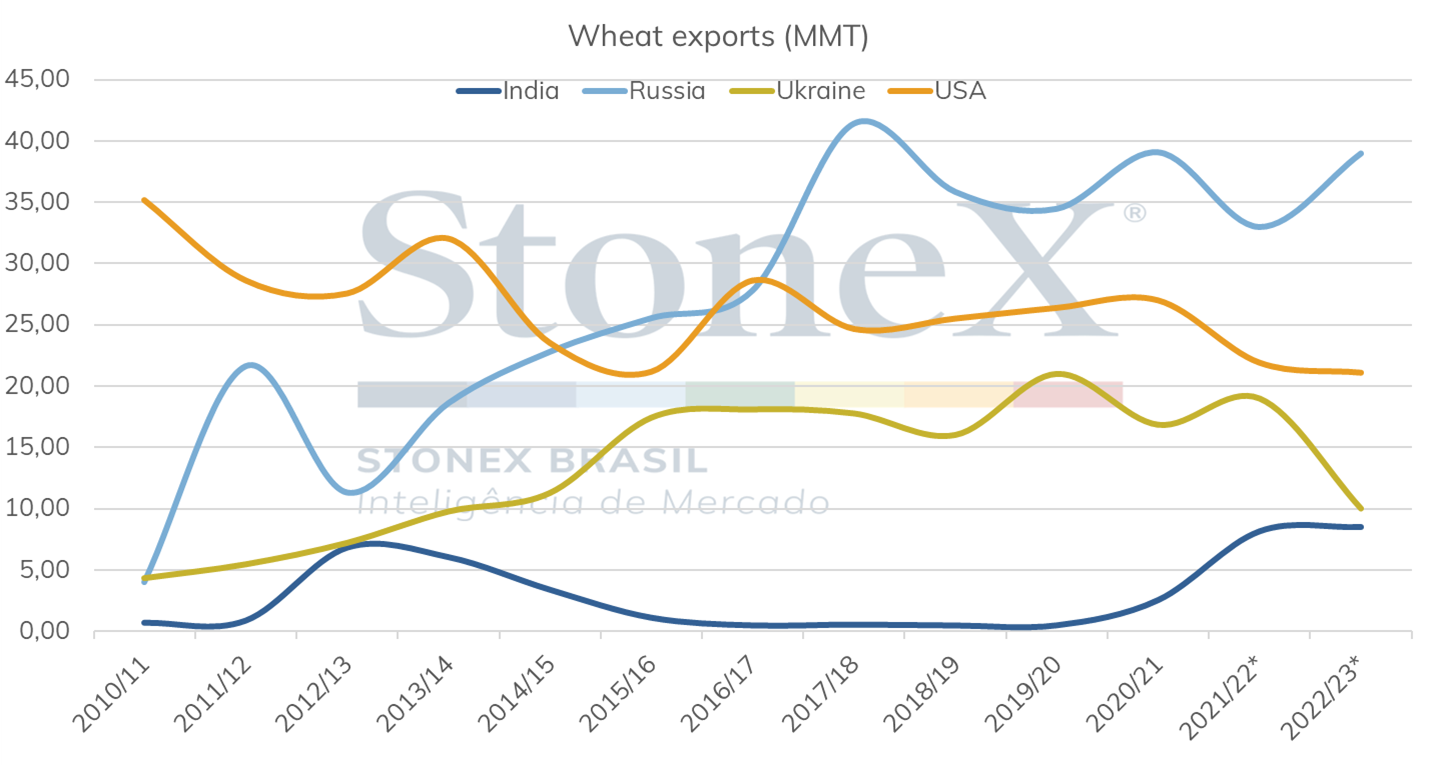
On the international front, WASDE continued to draw attention to the bullish factors. For example, before the conflict between Russia and Ukraine, the estimate was that Ukraine would export 24 million tonnes while Russia would commit to 35 million tons. However, as the conflict progressed, the expectation fell to 19 million tonnes and 33 million tonnes, respectively, a total reduction of 12% for the 2021/22 season.
Wheat exports trend (MMT)
Source: USDA. Design: StoneX.
It is worth mentioning that Ukraine is one of the main wheat suppliers in the international market. According to estimates for 2022/23, only 21.5 million tonnes of wheat will be harvested in the country, 35% lower than in 2021, with exports at 10 million tonnes would be half the 9 million seen in the current crop year.
On the other hand, Russia remains the leading exporting country, harvesting 80 million tonnes with 39 million tonnes to be exported in the 2022/23 season. After Russia, the European Union, Australia, Canada, and the United States occupy the space of main suppliers.
In terms of global production, reduced production in Ukraine, Australia, and Morocco is partially offset by increases in Canada, Russia, and the United States. Projected global consumption for 2022/23 is slightly lower, as increases in food use are more than offset by declines in animal feed and residual use. Reductions in feed and residual use are present in China, the European Union, Australia, and a considerable decline in its use for food in India.
Finally, the USDA drew attention to the reduced outlook for global ending stocks to 267 million tonnes (-5%), the lowest level in six years. The highlight of this variation is for India, where the expected drop is 16.4 million tonnes. Worsening the supply scenario, India announced that it would ban wheat exports, as hot and dry weather has increased concerns about its 2022/23 crop yield after consecutive record crops. India is the world's second-largest wheat producer and has been gaining ground as an important trading partner after the Russia-Ukraine conflict, as Indian supplies were affordable and close alternatives for Asian, North African, and Middle Eastern buyers.
The WASDE report moved the cotton market after bringing conservative projections about the world supply and demand for the 2022/23 cycle. It is estimated that the global supply of 26.36 million tonnes will not be enough to meet demand, even though this shows a drop compared to the previous crop, which led to an increase in prices on the day the report was released.
The Department revised some 2021/22 indicators of the 2021/22 cycle, reducing world cotton production from 26.17 million tonnes in April to 25.79 million in May. This reflects the Indian crop failure due to weather factors, leading to increased imports from the country and a decrease in exports. The world consumption was also revised downwards to 26.77 million tonnes in May versus 27.01 million in April. This indicator has been impacted by the drop in Chinese consumption from the lockdowns adopted by the country.
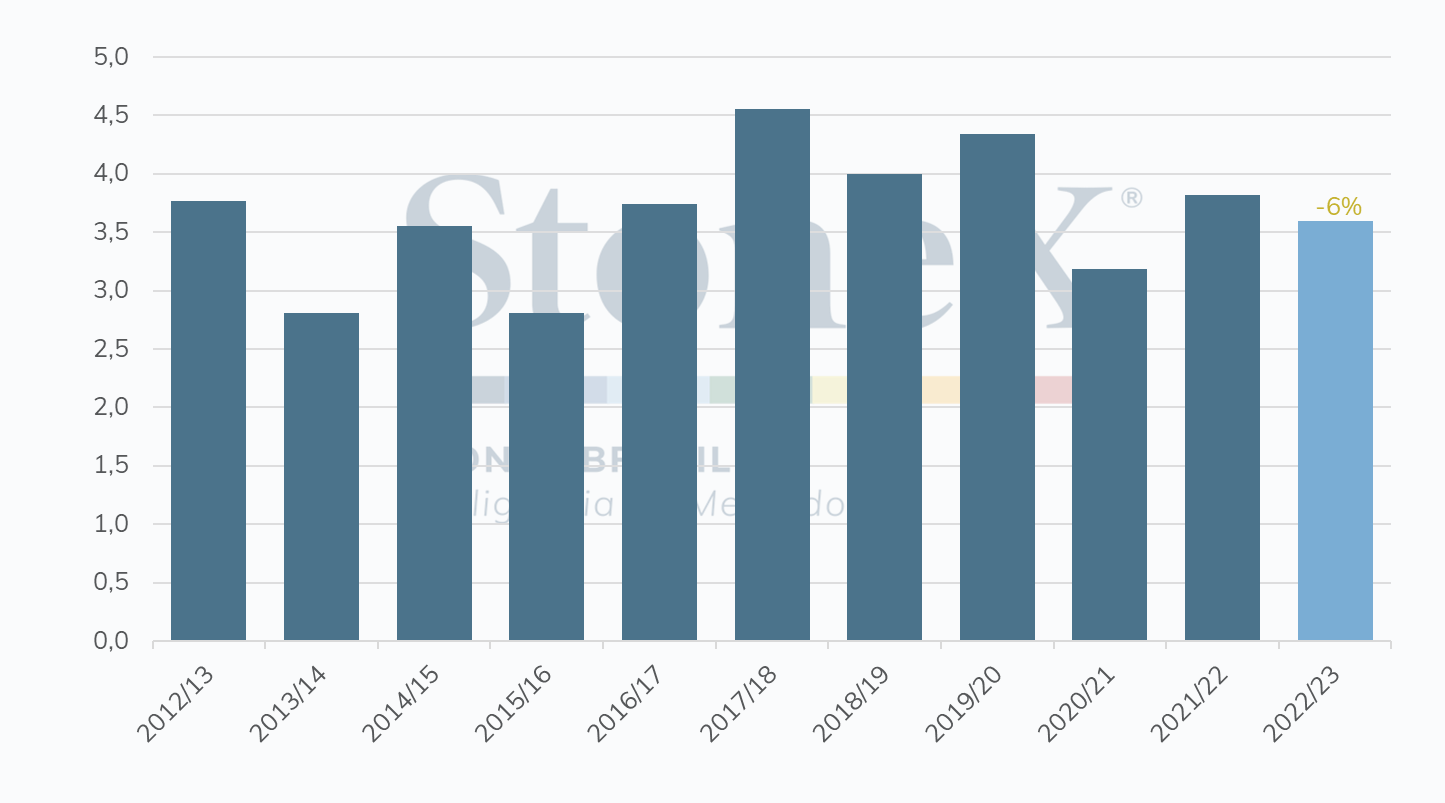
However, the highlights are the first 2022/23 cycle projections. The world supply is expected to increase, but the US, one of the main cotton exporters, should see a reduction in domestic production (3.59 million tonnes) in the coming season versus 3.81 million offered in the previous year. This means that the USDA is already considering a possible crop failure due to extremely dry and unfavorable weather for the crop in Texas, the largest supplier in the country. Given the US scenario, the WASDE shows that Brazil and Australia should increase their market share, exporting 2.18 million and 1.24 million tonnes, respectively. This represents an increase of 26% in Brazilian exports and 29% for Australia.
The report also points to a drop in world demand for cotton, at 26.56 million tonnes versus 26.77 million tonnes in 2021/22. World consumption was already on a downward trend, but the new update signals that the slowdown in the global economy, with higher inflation rates, and increased cotton prices, can affect demand.
It is believed that global demand may reduce further if the downside factors intensify in the coming months, especially concerning the global economic slowdown. In addition, global supply may also be revised downwards, given the uncertainties regarding the North American crop and possible productivity declines in other major exporting countries.
Cotton production - US (MMT)
Source: USDA. Design: StoneX.
The May WASDE report was relatively conservative for the 2021/22 season for the vegetable oils complex and did not majorly revise the soybean oil S&D balance. However, for palm oil, the Department had to adjust to recent export bans in Indonesia, the world's largest producer and exporter of the most consumed oil.
In this latest report, the USDA removed 3 million tonnes of palm oil from Indonesia's 2021/22 export estimate to end the cycle with 25 million tonnes exported. However, given the sales drop in the neighboring country, the USDA raised Malaysia's export estimate by 200,000 tonnes to 16.42 million tonnes, considering that the country will not be able to fully supply the absence of Indonesia's oil from the market. With the lower flow of palm oil leaving Southeast Asia, oil consumption in China was cut by 1.6 million tonnes to 5.75 million tonnes. In addition to the lower supply available in the short term, Chinese palm oil consumption has been significantly hampered in recent weeks due to the uncompetitive price of tropical oil on the international stage, but mainly due to lockdowns imposed by Beijing on important consuming cities.
For the 2021/22 crop, the USDA cut world palm oil ending stocks from 48.2 million tonnes in April to 45.5 million in May.
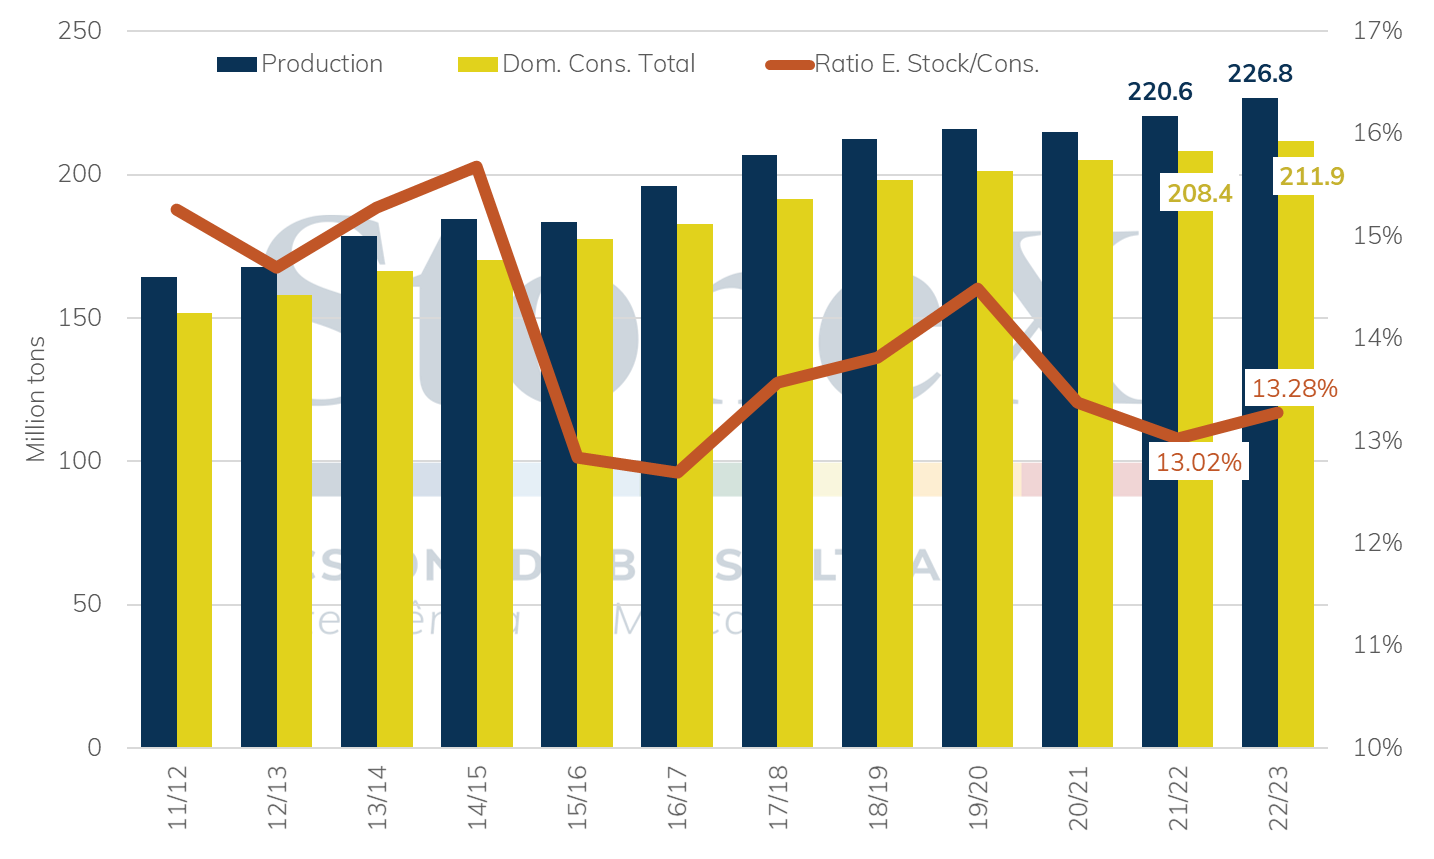
For 2022/23, the USDA renewed the record vegetable oils supply expectation, with world production at 226.8 million tonnes versus the record at 220.6 million the previous year. Oil consumption should also grow, but at the moment, the USDA sees a slight relief for the stock/use ratio at 13.2% in 2022/23 after dropping to its lowest level in five years in the 2021/22 crop.
According to the USDA, the demand for the biofuels sector should continue to lead the vegetable oils consumption growth, increasing its share in total consumption. The volume of oils directed to the biofuels sector should increase by around 5% in 2022/23 compared to 2021/22. As a result, the food sector should increase its share of oil consumption by 2.3% in the coming season. The soybean and palm oil lead the increase in industrial vegetable oils consumption in 2022/23, with the USDA estimating increases of 5.5% and 6.2%, respectively, in demand for biofuel production. The US alone is expected to increase soybean oil consumption for the industrial sector by 12%.
Vegetable oils complex S&D - World
Source: USDA. Design: StoneX.
Translated from its original in Portuguese by
Rodolfo Abachi