The USDA's July WASDE report usually does not bring significant changes, highlighting that the US new crop yield will only be adjusted from August. Yield adjustments are already expected for the country's wheat, which has an earlier season. For cotton, it is worth mentioning that, despite the increase in the planted area and the average yield, the estimated production for the US fell due to the predominance of unfavorable weather in the main areas, and the USDA cut the harvested area.
Soybean
For the US, the USDA incorporated the lower planted area for the 2022/23 cycle, according to the 06/30 report, keeping yields unchanged. Accordingly, the total production estimate was reduced to 122.61 million tonnes. Although further area revisions may still occur, yield is the variable that has the greatest potential to bring further changes to production, with the weather in the coming weeks being very important as the oilseed will enter the grain filling stage.
Even with this decrease in production, carryout fell less than expected, standing at 6.27 million tonnes, since there were some cuts on the demand side for the new crop.
For the 2021/22 crop, the USDA brought a slight cut in crushing, which stood at 60 million tonnes, reflected in a proportional increase in ending stocks.
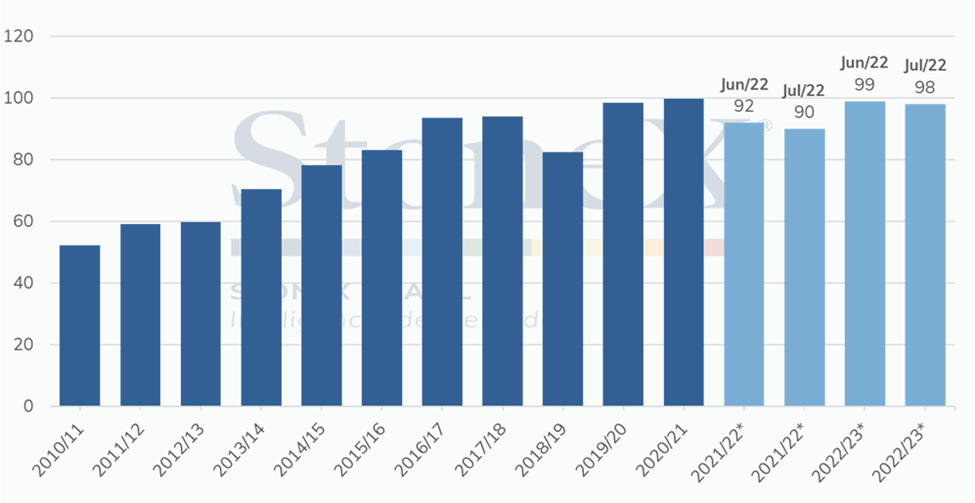
The report highlighted the cut in Chinese 2021/22 imports to 90 million tonnes, while the 2022/23 volume was reduced to 98 million. There are many questions about Chinese demand, which has not reacted as expected after lockdowns to fight Covid-19 were suspended, and its crush margin is often negative. Another point that the market follows is hog prices in the country, which are under pressure, a situation that increases concerns about the demand for feed.
In the global balance, expectations continue pointing to a more comfortable situation, with production exceeding consumption by 13.65 million tonnes.
Evolution of soybean imports - China (MMT)
Source: USDA. Design: StoneX. *USDA estimate.
Corn
Like the soybean market, the July WASDE did not bring any major surprises for corn, with the main changes in the corn balance linked to the incorporation of the US planted area figures released by the USDA at the end of June.
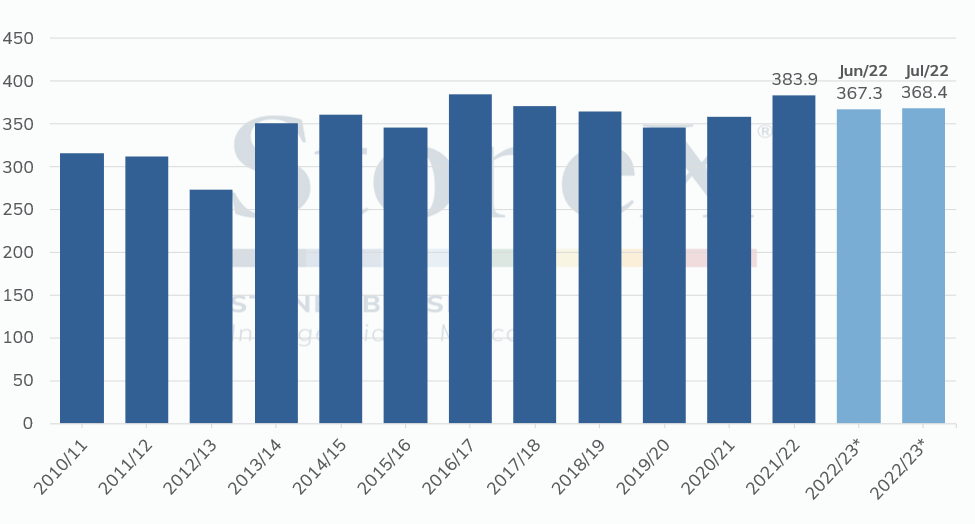
The country's production was raised by 1.1 million tonnes to 368.4 million tonnes. However, due to a slight decrease in domestic consumption for the 2021/22 crop, from 316 million to 315.4 million tonnes, ending stocks for the new crop increased slightly more than production, by 1.8 million tonnes to 37.3 million tonnes. Thus, the country's stock-to-use ratio increased by 0.5 p.p. compared to the June report, to 10.1%.
Despite the weakening pace of US corn shipments over the past few weeks, the USDA did not change its estimate for the 2021/22 crop, which remains at 62.2 million tonnes.
According to the USDA's export inspection report, as of July 7, the US had shipped 49.2 million tonnes of corn, 13 million tonnes below the Department's estimate for the current crop. Thus, to reach the USDA projection, the country would need to ship about 1.6 million tonnes of corn per week by August, about 20% above the average of the last ten weeks (1.3 million tonnes). Thus, there is room for the USDA to revise its number for US corn exports in 2021/22 in the next WASDE.
In addition to a possible change in the export number, it would not be surprising if the Department again revised its production estimate for the US 2022/23 crop, this time with the change occurring on the yield side. Since the first estimate released for the new crop, the USDA has brought in an average yield of 177 bu/acre, or 11.1 t/ha, a number consistent with "normal" crop conditions. However, according to NOAA's Drought Monitor tracking, considerable portions of the US Midwest had drier than normal conditions at the end of the second week of July. In addition, the models point to a continued dry and hot pattern through the end of this week, which could hurt the country’s crop yields.
US corn production trend (MMT)
Fonte: Source: USDA. Design: StoneX. *USDA estimate.. Elaboração: StoneX. *Estimativa USDA..
Wheat
Wheat got the attention of the grain market after an increase in production and stock estimates for the new crop in the United States, which, despite lower production globally, guided the downward movement in prices on the CBOT last week.
For the domestic market in the United States, the 2022/23 wheat crop was estimated at 48.47 million tonnes, an increase of 8% over the previous crop and 2% compared to the June estimate. Stocks were also revised upwards by 34,000 tonnes to 17.39 million tonnes. It is worth remembering that the winter wheat harvest was 63% complete by Sunday (10). This is up from 54% a week earlier and indicates progress at a good pace, higher than the five-year average, at 61%.
The scenario for world wheat was more conservative, with a small drop in production and consumption. As a result, world production in the 2022/23 crop was reduced to 771.64 million tonnes, and consumption reached 784.22 million tonnes, a variation of -0.2% compared to the previous estimate for both.
As for Brazil, production was maintained at 8.5 million tonnes, still below the 9 million tonnes estimated by Conab but above the 7.7 million tonnes of the 2021/22 crop. Stocks were also higher than the previous crop, reaching 1.11 million tonnes. Exports also showed a subtle rise to 3 million tonnes.
US wheat production trend (MMT)
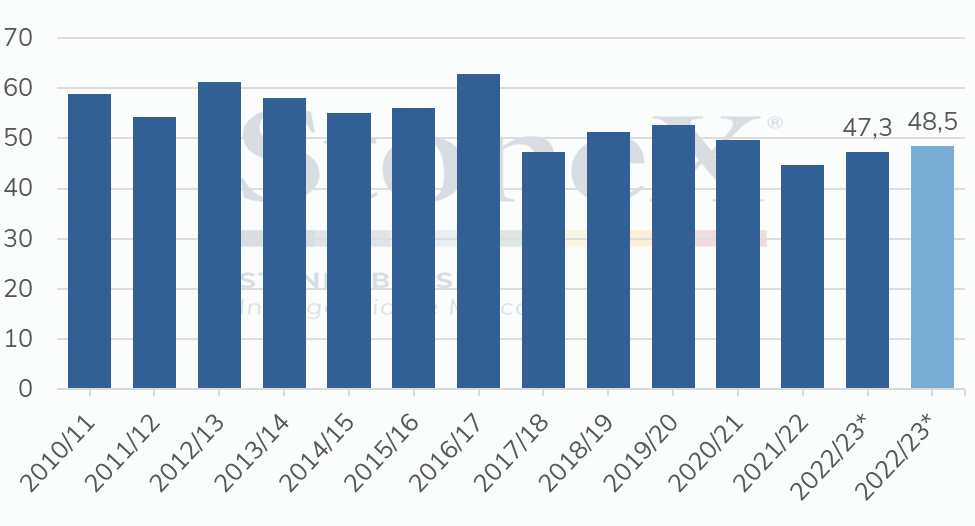
Source: USDA. Design: StoneX. *USDA estimate.
The July WASDE report brought changes to global supply and demand indicators for the 2022/23 crop season, reflecting the changing growth outlook for the world economy. In recent weeks, the increased inflation and announcements of contractionary adjustments by several central banks, especially the Fed, led to the expectation that household incomes will fall, reducing the consumption of textile derivatives to 26.1 million tonnes (-400,000 from June). In addition, global supply has also been revised up, but to a lesser extent than demand, and the S&D balance is now more balanced, with consumption slightly lower than production.
The biggest supply adjustments were in the United States and Brazil. In the US, production for the 2022/23 cycle was further reduced from 3.59 million tonnes in June to 3.37 million this month (-6.1%). With this, the country's exports were also reduced by 3.4% and ending stocks are now evaluated at 0.52 million tonnes, a drop of 17% from June and almost 30% when compared to the figure for 2021/22. Furthermore, with these results, it is admitted that the abandonment rate is approximately 31%, a value above the average for the country (20%) and a direct consequence of the unfavorable weather that prevails in the Cotton Belt, especially in Texas, with the exceptional drought and hot temperatures threatening the crops.
In Brazil, the production revision for the next cycle (from 2.9 million to 2.8 million tonnes) does not annul the perspective of growth of this indicator between crops, being 5.7% higher than in 2021/22. Moreover, Brazilian exports should be around 2 million tonnes, well above the 1.7 million tonnes expected for the current crop.
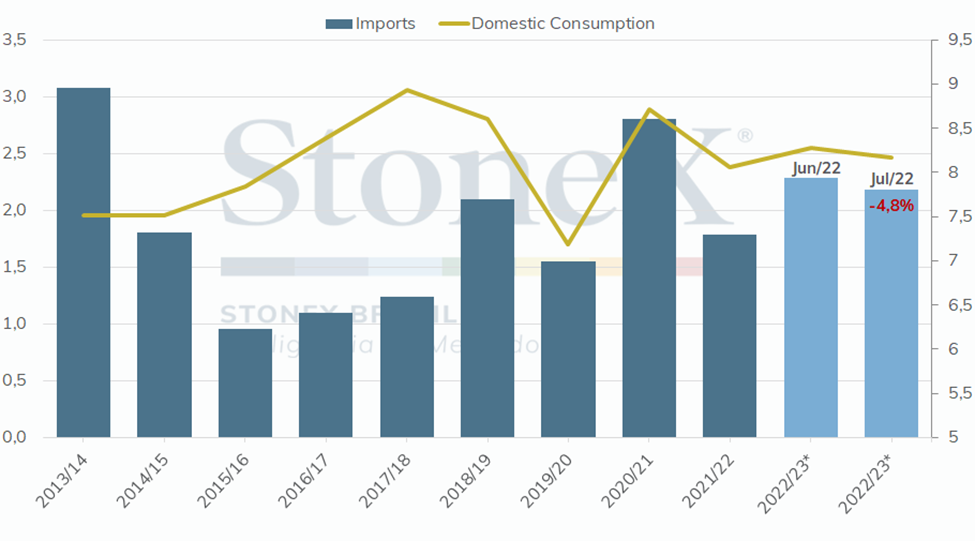
Despite these bullish factors, the WASDE report showed significant, though expected, revisions in demand. Countries such as China, Bangladesh, and Vietnam, the largest plume demanders, had their consumption and imports reduced. In China, for example, domestic consumption fell to 8.2 million tonnes (-100,000 from June), which explains a similar drop in imports. Despite these revisions, the annual variation of these indicators remains positive but may not be able to sustain itself with the prospect of stagflation.
Overall, the report assumed a neutral/bearish tone, given that the agents were already expecting the revisions made by the agency. Thus, it helped partially explain the drops in cotton prices in NY last week, but the speculative factor continues to have greater weight on the downward trajectory of cotton in the short term.
Evolution of cotton imports and consumption in China (MMT)
Source: USDA. Design: StoneX. *USDA estimate.