

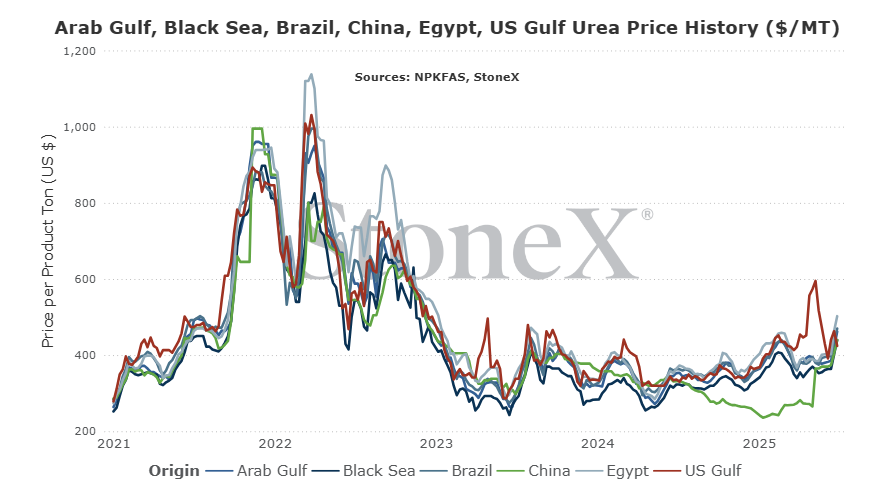
The intention of the below graphs are not to use to say "my price should be X based on this graph". These prices are derived from an FOB price point average. The intent is to show major global price movement trends. Your values will likely have significant basis difference (similar to your local grain price being different than the traded market price).
This graph is labeled as MT in USD currency.
- Prior to the war starting - $345
- Height of tensions (Monday, June 23) - $455
- June 25 - $385
Values have come off $75 in a matter of a couple days. However, the price is still $40 higher than where we began.
All in all, it looks like the fighting is done as Iran has shown very little willingness to continue. We are hearing that production in Iran and Egypt is already in the process of restarting which is great news for the world. In fact, one positive that could come from this is that part of the peace agreement could mean Iran being able to do more business with the world. If so, Iranian produced urea could suddenly starting finding much more efficient destinations rather than targeting countries that are will to ignore global sanctions. It is still too early to tell if that will happen, but it is on our radar.
Another positive could be that President Trump sets his sights on finding peace between Russia and Ukraine...but we will talk about that later.

- December 19 tender - 1.5M ton goal / 187K tons secured
- January 23 tender - 1.5M ton goal / 558,900 tons secured
- March 26 tender - 1.5M ton goal / 884,650 tons secured
- May 28 tender - 1.5M ton goal / 229K tons secured
Unsurprisingly, India announced yet another purchase tender immediately after the last tender completed. This will be known as the June 24th tender.
- Offers are due by July 7th.
- Vessels are to ship by August 22nd.
The biggest stand out of the announcement was the tonnage. Normally, the tenders look for 1 - 1.5M tons. This tender is looking for a staggering 2M tons total split between the coasts. I cannot remember a tender where they have stated this high a goal.
It is still far too early to tell how this will play out. They are looking for a lot of tons during a part of the year where demand is typically the lowest which "should" mean that offers are big. On the other hand, there are a lot of supply issues with Chinese exports likely to be less than half of normal, Europe continuing at a 75% production rate, Iran and Egypt continuing to have problems, etc.
We will continue to watch and get updates as we get them. This piece is more to show that the world matters. If this tender sees prices lower, teh rest of the world is likely to follow. If this tender ends higher, everyone else will follow to a certain level.
Basically, world events matter.
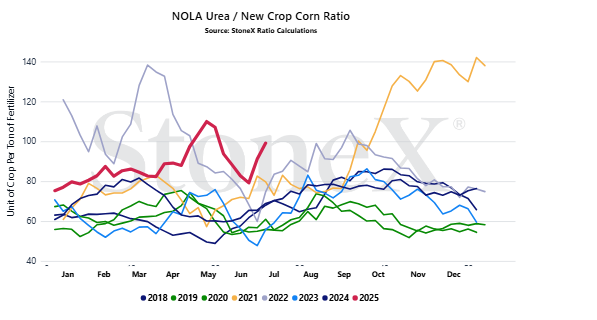
- NOLA urea - $455
- December 2026 corn - $4.62
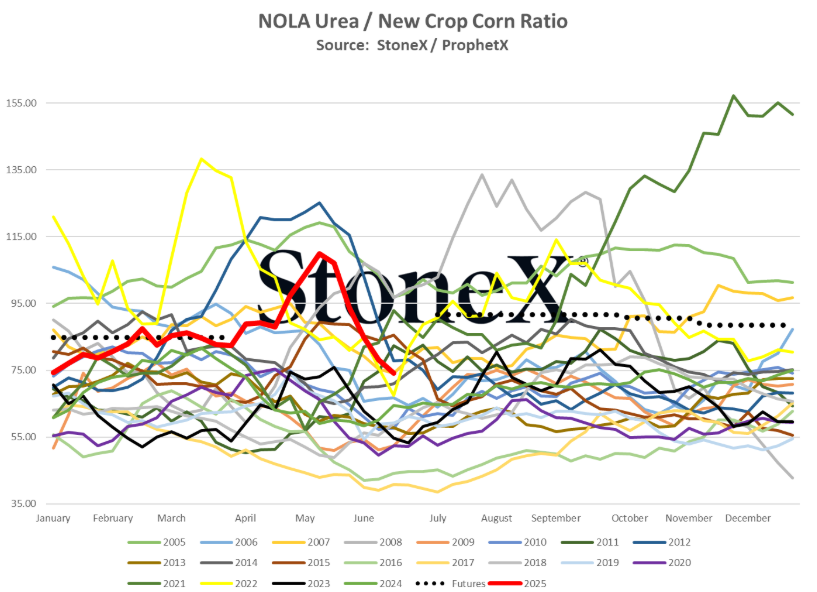
- Ratio set at 98
For this time of year, that was the worst value we had ever seen. Fortunately, it quickly corrected to where we are now which...isn't that great.
- NOLA urea - $390
- December 2026 corn - $4.54
- Ratio set at 86
I had considered not including this piece because this situation lasted for about 24 hours, but I think there is a solid lesson in here on why this is a powerful tool. It can also be a tool that shows how a high/low grain price may or may not be good when compared to fertilizers.
If we look back at the previous 2 worst ratios in history for the month of June, they show completely different scenarios:
- 2005
- NOLA urea @ $250
- December 2006 corn @ $2.56
- Ratio - 97
- 2008
- NOLA urea @ $660
- December 2009 corn @ $6.82
- Ratio - 97
In 2005, the corn price was terribly low but the price of urea was cheap as well, so no big deal right?
In 2008, the corn price was phenominal so the price of urea didn't matter, right?
Both scenarios were the exact same when we look at just the urea/corn relationship. We are looking at only that part of the input/output section of farm marketing. They were the exact same. In both examples, farmers were spending 97 bushels of their hard earned corn crop to pay for a single ton of urea. We can make a case that the 2008 scenario was better because higher corn price helps the overall farm. I cannot argue that. However, there are inputs that we can work to our advantge and inputs we cannot. Things like seed, chemical, etc. do not have a lot of price volatility. You can find different prices based on the different types, but those values are relatively flat. For commodities like fertilizers, diesel fuels, etc., there can be opportunities and risk. At the end of the day, we are trying to keep more bushels that we can sell at a profit when we want. If we are locking in ratios that cost more bushels, that is less to sell. If we are locking in ratios that are low, we have more to market later on.
I'm not trying to use this to beat anyone over the head with. Just trying to use it as an educational moment for an approach that we think can be extremely valuable to farm marketing.
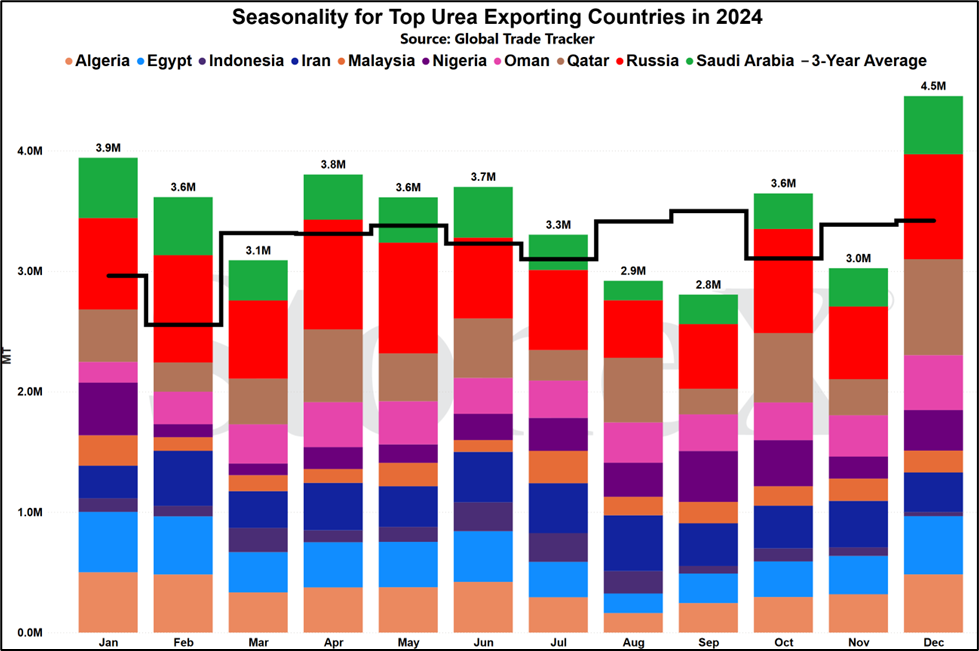
- European region - with Russian gas no longer flowing, European natural gas values jumped and nitrogen production slowed. Today, we estimate EU production of nitrogen at about 75% of normal.
- China - the government continues to restrict exports to the tune of 2M tons for 2025 (we hope) vs their "normal" flows of 5 to 5.5M tons.
- Iran - before their fight with Israel, Iran had production issues due to unreliable gas flows. The fight with Israel only added a few weeks of production downtime.
- Egypt - like Iran, they had issues before they lost gas flows from Israel. The fight only compounded the loss.
- Russia - Ukraine has been attacking targets deep within Russia and one of those recent attacks centered on a nitrogen production facility. I still believe they were trying to shut down that plants nitrate production capabilities, but urea production was also impacted.
There are other hiccups which include expected North American production downtime as several plants need to make repairs this summer.
Does this mean there will be shortages? No. I am NOT saying that.
What this does mean that the global urea market is poised to react even more violently if there are other problems. The global S&D is already extremely snug. Any further issues just make it worse.
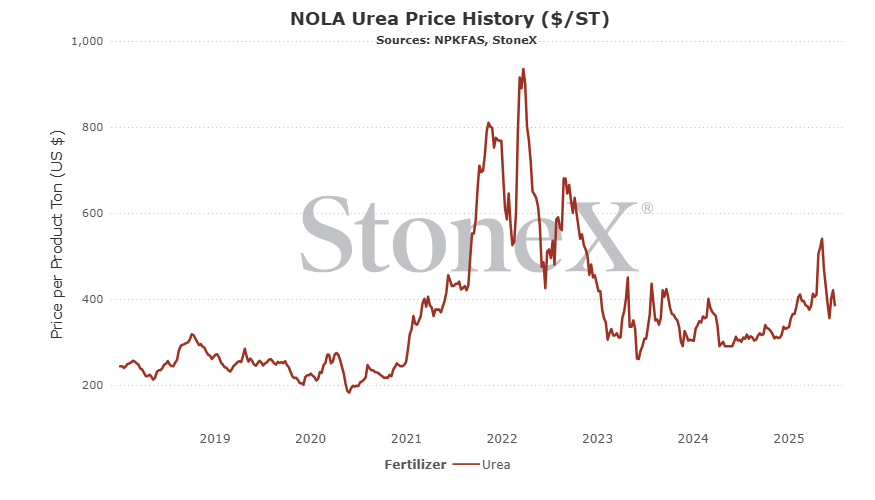
NOLA/New Orleans, Louisiana
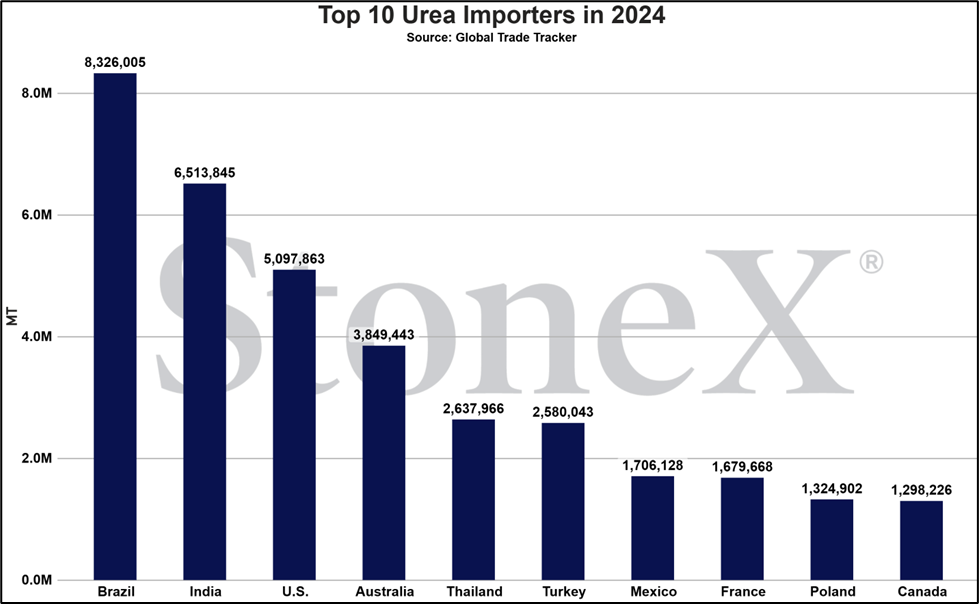
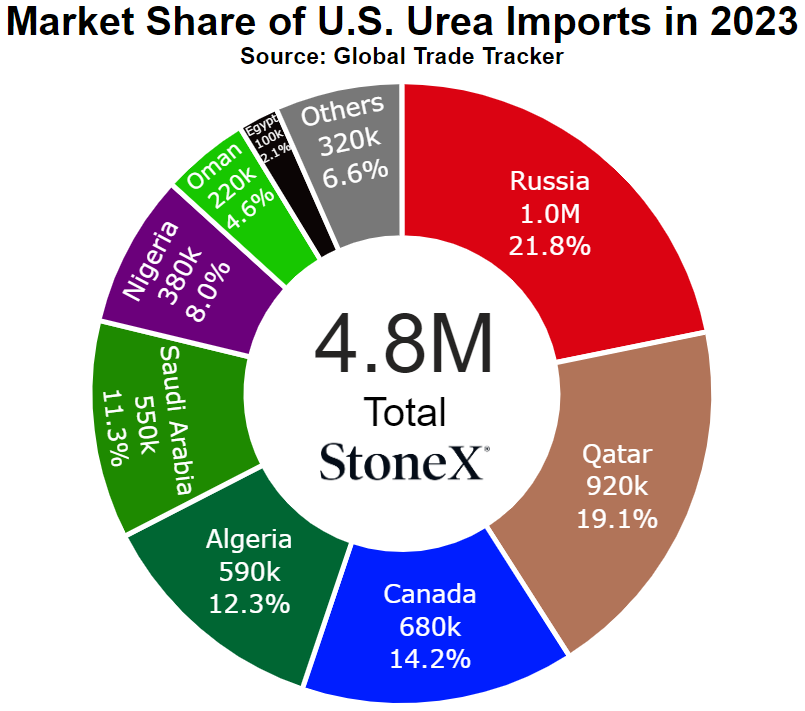
Number 3 global importer in 2022
Price comparisons
Vs 30 days ago - -1% or approximately $5 lower
Vs 90 days ago - -7% or approximately $27 lower
Vs 6 months ago - 15% or approximately $50 higher
Vs 1 year ago - 26% or approximately $80 higher
U.S. Midwest Average
Vs 30 days ago - -13% or approximately $73 lower
Vs 90 days ago - 2% or approximately $8 higher
Vs 6 months ago - 25% or approximately $97 higher
Vs 1 year ago - 31% or approximately $117 higher
U.S. Southern Plains Average
Vs 30 days ago - -16% or approximately $95 lower
Vs 90 days ago - 1% or approximately $3 higher
Vs 6 months ago - 28% or approximately $110 higher
Vs 1 year ago - 38% or approximately $138 higher
U.S. Northern Plains Average
Vs 30 days ago - -11% or approximately $63 lower
Vs 90 days ago - 12% or approximately $57 higher
Vs 6 months ago - 28% or approximately $115 higher
Vs 1 year ago - 43% or approximately $157 higher
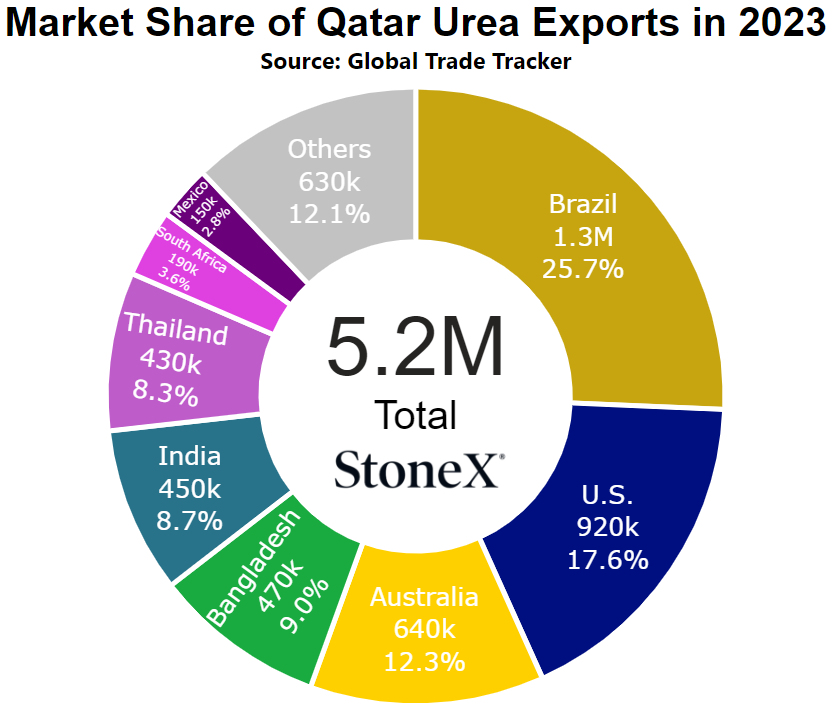
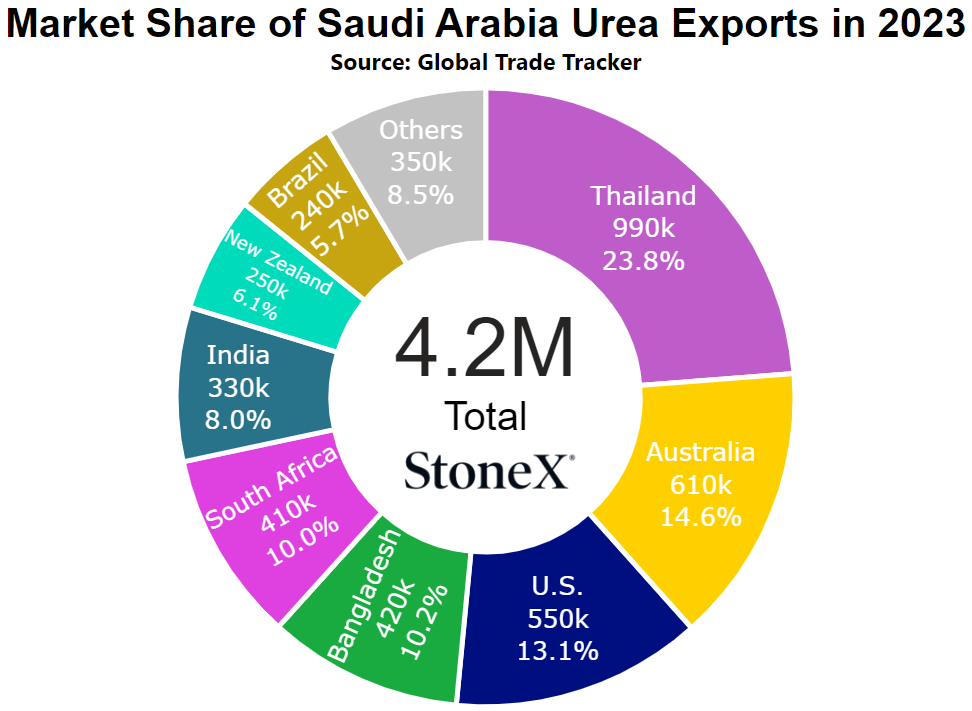
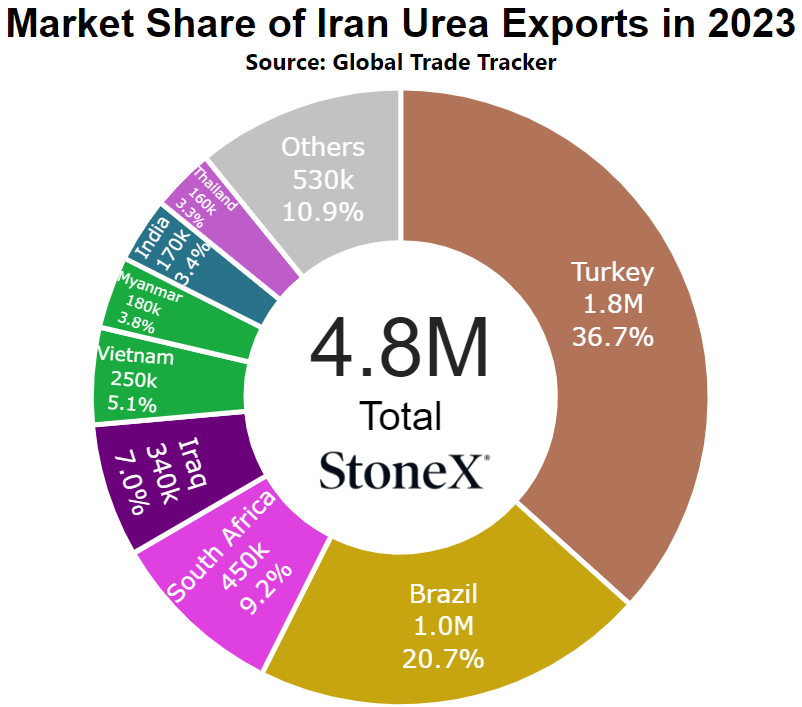
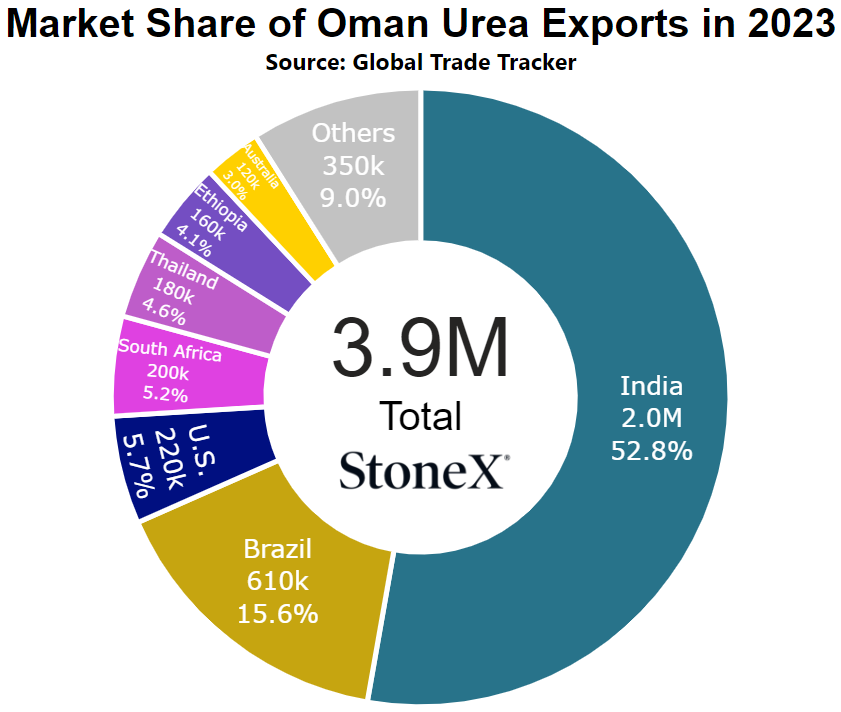
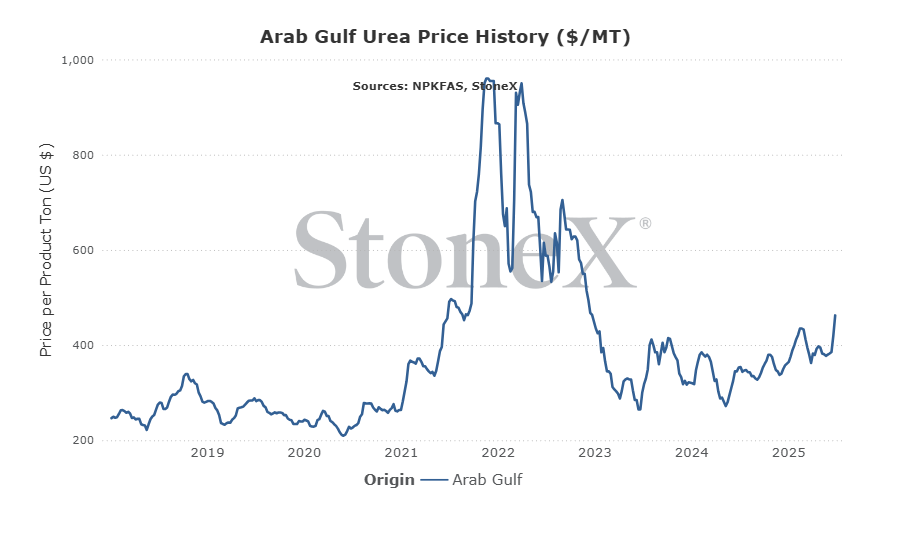
Middle East
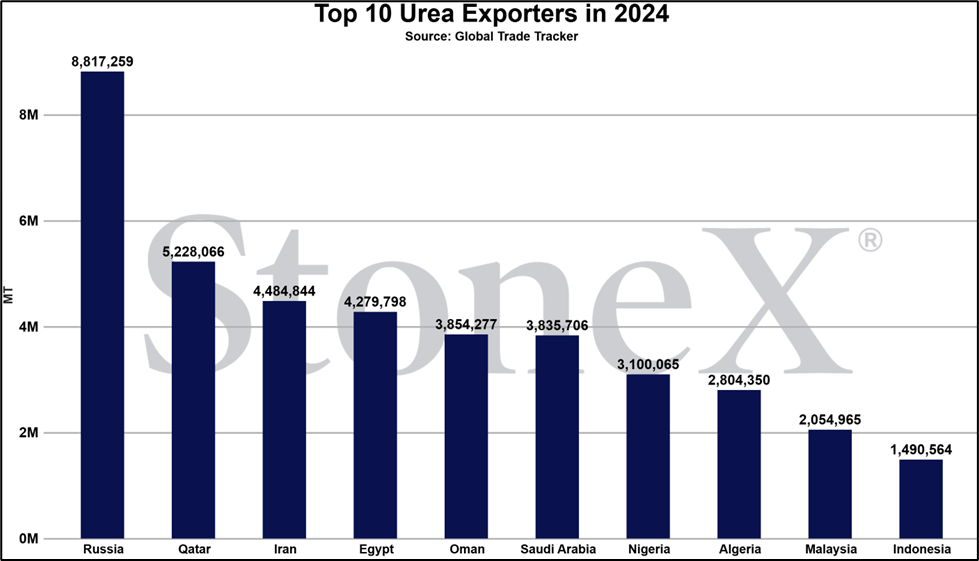
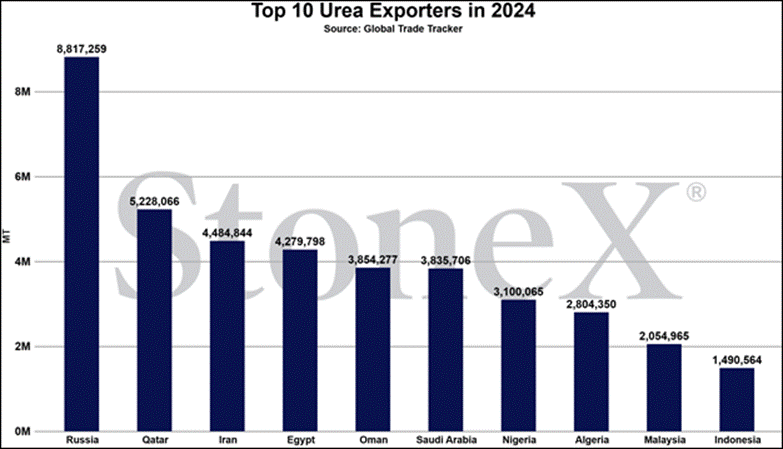
Number 1 exporter (as a region, not as individual nations)
Vs 30 days ago - 22% or approximately $83 higher
Vs 90 days ago - 21% or approximately $80 higher
Vs 6 months ago - 27% or approximately $98 higher
Vs 1 year ago - 31% or approximately $110 higher
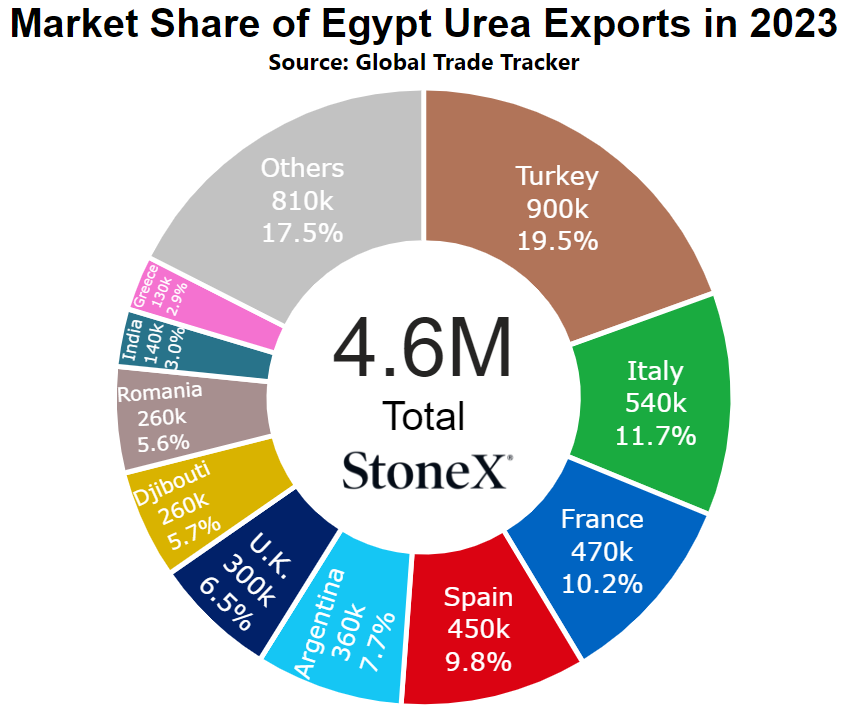
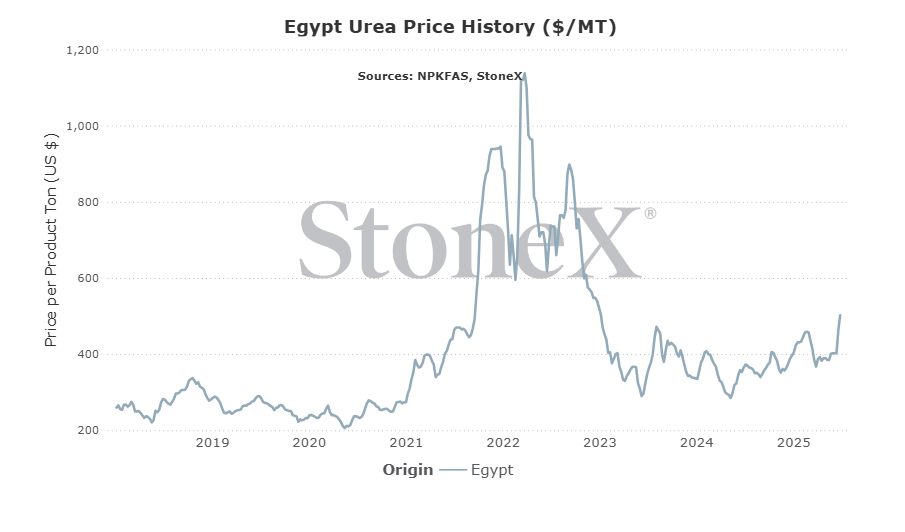
Egypt
Number 4 global exporter in 2022
Price comparisons
Vs 30 days ago - 25% or approximately $100 higher
Vs 90 days ago - 30% or approximately $116 higher
Vs 6 months ago - 24% or approximately $98 higher
Vs 1 year ago - 38% or approximately $138 higher
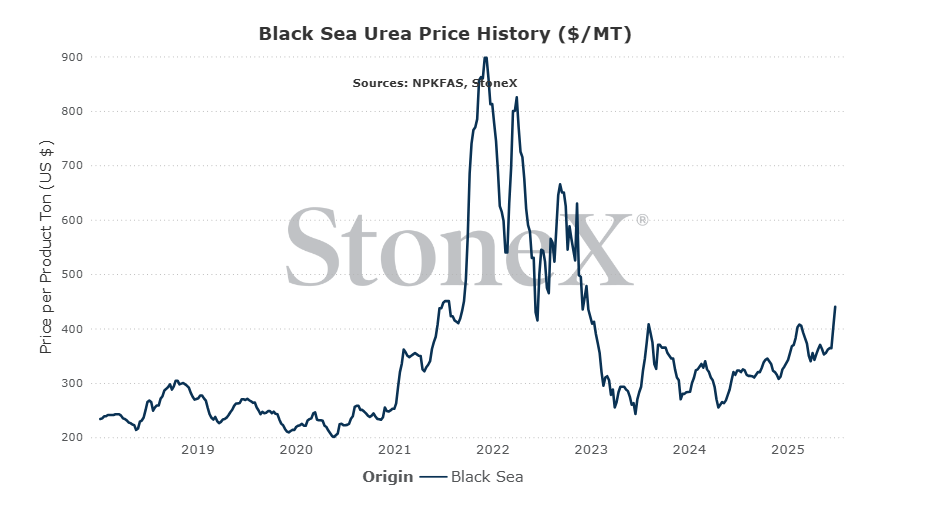
Black Sea
Number 1 global exporter in 2022
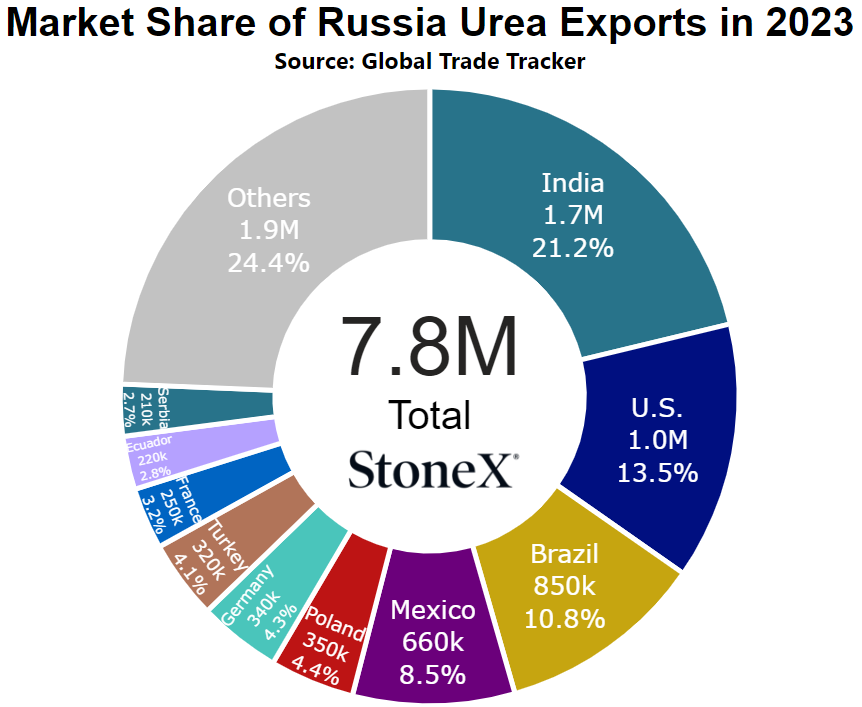
Price comparisons
Vs 30 days ago - 22% or approximately $79 higher
Vs 90 days ago - 24% or approximately $85 higher
Vs 6 months ago - 28% or approximately $98 higher
Vs 1 year ago - 36% or approximately $118 higher
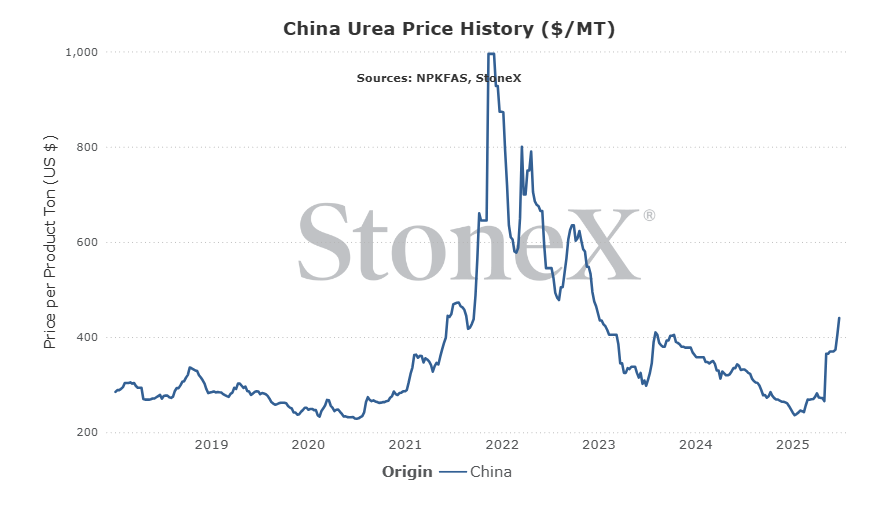
China
Number 9 global exporter in 2022
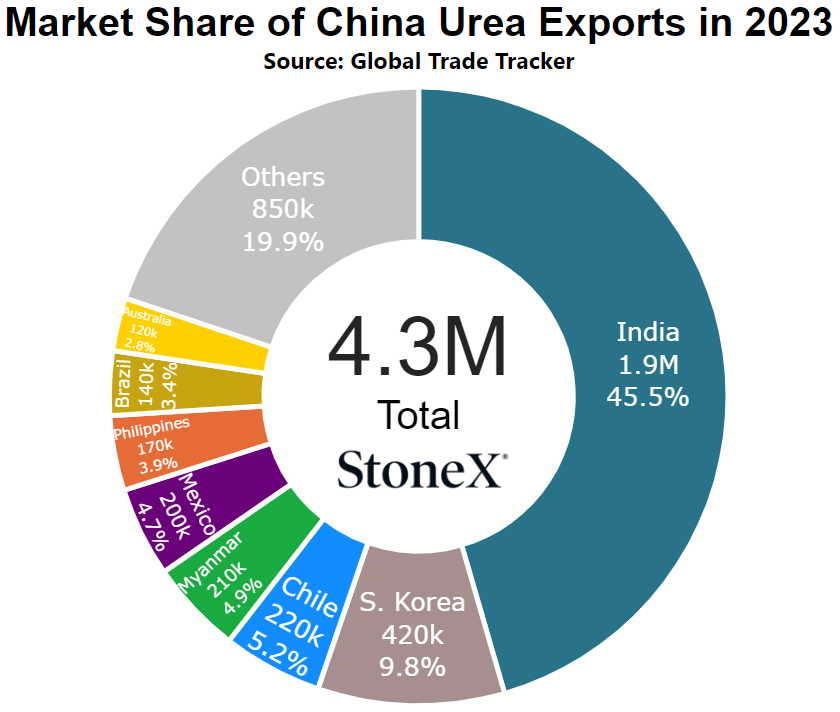
Price comparisons
Vs 30 days ago - 19% or approximately $70 higher
Vs 90 days ago - 56% or approximately $158 higher
Vs 6 months ago - 82% or approximately $199 higher
Vs 1 year ago - 33% or approximately $108 higher
Brazil
Number 2 global importer in 2022
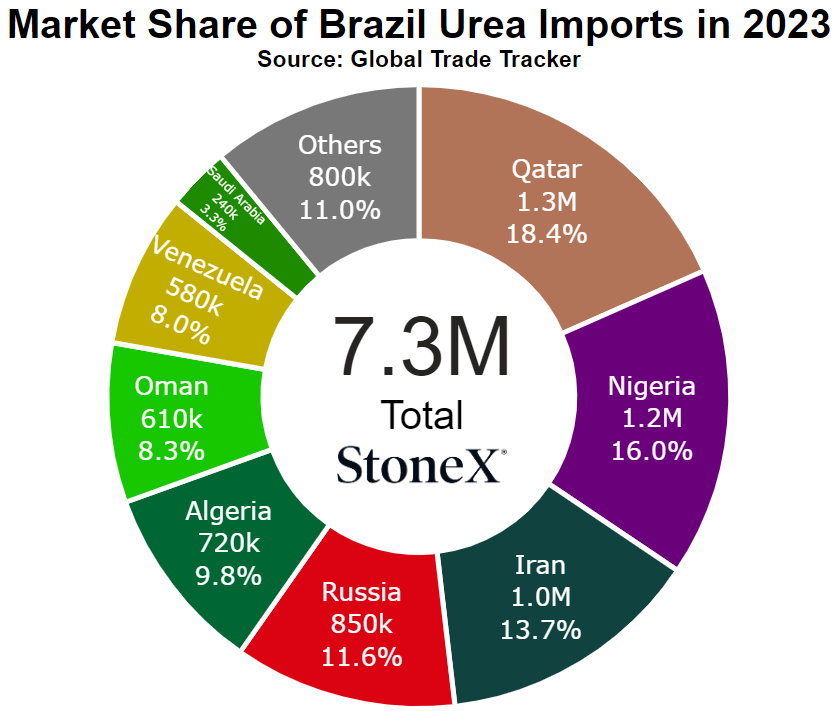
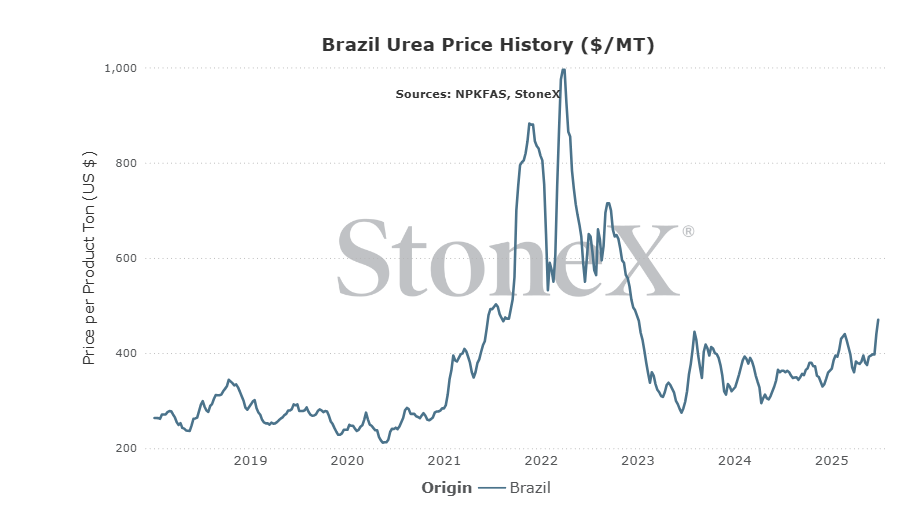
Price comparisons
Vs 30 days ago - 19% or approximately $75 higher
Vs 90 days ago - 23% or approximately $88 higher
Vs 6 months ago - 28% or approximately $103 higher
Vs 1 year ago - 30% or approximately $108 higher
- Tensions in the Middle East are reignited- right now as I write this, the ceasefire between Israel and Iran is holding. That is raising hope that this conflict is done which means that nitrogen production in the region can resume full capacity. However, we know how quickly things can fall apart. We know that in the last days of the conflict, Iran was threatening the Strait of Hormuz. If fighting begins anew, no doubt global nitrogen/urea markets will respond higher.
- India needing 2M tons on this tender creates enough demand to boost the markets - typically as we enter into the 3rd quarter of the calendar year, demand falls as no one wants ownership. Manufacturers around the world see unsold inventories start to build which puts pressure on prices. However, this year is different. India has just announced a fresh purchase tender after the last 4 "failed" to reach their tonnage goal. This tender is requesting 2M tons to be secured. Doesn't matter how you look at it. That is a lot and provides a life jacket to a market that might have been eying lower prices due to lack of buyers.
- The Chinese government decides to slow/stop exports - the world of urea is already struggling with a list of supply issues. Unfortunately, China remains on that list due to expectations being that exports will only reach 2M tons vs their normal 5 to 5.5M tons. However, there is no guarantee that 2M tons will be reached. We have seen domestic Chinese values rise which is one thing the government did not want to see. If it continues, the government still controls the kill switch and can stop flows whenever it deems necessary...regardless of the world needs.
- Middle East peace allows the market to cool - now that it looks like peace is going to hold in the Middle East, buyers will not be pressed to step forward to buy. That push is no longer in place so folks can wait. The longer buyers wait, the more unsold inventories build. The more unsold inventories build, the more pressure manufacturers feel. If that pressure gets big enough, they lower prices to find buyers.
- Falling grain prices keep buyers at bay - this is, unfortunately, actively happening in the markets. Farmers were already struggling with profitability this year (I mean, why would a farmer who spends his/her life killing themselves to grow a crop expect to get paid...). If prices would hold, at least the bleeding would stop. If prices continue to fall, buyers will simply not be able to afford their fertilizer inputs. If this happens across enough farmers, it could cause prices to fall to bring that demand back. Wish we didn't have to consider something this poor, but here we are.
- Peace between Ukraine/Russia allows European production to resume - this is a long shot and likely not a short term factor, but worth considering. Now that Israel/Iran have stopped fighting, President Trump can turn his attention to the Ukraine/Russia conflict. If he can broker peace there, that will be a major step toward normal relations once again. If those relations can normalize, Russia can begin repairs on the Nordstream pipeline which would finally cause European gas values to fall. If all of that happens, we could see the final 25% of European nitrogen production that is still offline come back.
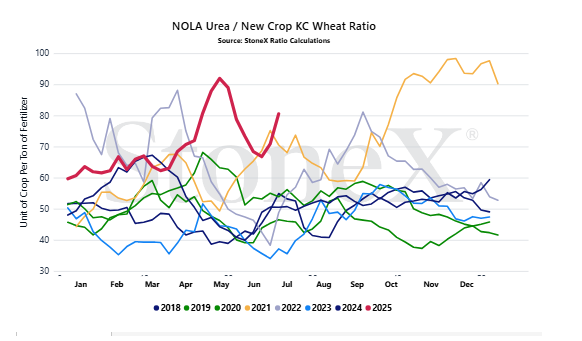
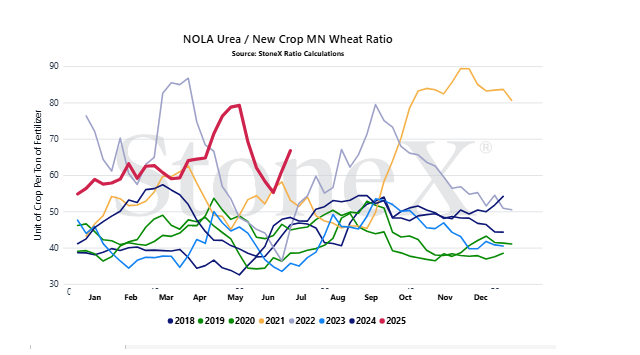
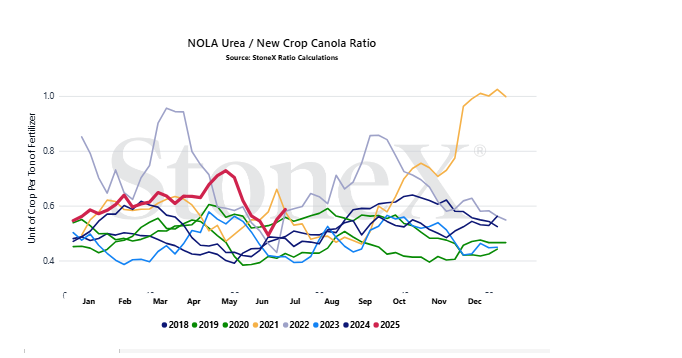
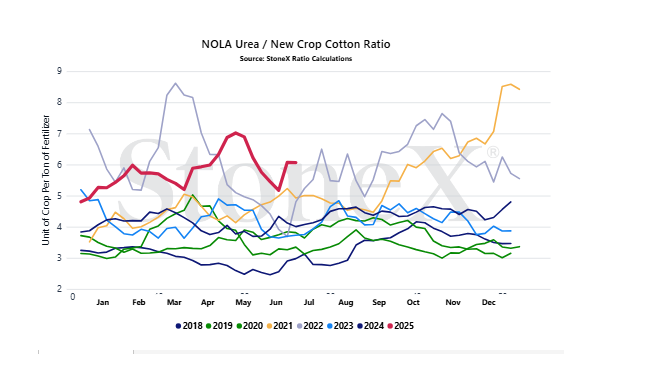
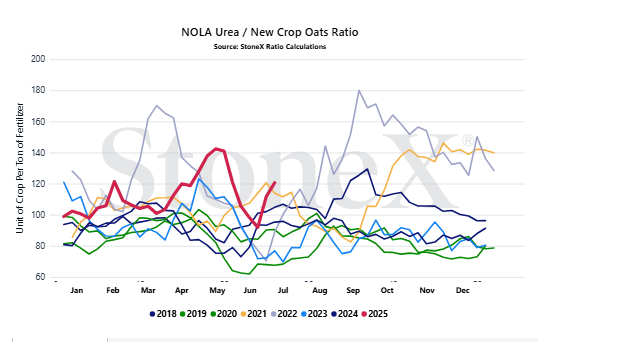
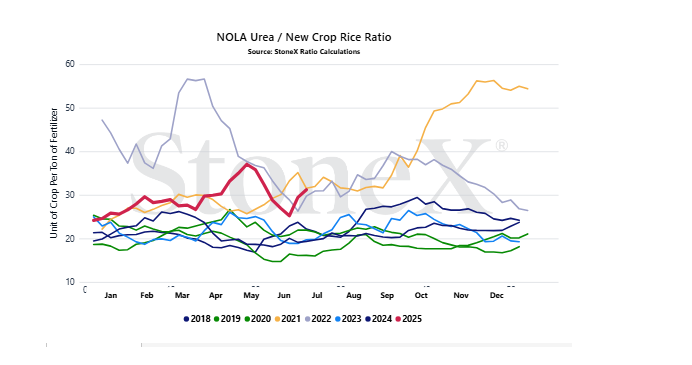
We believe that only looking at the flat price of either grains or fertilizer can be misleading:
- Only selling grain can hurt you if fertilizer prices rise substantially
- Only buying fertilizer can hurt you if grain prices fall
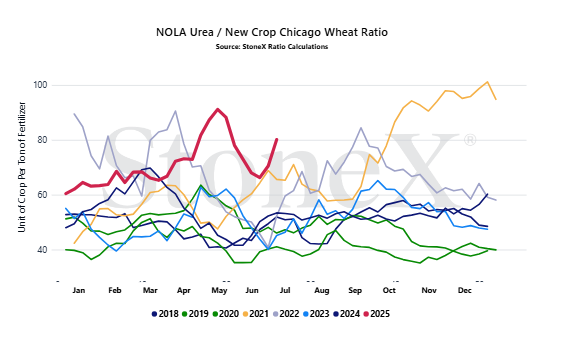
We look at the ratio "value" to get a better indication of where we are or how many bushels of X does it take to pay for 1 ton of fertilizer.
Would you rather:
- Spend 135 bushels to pay for 1 ton of urea
- Spend 55 bushels to pay for 1 ton of urea
When we compare the current ratio value against recent years, we start to see if we are high or low.
YOUR VALUES WILL LOOK DIFFERENT
This graph looks at the NOLA urea price vs the flat grain price. There are no logistics on either product. Your location will look different due to fertilizer logistical costs, grain basis, etc.
- U.S. vs Iran - all the talk of if the U.S. would strike Iranian nuclear sites is now a thing of the past. That attack has taken place and now the more important story has begun: will Iran retaliate and if they do, how? Unfortunately for global urea markets, Iran's government has voted to close the Strait of Hormuz which is incredibly important. Now, there is a big difference between voting to close it and actually being able to close it. The western world will not sit idly by and allow this to happen. It has prepared for years for exactly this outcome. Still, even the threat of attacks will likely have vessel owners considering other routes or moving their freight rates higher as a response. Also needing to be considered is how long this stalemate continues. The longer it plays out, the longer production in Iran and Egypt remains offline. With world supplies not much above world demand, every week lost will be extremely difficult to make up.
- Russia vs Ukraine - it is hard to believe that Russia continuing to invade Ukraine has become a page 2 or 3 story given world events. Still, this fight continues. The escalation in the last month was Ukraine's successful attack on a Russian nitrogen production facility. Now, we presume the reason for this attack was to shut down its nitrate production (this single plant accounted for nearly 40% of Russia's production). We all know what nitrate can do so this was strategic. While urea production wasn't likely targeted, it was still affected with the NH3 plant still down. The longer this plant takes to bring back to operations, the more production that is lost. Worse, if Ukraine starts to target other nitrogen production facilities...
- Chinese exports - how has the world become so tense that Chinese exports have drifted to the 3rd slot this month? Russian nitrogen produciton was targeted and attacked. Iran is threatening the most important body of water for urea in the world. The Chinese government was already keeping a close eye on export flows. With these situations playing out, it heightens the risk that the government will decide to stop the flows to maintain solid domestic stockpiles and values. Expecting Chinese exports at 2M tons this year (vs a normal flow of 5 to 5.5M) was already helping to buoy price ideas around the world. If China makes the decision to stop exports once again...
- Length of production downtimes - the shock of seeing Russian nitrogen production attacked and U.S./Israel/Iran going at each other has been sending global urea prices skyrocketing, and for good reason. All of these fights represent a tremendous amount of risk to nitrogen production. However, at this point, we do not know the outcomes and as a result, we do not know total production impacts. If Russia/Ukraine found peace and U.S./Israel/Iran found peace, we could see normal production rates for urea relatively quickly. Suddenly, the market would be discussing how production was lost for a few weeks rather than the shock of all the situations. Shock is an emotional response. Knowing exactly what was lost is the fundamental response. Both responses are fair, but the fundamental impact means more longer term.
- Price vs grains (i.e. farmer ability to afford nitrogen) - right now, the urea market is trading almost solely on global supply events as it should. However, it seems to be forgetting one very important aspect: farmers capability to pay these values. At the end of the day, farmers need to be able to buy these inputs and with where grain/nitrogen values are, that is a very tough pill to swallow. Now, the market will say "well, the farmer has to eventually buy their inputs if they are going to grow X". Unfortunately, they are right...to an extent. The farmer, you, can wait a long time. There is nothing pressing you to buy it today. Spring is a very long way off. If demand digs its heels in and refuses to step in, the market could be in for a rude awakening.
- Time of year - listen, there is never a "good" time to have a war. None of this is good. However, for the nitrogen markets, this couldn't be happening at a better time. This is the time of year when demand typically falls away and values hit their seasonal lows. That should help lessen the price impact to a point. Imagine if all of this was happening in January/February right before the start of Northern Hemisphere spring demand.
- India purchase tender approaches - the most shocking thing on this list is that I have dropped India to the very bottom. That is how haywire these markets are. Still, we need to watch them as they will be setting the price tone. They have just "failed" their 4th purchase tender in a row (falling far short of their purchase tonnage goal). It is incredibly likely that they will be forced to announce yet another purchase tender that feasibly could see them targeting 2+M tons. If global events continue to set the market higher, the India purchase tender could prove it true.
StoneX Ratio Calculation
The ratio calculation is derived from Bloomberg historical grains values as well as fertilizer values from StoneX, NPKFAS, and Argus.
The calculation is simply dividing the fertilizer price by each grain price.
All data was sourced from StoneX unless otherwise noted.




