We write a brief monthly analysis of the LBMA's daily trading volumes in the spot, forward, lease and options markets for gold, silver, platinum and palladium; the figures, when set against market background and economic and financial forces, can be very revealing.
LBMA Precious Metals market volumes, April 2025, and their significance
Rhona O’Connell, StoneX Financial Ltd; 9 May 2025
Any views expressed here are of the writer and do not reflect a house view from NASDAQ.
Gold hits a new record in real as well as nominal terms. The high may well be in.
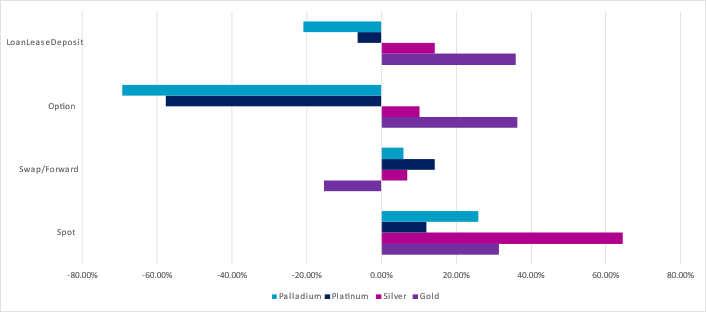
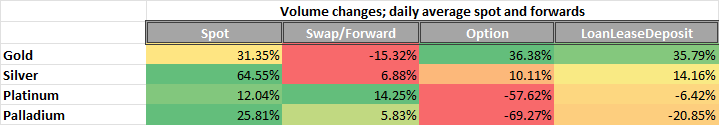
Daily April average compared with daily average for the previous twelve months.
Source: LBMA
Source: LBMA
Welcome to our monthly round-up of the LBMA OTC trading volumes in gold, silver, platinum and palladium, as recorded on a daily basis by the Association. These are split into spot, swap/forward, options and LoanLeaseDeposit (LLD) and give a flavour of the markets’ activity and how they were influenced by external forces and news items.
All references to COMEX or NYMEX positioning refer to Managed Money, not commercial positions.
General introduction: -
Tariffs, tariffs, tariffs… and continued uncertainty
This was our opening paragraph last month:
“The markets have been bound up with the merry-go-round of US international tariffs, with the result that gold prices have been buoyed by international tensions, uncertainty and concern about potential recession, while silver, platinum and palladium have been under some pressure for the same reasons. As we write this in mid-April, President Trump has suspended reciprocal tariffs for 90 days, but a baseline of 10% has been implemented almost globally. The obvious exception is China with reciprocal tariffs of 145% and 125% respectively and the polarisation between the two nations’ leaders is currently showing little sign of abatement.”
Now there are signs of change, although there is still a lack of clarity and the 90-day pause doesn’t end until early July. But a deal of sorts has been struck with the UK and, more significantly, talks are due to start between the US and China in Switzerland this weekend (10/11 May), with the Trade Secretary Scott Bessent leading the US delegation. He is talking in terms of “de-escalation” for the first phase, so at least things are showing some signs of progress.
Source: NASDAQ
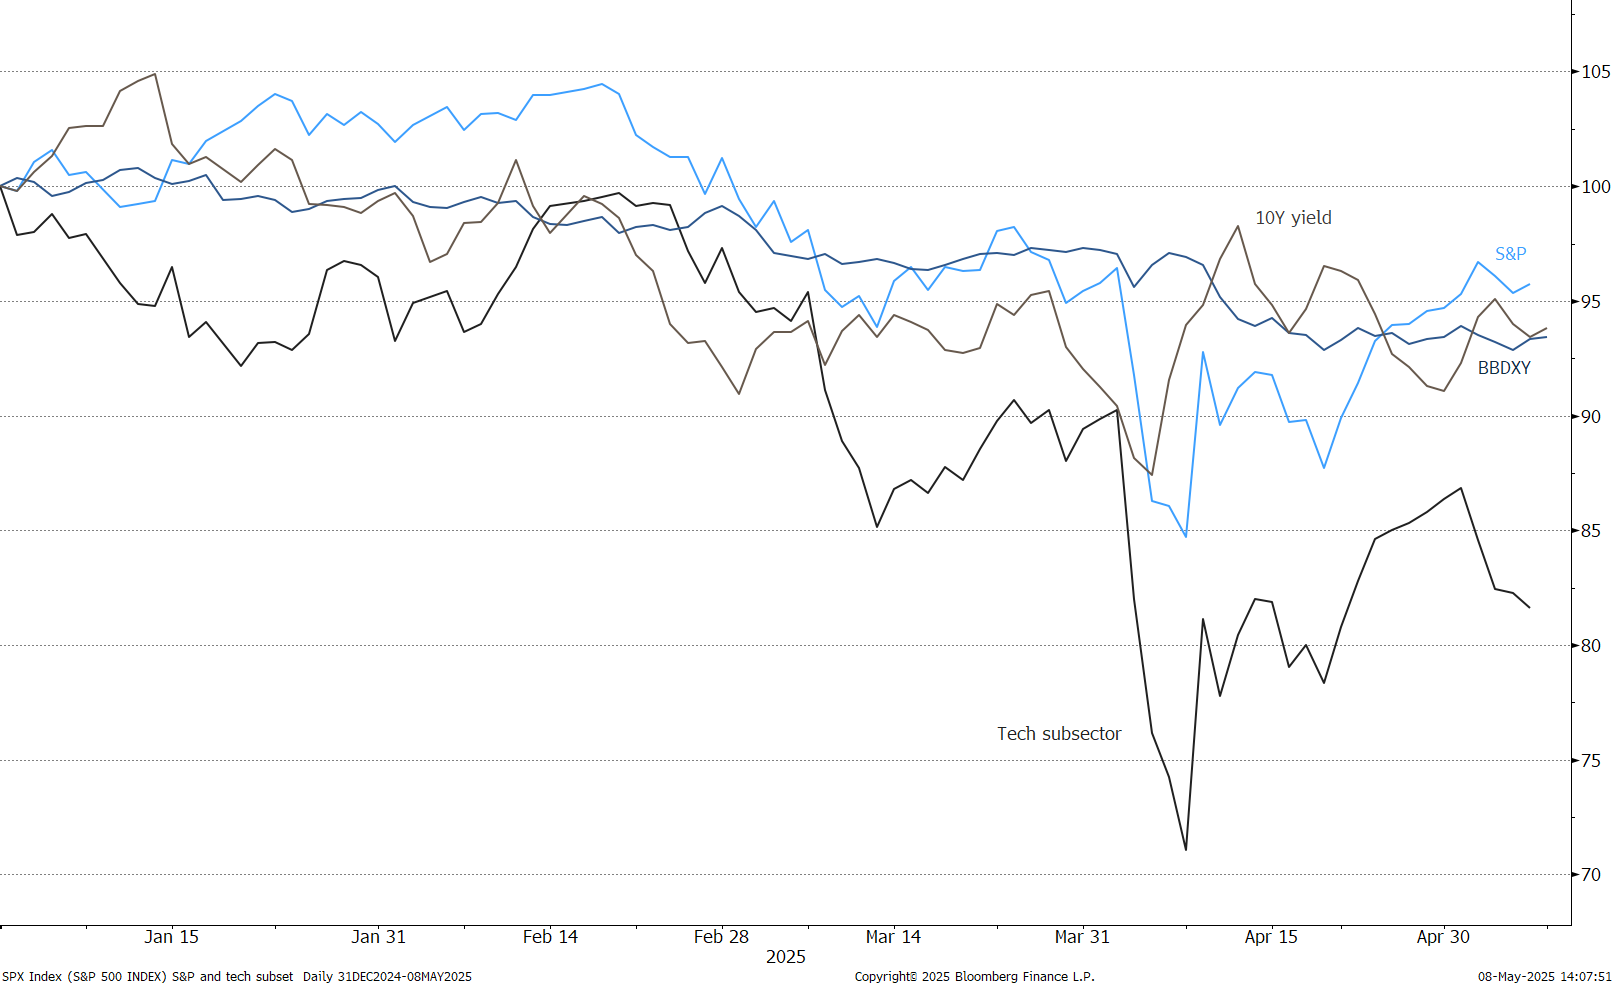
All of which, for now at least, has taken some of the heat out of the gold market which by late April was over-exposed, over-crowded and over-bought. Silver and the PGMs remain stressed, however, with continued concern over the economic outlook and the real risk of stagflation in the States, Europe on a knife-edge and consumer confidence still low in China, which is undermining the auto sector. In early May a number of auto companies have either reduced or suspended their earnings guidance because of the economic and geopolitical background.
The dollar, 10-year yield, S&P and the Tech sub-sector
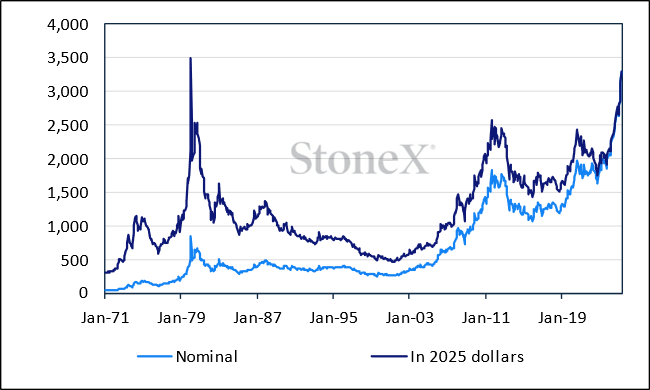
A new record for gold, in real and nominal terms
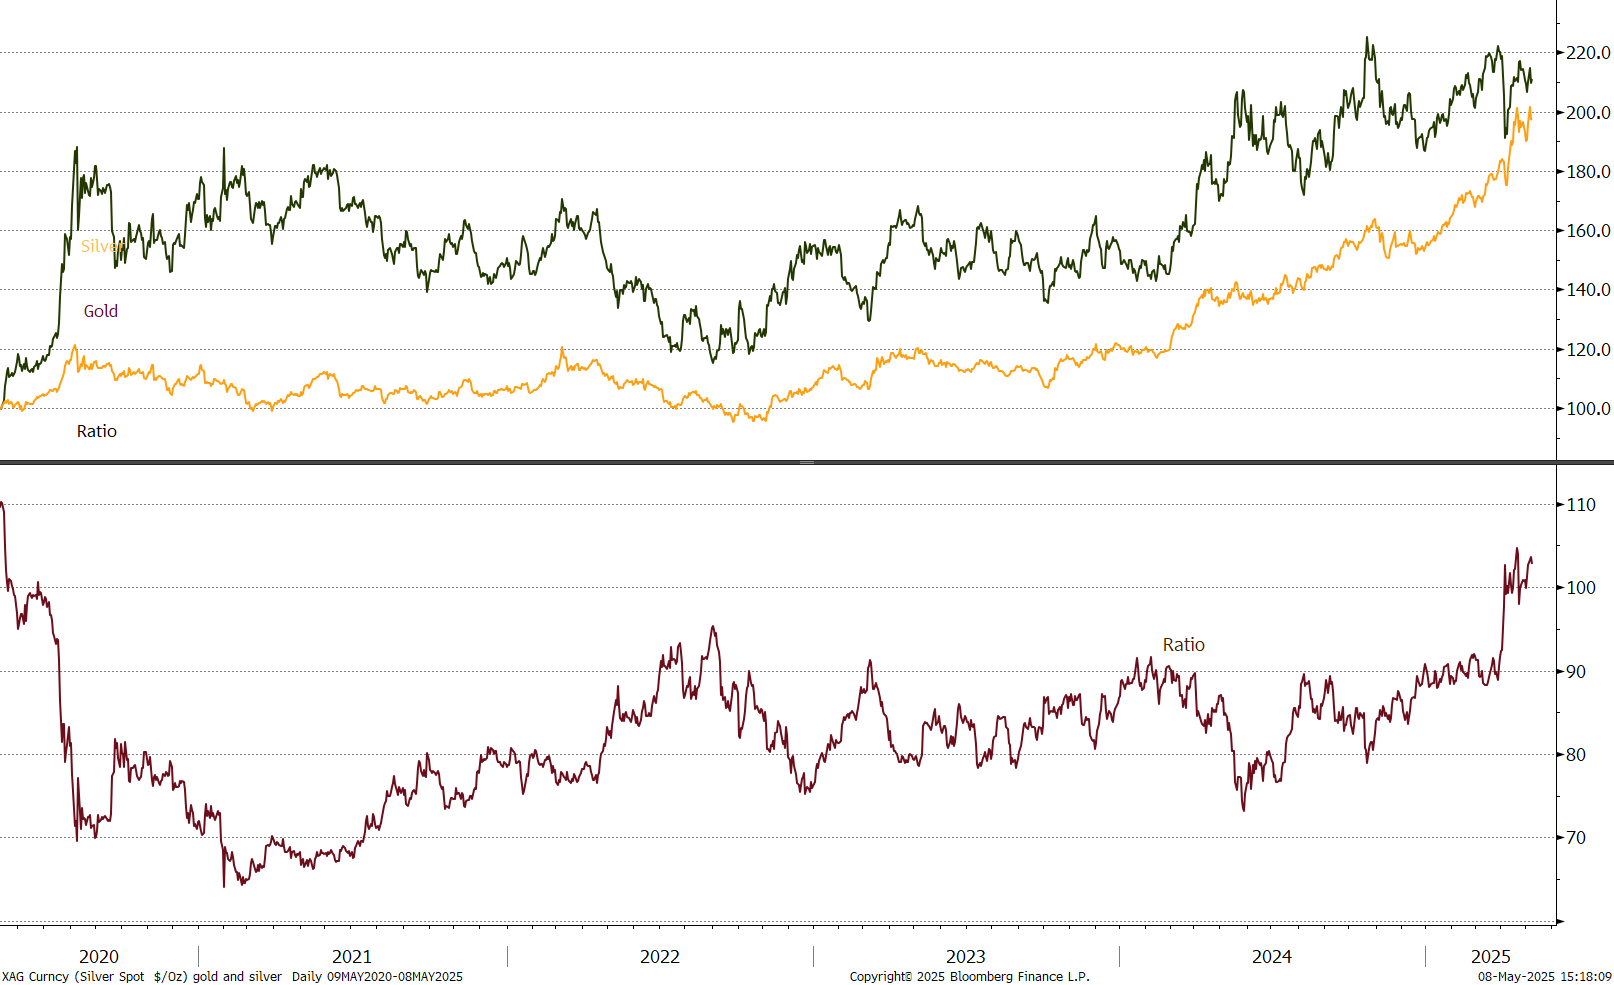
On 22nd April, just before the London bullion market opened and towards the end of Asian trading hours, spot gold hit a high of $3,500.10. The significance of this is two-fold. From a fundamental standpoint it is important because this is a new record in real terms (i.e. accounting for the US CPI). The high of 21st January 1980 of $850 was posted after gold’s exponential rise on the back of the Hunt Brothers’ failed attempt to corner silver plus the Iran hostage crisis, the start of the Afghan / Soviet war plus the second oil crisis. If this price is inflated via the US CPI into 2025 dollars, that price translates to $3,486. So we have now posted a new high in real terms and it is certainly arguable that gold’s price may have peaked, given the length of time and intensity of economic and geopolitical uncertainties that it has had to deal with.
Spot gold in nominal and real terms (deflator; US CPI)
The second, and secondary, point of significance is that the London gold market had been closed on the previous day (Easter Monday) and this led to heavy flows on the 22nd and unsurprisingly this was the heaviest day of the month, with spot turnover of 53.2M ounces (1,709t). That said, the spot turnover the previous Thursday was just 1% lower than the Tuesday. The middle of the month, from the 4th right through to the 23rd, saw heavy volume in spot and LLD as sentiment became increasingly feverish and funds came out of equities (especially the tech sector) and ETFs in the search for safe havens, embellished by FOMO activity and boosted to an extent by Fed Chair Jay Powell’s insistence on Fed independence. Tied in with all this, of course, and further boosting gold, was the weakness in the dollar. The LLD numbers would tend to back up anecdotal evidence of some hedging activity from the mining sector.
The volatility in prices in mid-month (spot gained 18% between the $2,957 low on the 7th and the high on the 22nd) cramped activity in the options market, although activity picked up in mid-month as gold pushed through$3,200 and this suggests that the $3,300 and $3,400 strikes were in play – and indeed it could well be that some delta hedging against that level (and above) helped to accelerate the move to the highs. Volumes tailed off across the board in the final days of the month.
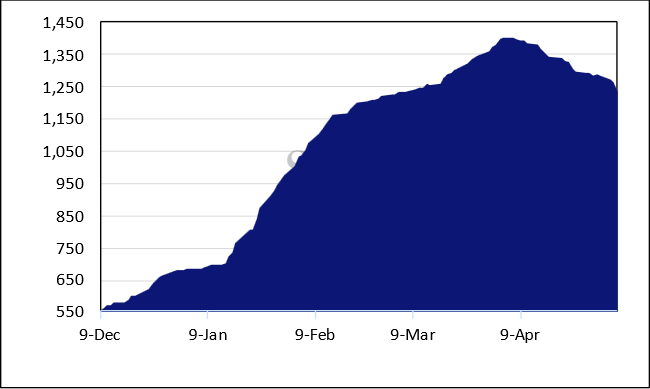
Meanwhile the absence of gold and silver from the initial tariff announcement on 3rd April saw the gold inventories top out on COMEX on the 4th. Having generally been in the region of 550t for much of 2024, gold inventories peaked at 1,402t and by end-April they were down to 1,287t (and shed a further 53t in the following week).
GOLD on COMEX, tonnes
Meanwhile this drop in inventories (net 75t over the month) was accompanied by a 168t contraction in Managed Money longs and a 55t drop in shorts, taking the net long from 442t to 329t.
Exchange Traded Funds added 115t in April to reach 3,561t, just a few tonnes shy of annual global mine production. Asian investment continued its rapid expansion, accounting for 69.6t of net inflows while North America added 44.2t and Europe lost just under one tonne. At month-end the holdings were as follows: North America, 1,828.5t; Europe, 1,341.7t; Asia, 320.4t and others, 70.1t.
SILVER
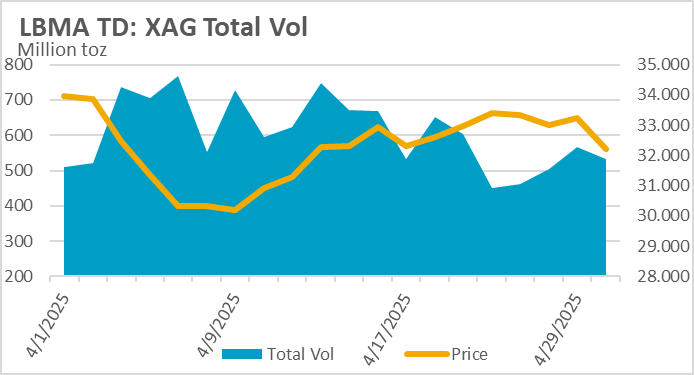
Spot silver volumes soared in April, some 65% higher than the daily average for the previous twelve months. The other sectors also posted gains, although at much more moderate rates. Silver suffered very sharp price falls in the first week, dropping by 18% in the first five days. The first couple of days were very thin but volumes picked up smartly in the drop from $34.0 to 28.4 under sizeable liquidation in response to the tariff announcements as the markets all went into near-crisis mode. Conditions reversed on the 7th, as markets started to expect a change in tariff policy.
Source: NASDAQ
As is so often the case, this reversal was in heavy volume – the second highest of the month at 18,277t as bargain hunting swept into the market, further fuelled two days later after a small correction, with the result that the $32 level was regained and then surpassed as the momentum was sustained all the way up to the high of $33.7 on both the 23rd and 24th.
This could not go on forever, however, and as spot volumes retreated sharply, prices corrected, with the month closing at $32.6.
Taken in isolation this looks like a pretty impressive performance, but concern over silver’s industrial side meant that, far from outperforming gold as it usually would in a sharp bull phase, it was the underperformer, with the gold:silver ratio blowing out to 100 by 3rd April, and staying above that level for most of the rest of the month, with a couple of corrections along the way.
Meanwhile in the background the blanket power outage suffered in Spain and Portugal at month-end was blamed in some quarters on solar dependency because the system was overloading and solar can’t be tweaked at will. The press has reported that roughly 55% of Spain power supply was solar at that point (it is more usually closer to 15%), and when the outage was triggered there was insufficient back-up resource from sources whose delivery rates can be managed (e.g. fossil, hydro or nuclear), known as “firm resources” in order to keep the grid frequency stable, although the CEO of the Spanish grid operator denied that this was the case. The issue has not been decided one way or the other as yet, and experts are still looking at whether there is an imbalance that needs to be redressed.
Gold and silver plus the ratio
ETFs: - Although silver ETFs (as recorded by Bloomberg) added metal during April, the rate of change was slower than in earlier months of the year. Funds added 697t or 5% to a total of 15,579t and a year-to-date increase of 4,975t. Global mine production, for context, was 25,497t (Silver Institute / Metals Focus numbers).
CFTC: COMEX Managed Money positions, in contrast to the Exchange Traded Funds, saw heavy liquidation of outright longs in the first half of April, which undoubtedly contributed to the slump in prices in Week One, with longs imploding with a loss of 3,611t or 38%. There was a gradual increase thereafter, however, on tentative bargain hunting that took the position to 6,804t by month-end. Partially countering the long liquidation was short covering in the first three weeks of April; fresh shorts appeared in the final week, accompanying the month-end correction in prices.
PLATINUM and PALLADIUM
In keeping with much of the rest of the industrial metals, platinum and palladium moved almost in lockstep over April as the markets absorbed the implications of the initial tariff announcement and the modification thereafter as the bond market conflagration more or less forced the President’s hand and he announced the 90-day pause – albeit with a global 10% baseline tariff (apart from China, of course).
Source: NASDAQ
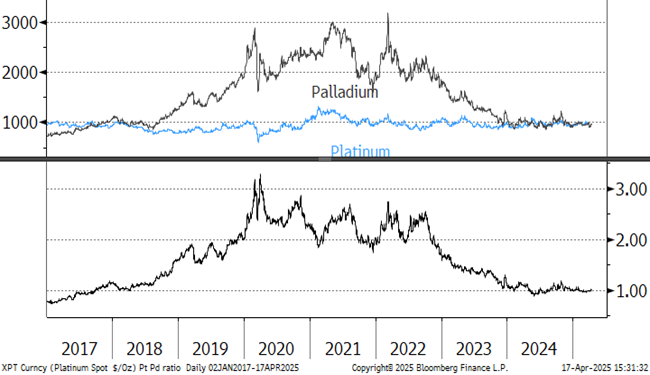
This simple line chart shows how close the relationship was (and the similarity of activity in March also).
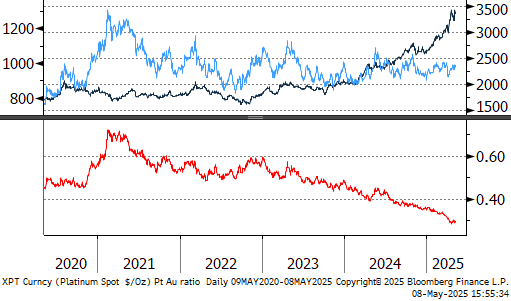
Platinum, palladium and the correlation
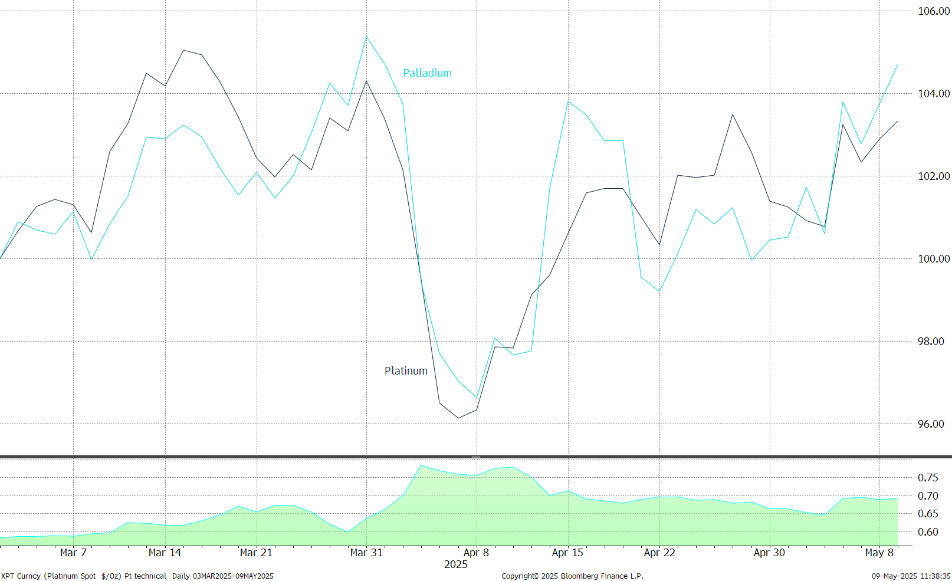
In the face of uncertain economic conditions, the relationship between platinum and palladium has been tightening although the fundamentals are slightly different, with the auto sector accounting for 42% (so far) of global platinum industrial fabrication and 84% of that of palladium. The other key difference is the jewellery market, which accounts for 26% of platinum demand (and rising as it captures market share from gold) and just 2% of the palladium market – unlike 30-plus years ago when the Chinese palladium jewellery market was thriving. In March the average correlation between platinum and palladium was 0.62. In April it tightened to 0.71. The average over 2020-2024 inclusive was 0.58.
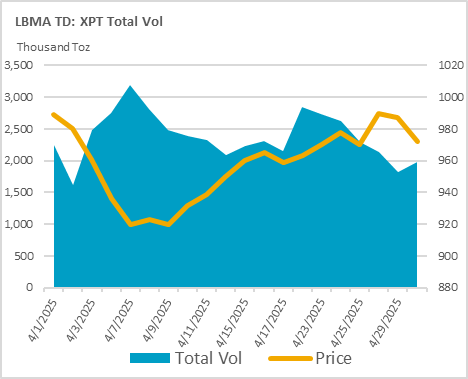
Platinum swaps / forwards and options were below the daily average for the previous twelve months, at -58% and -6% respectively. Spot volumes were up by 14%. Volumes were reasonable in the first week as prices dropped by 10% from $1,000 to $899 and then, as frequently happens, picked up smartly on the reversal day (just before the President announced the postponement of tariff plans) that launched a bull phase that lasted until just before month-end.
That same day, with platinum testing $900, saw heavy activity in LLD and heightened action in options, suggesting that there may have been some industrial bargain hunting, while at the other end of the market, heavy volumes in LLD on the approach to $1,000 may have seen some further pricing activity.
There were two very strong days for swaps/forwards on 22nd and 24th, either side of a million ounces. This looks like some opportunistic activity the $980 level was putting up repeated resistance (and may have contributed to the stalling in the rally) although this gave way before month-end to trigger a (failed) test of $1,000. This looks like short-covering activity after $960 support had held good, as the CFTC numbers illustrate.
Platinum, gold and the ratio
Platinum, palladium and the ratio, January 2017 to date
Source: Bloomberg, StoneX
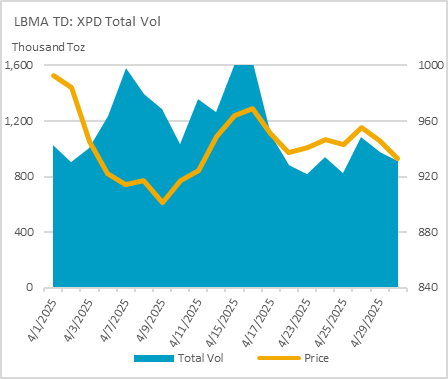
Palladium volume patterns were different from those of platinum even though the price profiles were similar. What they did have in common was high spot volume on the 7th, as the drop in prices was arrested and prompted a rally. Prior to that, though, the start of April saw what turned out to be the highest LLD volume of the month, suggesting possible hedging activity volume day of the month as prices approached $1,000, which suggests some inventory management or reduction.
Spot volumes picked up in the middle of the month as prices rallied from $914 to a high of $983 and it was at the end of this rally at $960 and above that heavy swaps / forward volumes kicked in, which may have helped to quell the advance.
It is interesting to note that the other three heavy LLD volumes came at the bottom, the top and the final bullish reversal, underpinning the $900 -$1,000 range and very probably defining it also.
ETFs
Platinum: Very narrow fluctuations over the month between 99.7t at the start of April and 98.8t a week later. From a total of 22 trading days, 13 were net creations and the month finished at 99.0t. Meanwhile after the pre-tariff inventory build on NYMEX, exchange stocks having been coming down again, from a high of 19.6t to 13.9t at end-April. Average inventories in 2024 were 5.5t.
Palladium: Also, very narrow fluctuations between 23.9t at the end of this week and 22.8t mid-month. Only six days of net creations and the month closed at 23.1t. NYMEX inventories only changed rarely, easing from 2.45t to 1.74t.
CFTC
Platinum: initially the market saw heavy long liquidation, but this reversed into bargain hunting with outright longs opening at 50.6t, dropping to 39.3t in a week and then creeping higher to 44.6t. The mood was reflected on the short side with a jump from 47t to 62t in the first week, then steady reduction to 48t leaving the net short at 4.4t.
Palladium: in contrast to platinum, bearish tone over the month with long liquidation in the first three weeks, especially in mid-month as prices were testing upside resistance. Outright longs dropped from 4,923t to 2,451t before a mild recovery at month end. Outright shorts also contracted before a mild expansion in the final week leaving the net position at a short of 42.8t.
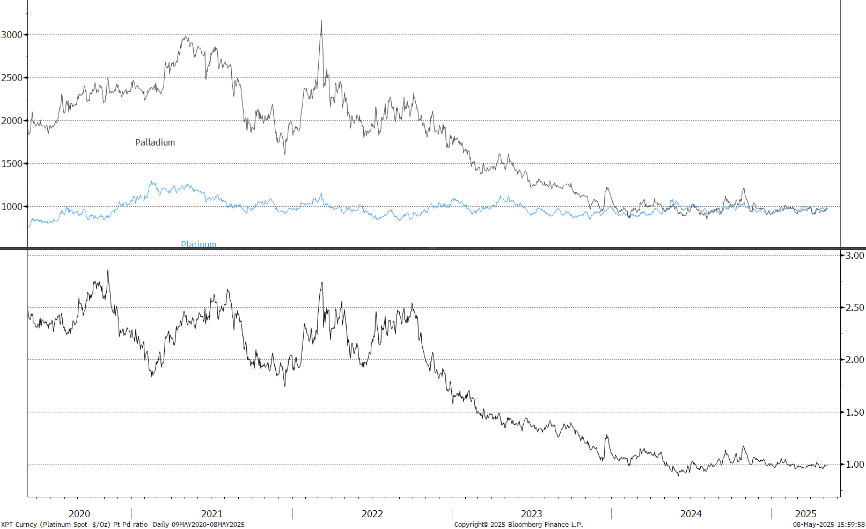
Spot platinum, palladium and the spread, January 2017 to date
Source: Bloomberg, StoneX