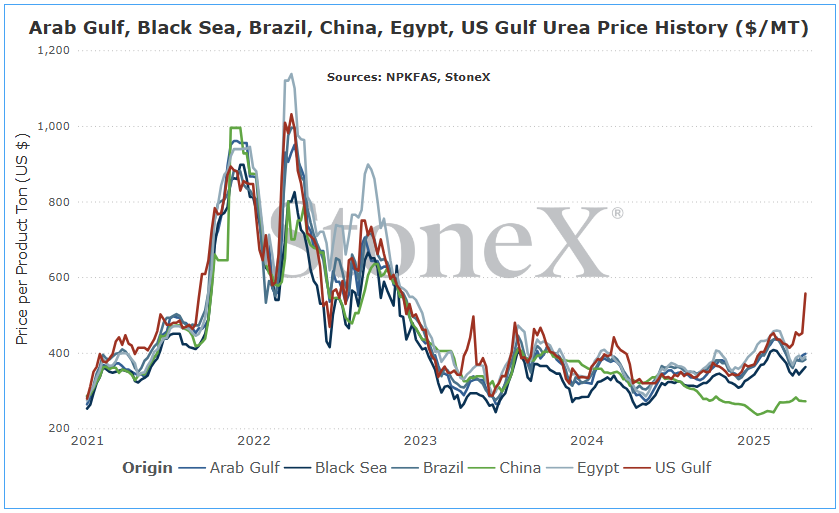
The intention of the below graphs are not to use to say "my price should be X based on this graph". These prices are derived from an FOB price point average. The intent is to show major global price movement trends. Your values will likely have significant basis difference (similar to your local grain price being different than the traded market price).
This graph is labeled as MT in USD currency.
- European nations started to push hard toward green energy in the face of typical Russian supplied natural gas
- Russia continued to push for Nordstream 2 pipeline to increase flows to the region while nations were pushing back
- Eventually, that tension started to rise faster with the fear of Russia invading Ukraine
- That came to a head with shipments through the pipelines being stopped
- Someone ultimately attacked the pipeline underwater, causing damage that not only kept shipments at zero but made sure they couldn't return short term
- Dutch TTF (the European natural gas market we track most closely) skyrocketed from its normal $4 - $6MMbtu to a high of $103MMbtu in August 2021.
- European nitrogen fertilizer production ground to a halt as high inputs costs made production highly unprofitable
- Dutch TTF values would later fall back closer to normal price ranges as the world market shifted to backfill the supply that was missing
- Values dipped to as low as $7MMbtu, but nitrogen fertilizer production never improved from 75% of normal
And that brings us to today and today is relatively unchanged.
Current Dutch TTF values continue to trade in the low teens which is significantly lower than the worst values seen, but still well above normal costs of production. The question today is not "when will production return to 100%" but "will production ever return to 100%".
From a gas perspective, that depends on tensions with Russia. For now, Russia likely sees absolutely no reason to start making repairs to the pipeline. Tensions remain high with European nations. However, even if a peace agreement was reached where Russia removed its forces from Ukraine, those relations need to be rebuilt to a place of mutual trust. Once that is reached, European nations would need to "want" the gas supplies to return. If that happened, work could start to repair the pipeline. Only then could we start to see gas values return to a low enough normal price that the 25% of nitrogen production that is currently offline might start to reconsider restarting.
...but can those plants actually restart?
A lot of the plants based in Europe are old. No doubt, efforts have been in place to maintain the facilities to a readiness state, but that is easier said than done. Not only do they need to consider the age of the plant, they also have to consider the future of European countries politics which have ebbed toward green technologies and away from "dirty/old" technologies. Even if gas prices returned to normal, they may face an uphill battle at home.
Ultimately, this continues to make Europe a global buyer where they largely were not before. We continue to see a lot of purchasing happening out of places like North Africa. This increased demand makes it easier for North African manufacturers to boost prices/keep prices high. Other manufacturers around the world see this happening and try to piggy-back to keep their prices/margins high.
From an Econ 101 perspective: supplies lower + demand bigger = prices higher
As long as European production remains around 75% (help us if it lowers...), it helps to raise the global price floor. It doesn't mean prices cannot ebb and flow up and down, but it does keep prices from falling as much as they normally would.
Like China, this matters to everyone.
Europe produces a lot of tons per year. When you remove 3 - 3.5M tons per year, that demand doesn't disappear. Rather, it is forced into the global arena to try and find other supplies. That means having to displace buyers that usually bought from there. Then the dominos start to fall.
The end result is higher prices for everyone.
- December 19, 2024 purchase tender
- 1.5M ton purchase goal
- 187K tons secured
- January 23, 2025 purchase tender
- 1.5M ton purchase goal
- 558,900 tons secured
The global market was in a tizzy as February started (myself included) as the belief was that they would have to return immediately and cause them to compete with the rest of the world who was preparing for spring needs. However, mid-February came and went with no announcement. Then late February/early March with no announcement.
It wasn't until March 26 that we finally saw them return. Once again, their purchase goal was 1.5M tons but with shipment windows going well into June, excitement was much more mute.
By the end of it, we found out that they did better this round:
- 884,650 tons secured
More important was when they would return. A quick tender announcement would likely have global manufacturers/suppliers smelling blood in the water and would likely cause prices to rally. That ended up not being the case. Once concluded, the market belief organized around a late May/early June return which would give the world several weeks of quietness.
And that is where the world sits today.
There have been some smaller sales made from North African manufacturers going to Europe to fill in the last remaining pieces of spring demand. Now, as N.A. values skyrocket, larger vessel volumes are being sold for nearby shipments in an effort to arrive before spring concludes. That will also help buoy price ideas short term...but they need help.
Other regions around the world have gone quiet, and historically speaking fertilizer does not do well with quiet periods. Without constant demand to boost confidence, prices typically start to fall. We have not seen this yet, but it is high on our watch list. While supply tightness due to Europe and China will boost the price floor, that doesn't mean a price floor doesn't exist.
What does this mean for farmers?
Since this didn't have a big impact on global prices, it really shouldn't mean a lot to farmers. However, if it happens under the right circumstance that causes prices to rally, that will matter. Those higher costs gets pushed to the end user. Congratulations, that's you...
Under perfect conditions, this could actually mess up our seasonal low patterns. Usually, as we move into later Q2/early Q3, we hit annual lows. The confidence that this happens allows buyers to step in and the market to be healthy (steady to higher which rewards early participants and allows tons to flow constantly). However, if the market remains steady to firm from today, that confidence to buy likely will not be there. That would create a lot more price volatility as we move forward. That can breed opportunity, but also risk.
With global values having fallen in the last month and likely looking weak for April, that will pressure price ideas along the coastlines...but the further to the interior you get, the harder it will be for these cheaper tons to arrive in time.
I would expect to see price ideas in places like NOLA continue weaker thru April, but those lower prices may take more time to arrive further inland. Might be a sidedress relief.
So, that sure didn't happen...when I wrote that, NOLA urea values were floating in the upper $300's. Preplant spring was rolling along with few issues. It seems that NH3 was doing its job and doing it well of soaking up N demand. Sure, corn acre forecasts had risen but when spread over the 3 major products (urea/UAN/NH3), a million additional acres is not a massive boost. As I write this, multiple physical NOLA urea barges have traded $470.
So what changed? Well, from my POV, one of our bullish points were triggered from the April edition:
- N.A. markets struggle with NH3 application/UAN supplies - there is a lot of nitrogen demand for the spring 2025 N.A. season. This is especially seen with U.S. corn acres continuing to rise. Now, if all 3 nitrogen products are decently supplied, then the boost to nitrogen demand for each isn't massive. However, if a larger area struggles with spring NH3 application, that can push a massive amount of nitrogen demand to urea. We are also watching/worried about UAN supplies with more production issues. This can also shove a lot of new nitrogen demand to urea which it wasn't expecting. Either of those happen, do not be surprised to see inventories tight and prices higher.
We have been talking a lot about possible N demand switching in the month's leading up to today. This was especially true on UAN. Inventories are incredibly tight to the point I sent the mid-month update talking about it. My hope is that the mid-month update spurred at least some of you to have a conversation that ultimately ended with you locking up your needs. If so, those are looking pretty good today.
However, I underestimated the UAN situation. We knew supplies were tight but had no idea what was coming. I've been in the industry for 23 years now and I've never seen anything like this. I've asked other folks in the industry with more experience and they shared my POV. This is a first time event, and it is causing changes.
While not every region/retailer/farmer can easily switch between urea and UAN, where they can it sounds like they have been in a big way. Not only is urea more easily accessible (for the moment but that appears to be changing fast), it is cheaper on a price per pound of actual N basis. I'm not sure how you handle your farming operation but if I can find another source that does the same thing for less, I'm taking a hard look!
The end result is that urea prices have jumped huge and have continued massive price volatility for 2025 for NOLA urea:
- Start of the year - $330
- mid-February - $415
- Late-March - $365
- Today - $470 with questions of if/when we hit $500
That is over $240 worth of price movement for the first third of the year...and I wonder why my hair is grey and thin!
The market is trying to fix the situation, though the calendar is working against it. A typical sail time for a vessel originating in the Middle East is around 4 weeks. Simply put, it will take too long for most vessels to arrive in time to meet demand. However, it is only 2 - 3 weeks for North Africa. That has a fighting chance, and we have been seeing/hearing that vessels are being sold. While a destination isn't attached, it is hard to see it going anywhere but North America.
This will not last forever. Eventually spring demand will give way to summer lull's...but the spring demand still has a lot of life left in it.
As I always say: keep talking to your retailer to figure out how the area stands where you are.
What does this mean for farmers?
For North American farmers, higher replacement costs means higher cost to the farmer.
End story.
What could have been - a N.A. corn/urea ratio story
If you have been on this for a while, you know I try to stay away from the soapbox.
Not today.
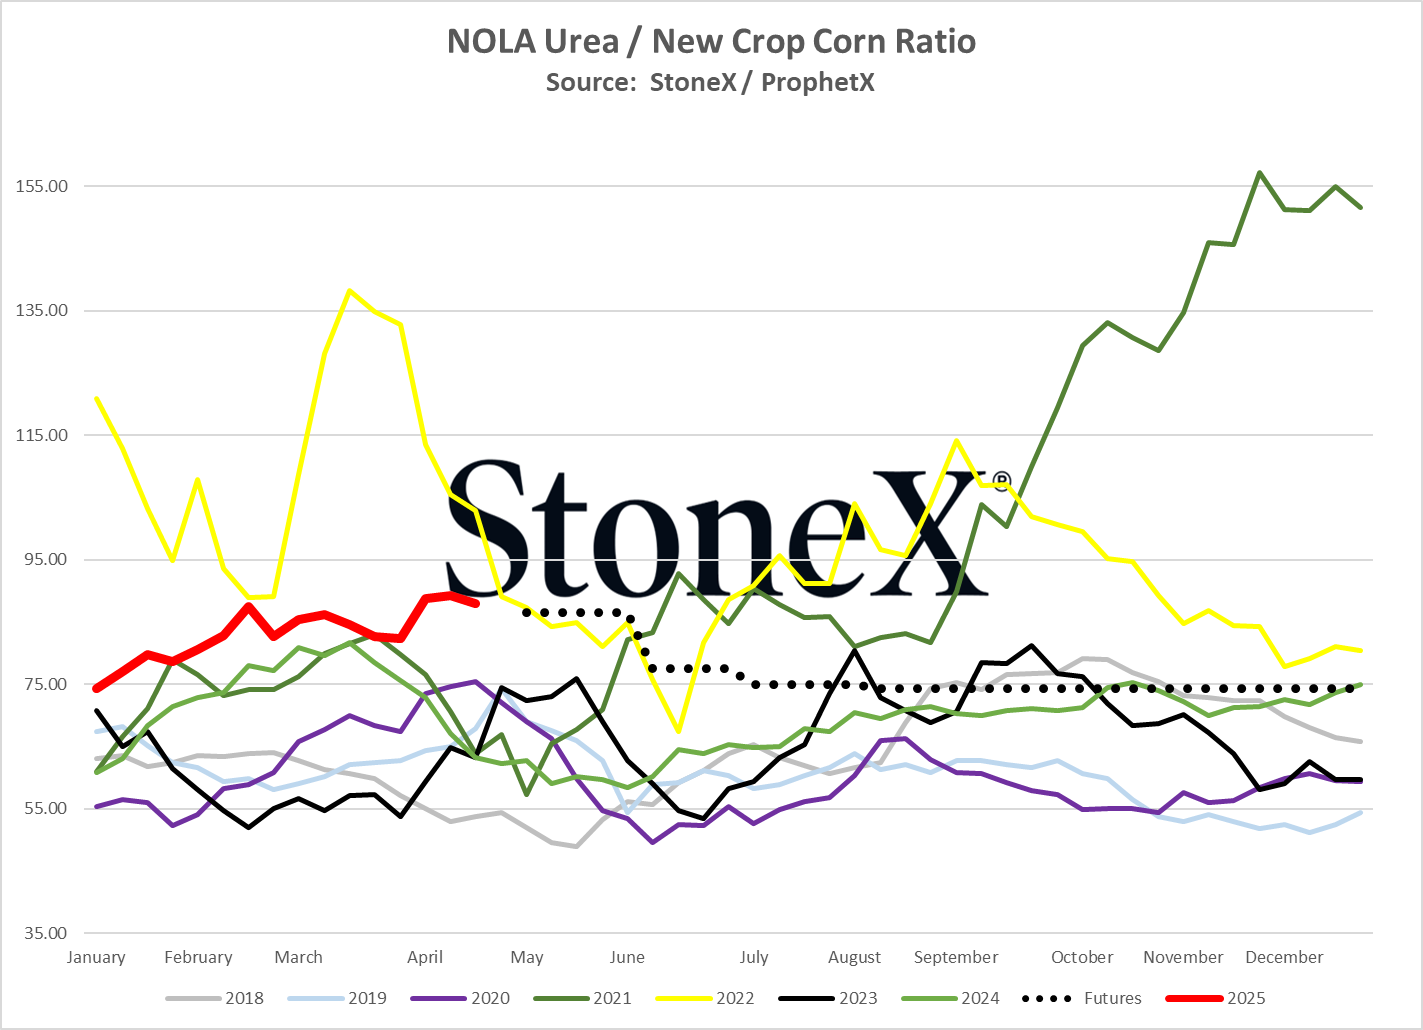
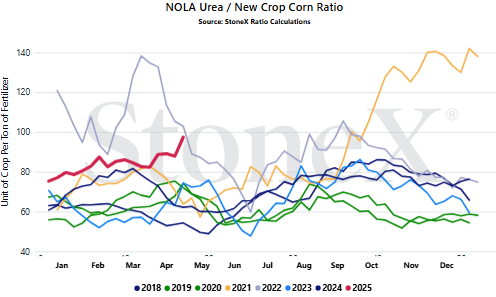
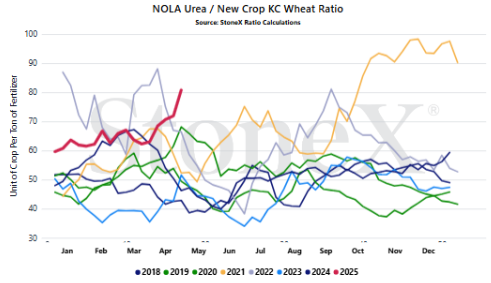
Today's urea/corn ratios are insanely high and getting worse:
- NOLA urea is trading $470 today
- December '25 corn is trading $4.54/bushel
That means that under those values, it is taking 103 bushels of corn to pay for one ton of urea. Without looking at the past, it is hard to know if that ratio value is high or low. The below graph shows it is high...very high.
I know I've preached the ratio approach before so for some of you, this may be old news. Bear with me.
From my perspective, flat prices can mislead us. I've rarely ever seen someone say that corn prices are solid. Typically, the response is that they should be higher. Same for fertilizers. Regardless of how high/low the price is, we think it should be lower.
There is NOTHING wrong with that. That is human nature. That is your job to try and get it just a little better. I'm not criticizing anyone.
However, that can cause us to miss opportunities.
Rather than focusing on just the price, I try to look at the value. Farming at its core is not much different from manufacturing. It is all about inputs and outputs. Factories may look at their plastic/steel/etc. costs in terms of inputs and then compare that against their outputs. During my presentations, I sometimes like to ask the question "would you rather spend more or less bushels for your fertilizer?". To this day, everyone I have asked has answered correctly. "I would rather spend less bushels".
Regardless of what the prices of either are, everyone still answers "I would rather spend less bushels". That is where I come from. Ultimately, farming is about keeping as many bushels as possible to market later.
Now, I know I would MUCH rather see corn prices be $8 and fertilizer be free...but we rarely get what we want!!!
Today, there is no way to look at the ratio and think it is good. 103 is exceptionally high...but was there a chance this year?
When you look at the red line on the chart below...not really. We started 2025 at 75 bushels per ton of urea and got worse from there. However, now look at the black line. If you trace it back to June/July, it dips to under 55 bushels per ton of urea. Regardless of what our POV was surrounding forward price trends for both urea and corn, that value was undeniable.
Some might be saying "sure Josh, why don't you try selling a crop that far in advance". I know. Trust me, I hear it from my family! However, that is why those opportunities exist. So few people are willing to participate that the market is begging for demand and it does that with cheap values/solid opportunities.
Last thing: your local graph will look different than the one below. When you sell corn, do you expect to see Chicago prices? No, because basis exists. Sometimes it works for you, more times it works against you. Same for fertilizer. You are likely not seeing NOLA values. This is why it is important to have this conversation locally. My graph gives you a directional look. Your local graph gives you an actionable look.
This is not meant to beat anyone up for dragging their feet. I cannot begin to try to comprehend everything that needs to be considered. I merely bring this forward so when it happens again in the future, we are ready for it.
What does this mean for farmers?
NOLA/New Orleans, Louisiana
Number 3 global importer in 2022
Price comparisons
Vs 30 days ago - 32% or approximately $122 higher
Vs 90 days ago - 32% or approximately $123 higher
Vs 6 months ago - 55% or approximately $180 higher
Vs 1 year ago - 68% or approximately $205 higher
U.S. Midwest Average
Vs 30 days ago - 19% or approximately $89 higher
Vs 90 days ago - 24% or approximately $107 higher
Vs 6 months ago - 41% or approximately $158 higher
Vs 1 year ago - 39% or approximately $154 higher
U.S. Southern Plains Average
Vs 30 days ago - 16% or approximately $73 higher
Vs 90 days ago - 19% or approximately $83 higher
Vs 6 months ago - 36% or approximately $140 higher
Vs 1 year ago - 27% or approximately $113 higher
U.S. Northern Plains Average
Vs 30 days ago - 20% or approximately $89 higher
Vs 90 days ago - 16% or approximately $75 higher
Vs 6 months ago - 42% or approximately $161 higher
Vs 1 year ago - 33% or approximately $135 higher
Middle East
Number 1 exporter (as a region, not as individual nations)

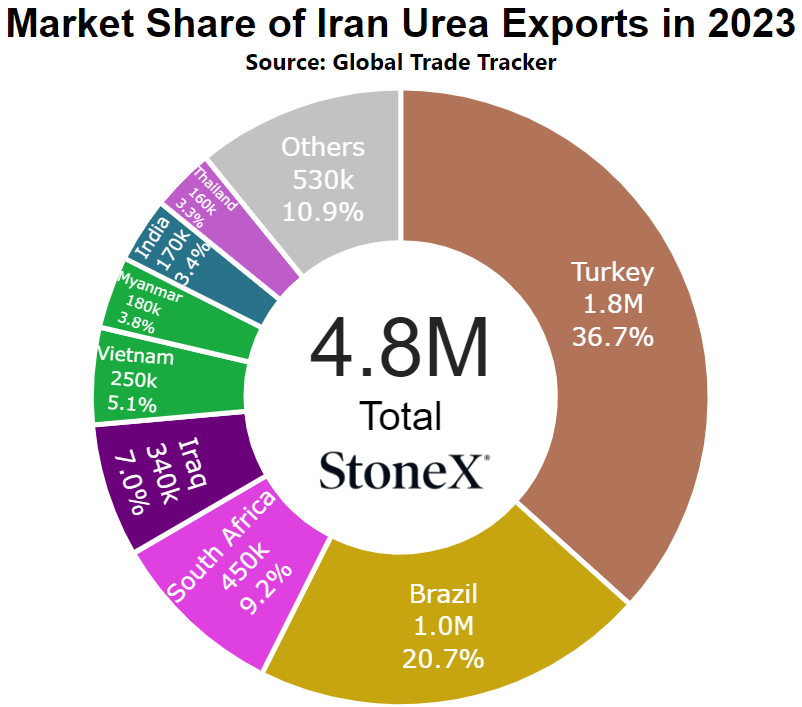
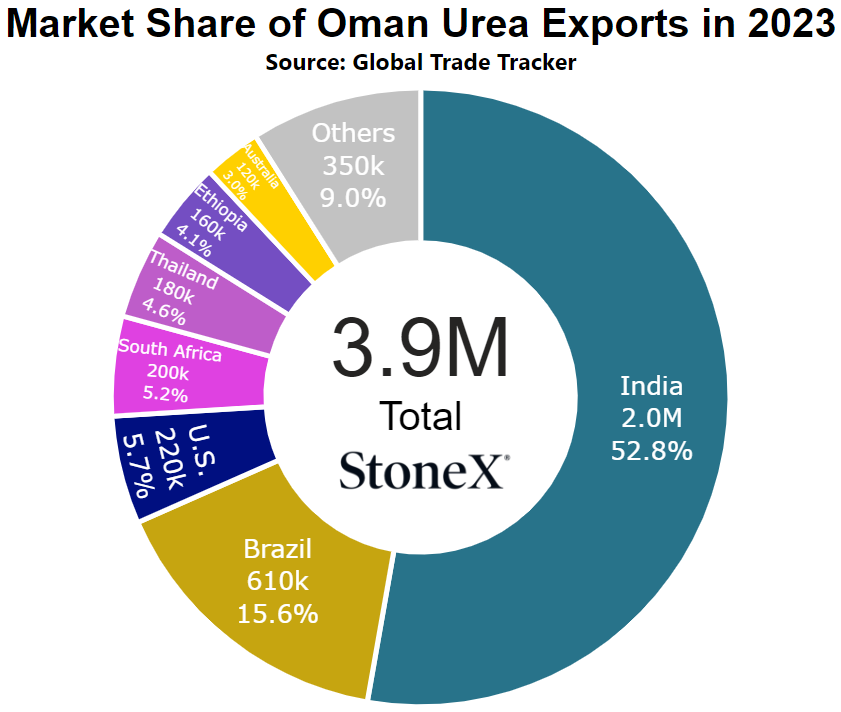
Vs 30 days ago - 10% or approximately $35 higher
Vs 90 days ago - -4% or approximately $15 lower
Vs 6 months ago - 5% or approximately $18 higher
Vs 1 year ago - 37% or approximately $108 higher
Egypt
Number 4 global exporter in 2022
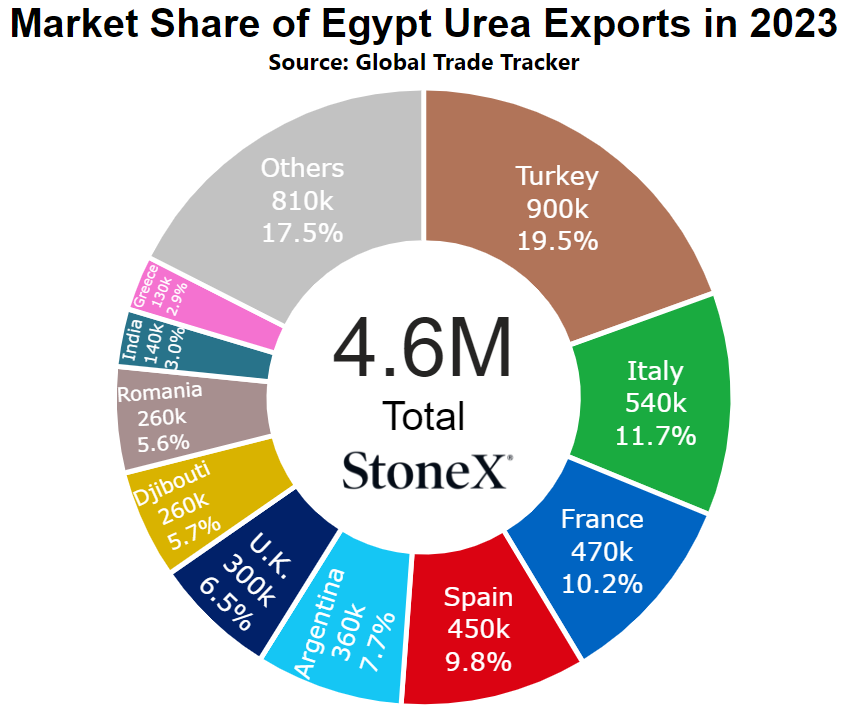
Price comparisons
Vs 30 days ago - 6% or approximately $22 higher
Vs 90 days ago - -10% or approximately $44 lower
Vs 6 months ago - -1% or approximately $3 lower
Vs 1 year ago - 32% or approximately $94 higher
Black Sea
Number 1 global exporter in 2022
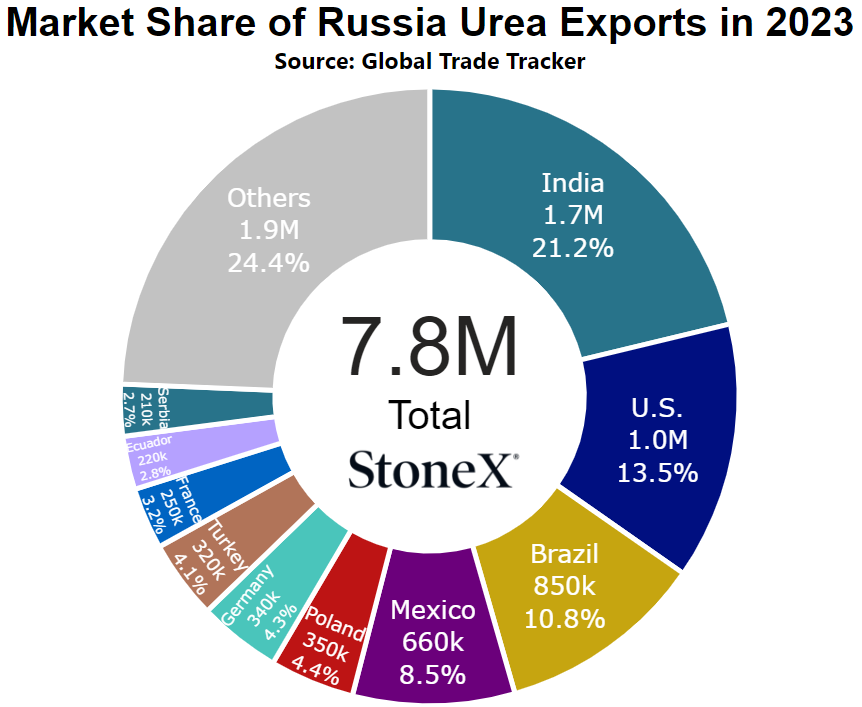
Price comparisons
Vs 30 days ago - 7% or approximately $23 higher
Vs 90 days ago - -5% or approximately $20 lower
Vs 6 months ago - 7% or approximately $23 higher
Vs 1 year ago - 39% or approximately $103 higher
China
Number 9 global exporter in 2022
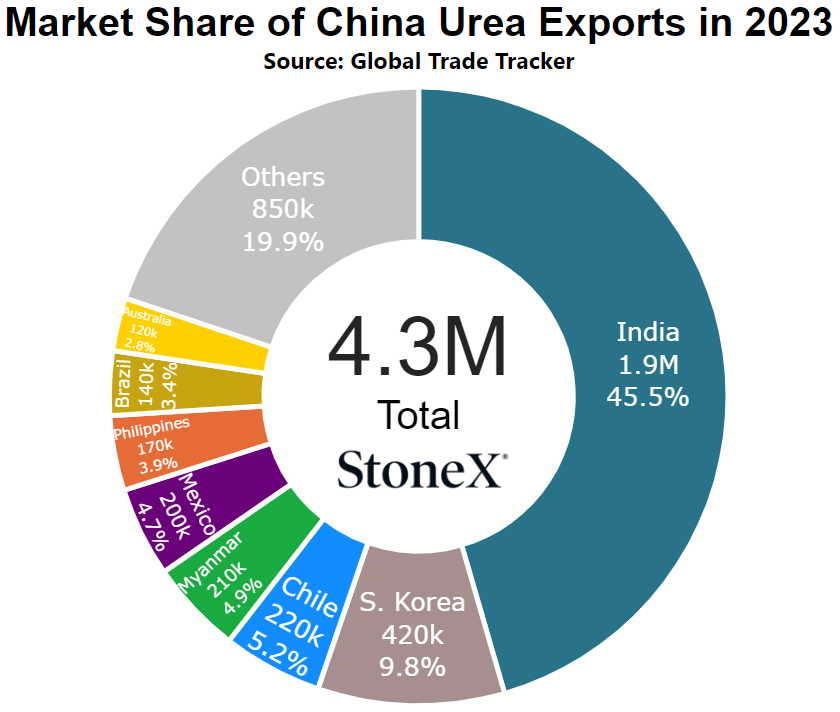
Price comparisons
Vs 30 days ago - -1% or approximately $3 lower
Vs 90 days ago - 11% or approximately $26 lower
Vs 6 months ago - 0% or approximately $0
Vs 1 year ago - -15% or approximately $48 lower
Brazil
Number 2 global importer in 2022
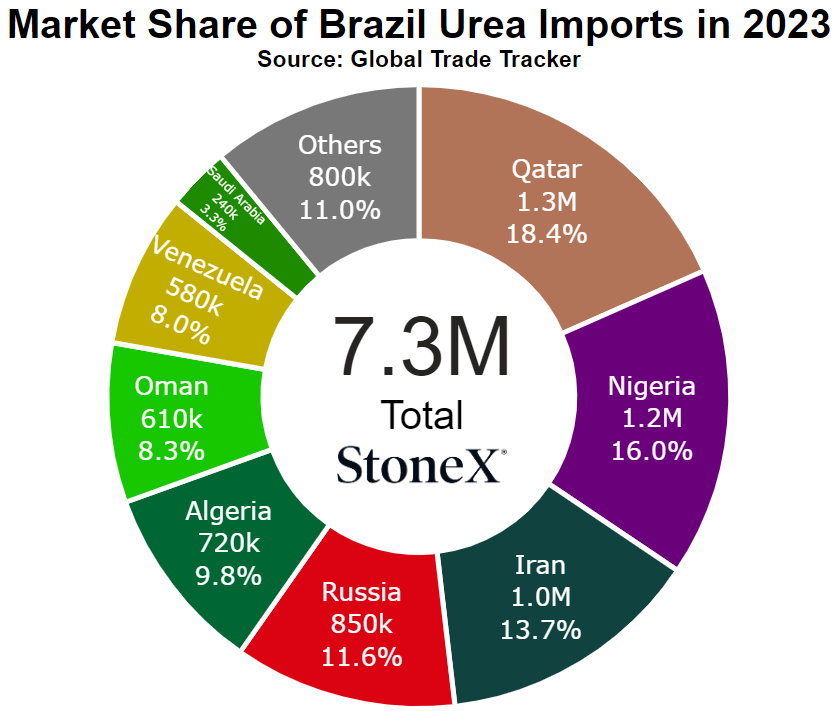
Price comparisons
Vs 30 days ago - 6% or approximately $23 higher
Vs 90 days ago - -6% or approximately $25 lower
Vs 6 months ago - 3% or approximately $10 higher
Vs 1 year ago - 22% or approximately $70 higher
- India steps in earlier than expected - right now, most of the market believes that India can wait until late May/early June before stepping in for another layer. That should lead to several weeks of a relative slow market that could weigh on price ideas...but what if India comes in much sooner? After 3 tenders falling well short of stated tonnage goals, their entry much sooner could shock the system and cause prices to rise as they sense desperation.
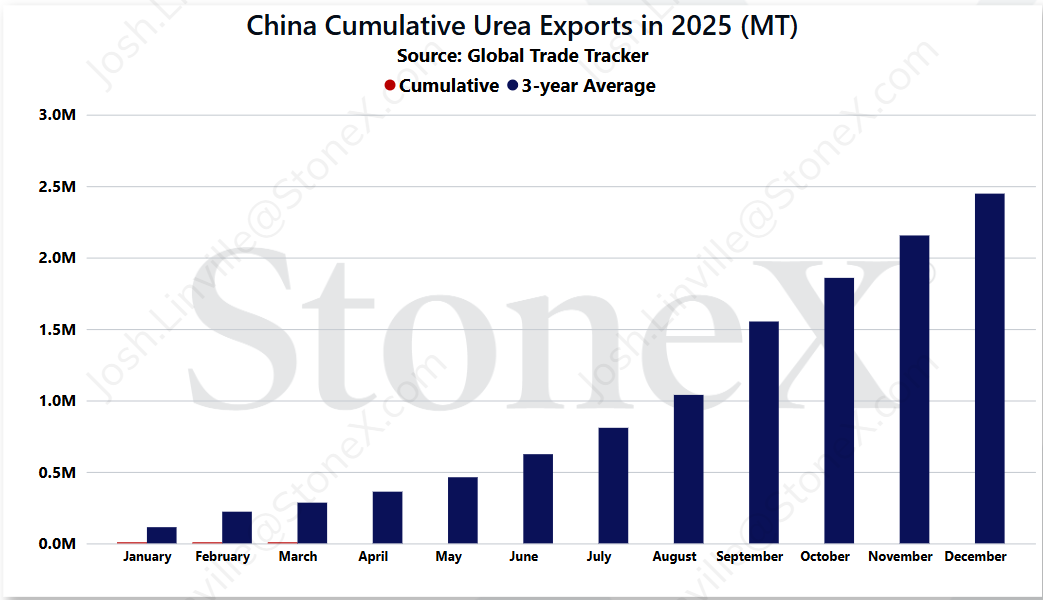
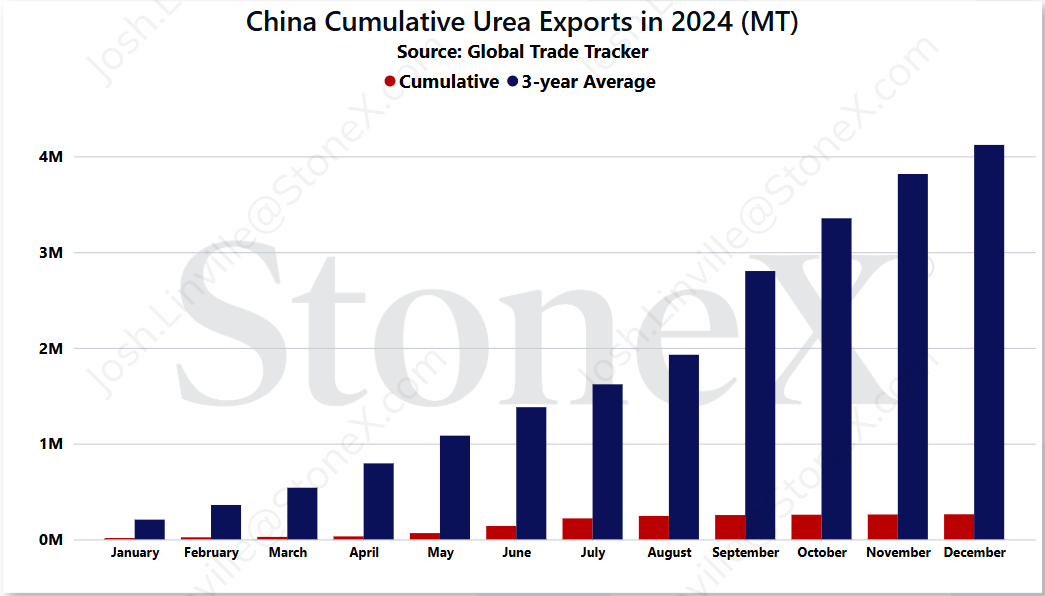
- Further global supply issues - right now, European production remains around 75% of normal and Chinese exports largely do not exist. Between those 2, that is around 8M tons per year that is missing. On its own, that is more than enough to lift the global price floor. However, if more production goes offline, the market is likely to react. This could be in the form of production downtime for repairs. It could be in the form of planned turnarounds. It could be due to input struggles. Regardless the reason, the global S&D is tight. Any impact will likely be felt in pricing.
- N.A. market continues to shift from UAN to urea - this is the story of the year. We knew UAN supplies were going to be tight but we didn't think to this extent. We are hearing all over that to find new supplies means waiting until June. Farmers cannot wait that long. If the capability is there, they can switch to NH3 or urea, boosting that demand. We are even hearing farmers willingly giving up their UAN to apply cheaper urea. Ultimately, the more/longer this happens, the higher prices go.
- India drags their feet, quiet around the world - the market expects their return in late May/early June. There is no guarantee that happens. Just look back to February. We were CERTAIN they were going to announce mid-month. They didn't return until the last days of March. Just because the market believes it does not make it true and if they can wait, the market might struggle.
- N.A. weather slows/stops demand - N.A. urea values are skyrocketing with demand pounding supplies. There hasn't been a chance to breath as mother nature has given few/no breaks for planting/applications. This causes the market to get "blinded". It is so busy, it doesn't have time to step back and take stock of what has happened. However, if it starts to rain and the market gets a break, what will it see? NOLA values are up over $100 since late March. If it has time to realize that, it might freak out but in the opposite direction.
- Lineup from North Africa starts to grow - with it nearly being May, trying to secure a vessel from the Middle East is a risky proposition. It takes almost a month to transit that barge meaning there is a high chance it arrives too late. However, it only takes 2 - 3 weeks to transit from North Africa. We are starting to see sales reported from there that are very likely headed to North America. Those vessels are needed...but fertilizer also tends to overdo things. If we suddenly start to find out that the import lineup is big, that could spook values lower.
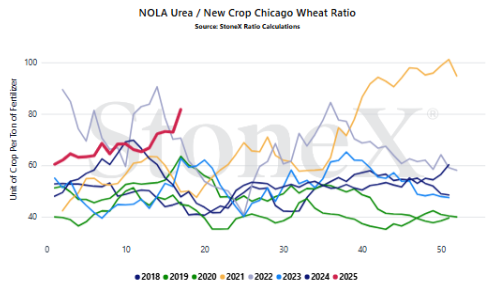
We believe that only looking at the flat price of either grains or fertilizer can be misleading:
- Only selling grain can hurt you if fertilizer prices rise substantially
- Only buying fertilizer can hurt you if grain prices fall
We look at the ratio "value" to get a better indication of where we are or how many bushels of X does it take to pay for 1 ton of fertilizer.
Would you rather:
- Spend 135 bushels to pay for 1 ton of urea
- Spend 55 bushels to pay for 1 ton of urea
When we compare the current ratio value against recent years, we start to see if we are high or low.
YOUR VALUES WILL LOOK DIFFERENT
This graph looks at the NOLA urea price vs the flat grain price. There are no logistics on either product. Your location will look different due to fertilizer logistical costs, grain basis, etc.
- India's return date - to me, this is the highest watch point for global urea. While the European/China situation has a bigger effect, it doesn't appear to be changing. We need to watch because they can change, they just haven't for a while. India is the looming demand that we do not know exact details. If they announce early, the market could rally as they smell desperation. If they announce "on-time" (late May/early June), could largely be a non-event. If they announce later, it could drag values even more.
- European production rates/Chinese export rates - as long as their stories remain unchanged, the global price floor remains elevated. It does not mean prices cannot fall, but it raises that floor with a much tighter S&D. Also, if we suddenly saw European production improve or Chinese exports return, it could crater price ideas as the world market runs away. While it doesn't look to have the same nearby impact as India, it is still incredibly important to the future markets.
- North American spring progress - so far this has been a wide open spring. There have been moisture events, but nothing massive that shuts down the whole spring run. That means constant demand/stress. The system hasn't had a chance to breath or catch up. If the market gets a break, we could see prices calm down as everyone catches up. However, if it doesn't...
- North American UAN supply situation - as wrong as I was on urea last month, I was just as right on UAN! Supplies are incredibly tight. It is so bad that we are hearing a lot of folks either considering or actually switching their UAN demand to urea. At this point in the calendar, there just isn't a lot of time left to call on additional supplies that can get here in time. What we have is largely what we have. That has been a bullish scenario the likes of which we haven't seen.
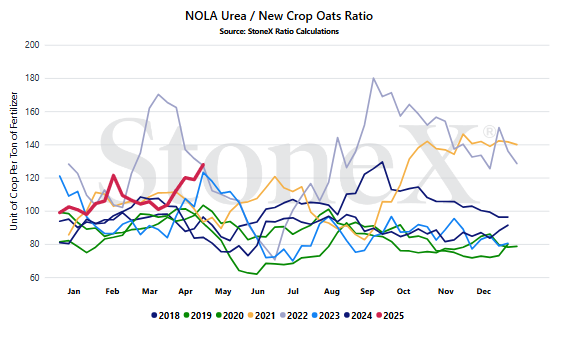
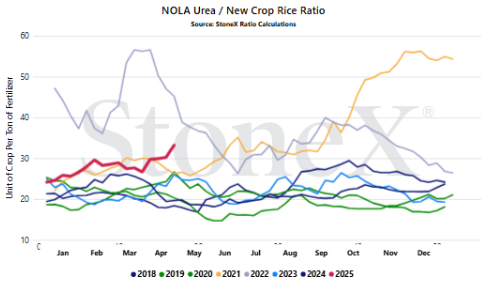
StoneX Ratio Calculation
The ratio calculation is derived from Bloomberg historical grains values as well as fertilizer values from StoneX, NPKFAS, and Argus.
The calculation is simply dividing the fertilizer price by each grain price.
All data was sourced from StoneX unless otherwise noted.