

The intention of the below graphs are not to use to say "my price should be X based on this graph". These prices are derived from an FOB price point average. The intent is to show major global price movement trends. Your values will likely have significant basis difference (similar to your local grain price being different than the traded market price).
This graph is labeled as MT in USD currency.
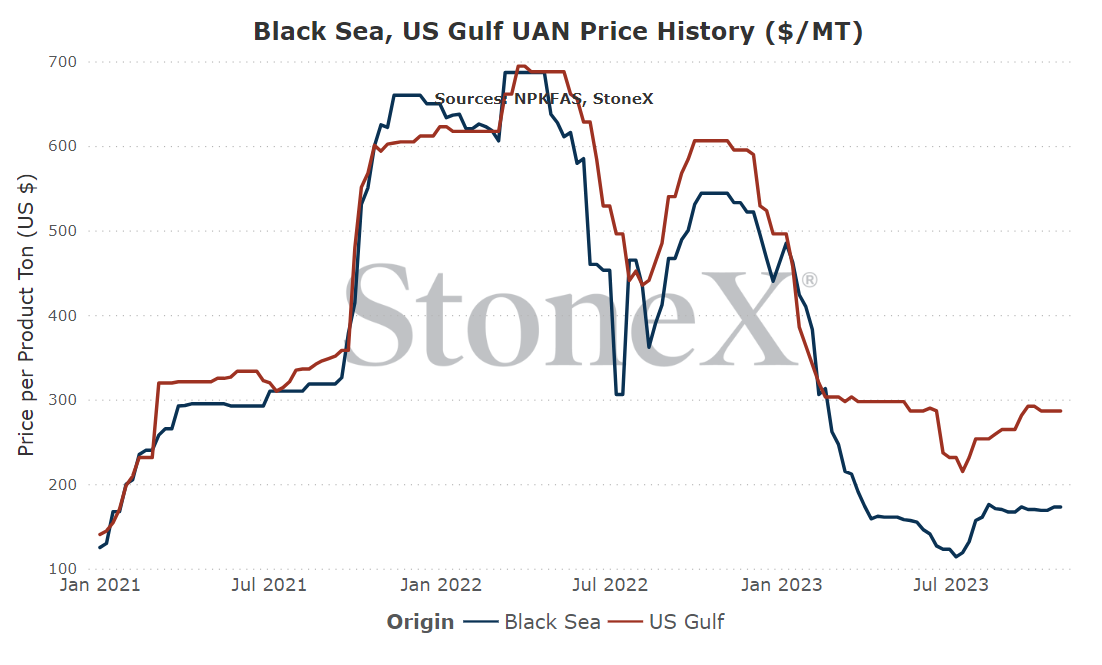
It does not appear that European production rates are going to change near term which means they continue to replace lost production with more purchases from the world. That skinnies up available supply to the rest of the world. N.A. manufacturing has had more issues than expected, perhaps enough to keep them from exporting more than they would. Russian values are shown to be a large discount vs NOLA and I wonder how long that will remain before it narrows.
Global UAN looks fairly bullish in the short term...perhaps in the longer (into 2024) term as well.
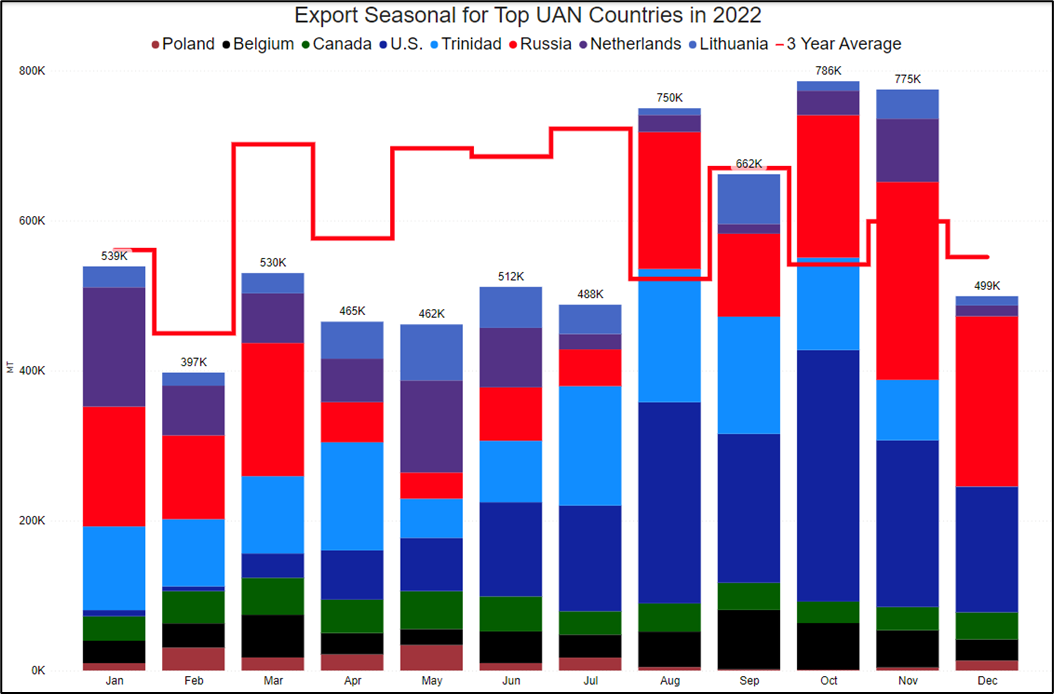
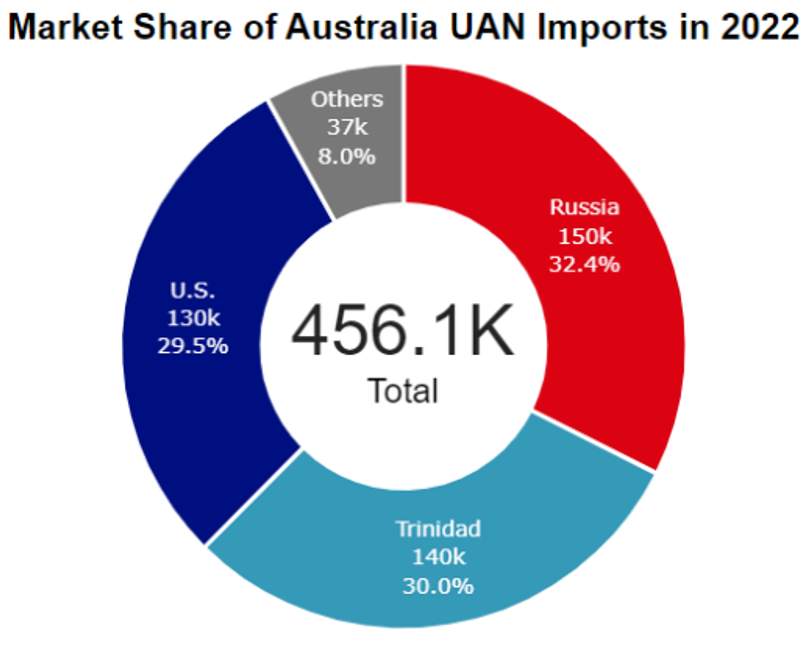
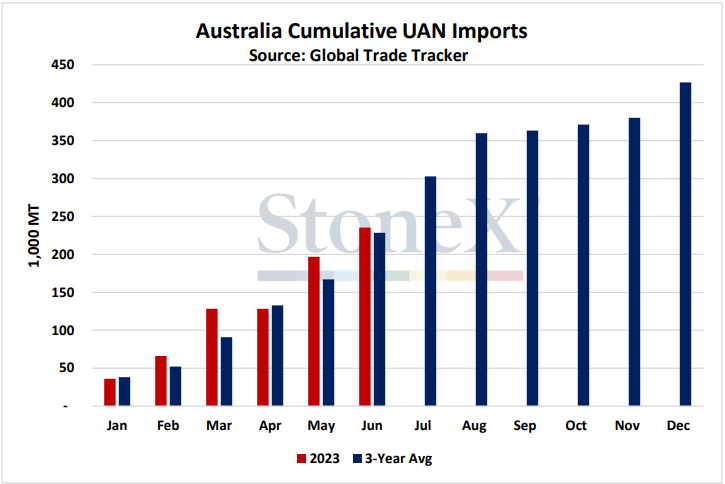
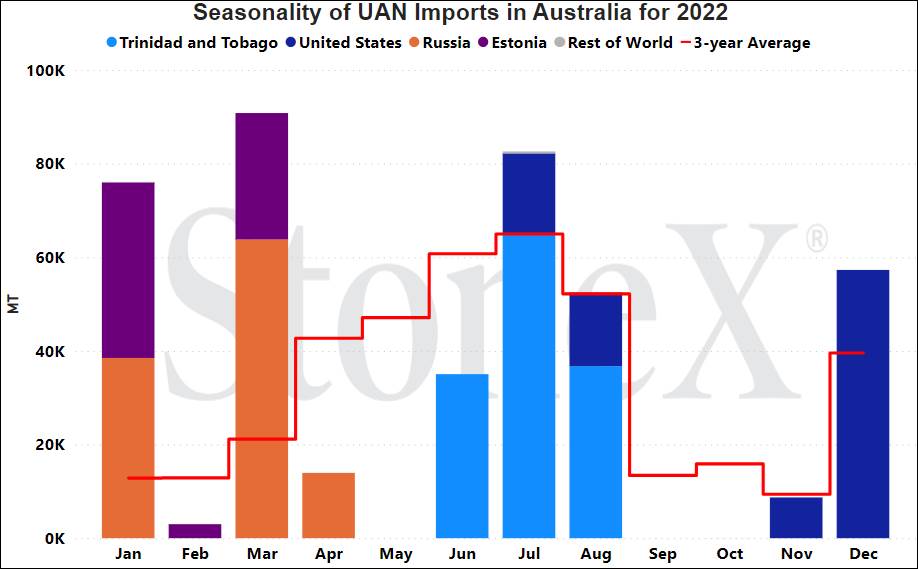
Palestine attack on Israel indirectly affects UAN
As mentioned in the urea section, I with this was a topic that wasn't a topic right now as that would mean it didn't happen in the first place. Regardless your politics (I'll keep mine to myself), it is hard to ignore the loss of thousands of lives and countless more that have been affected.
When I discuss this event, I am not ignoring the pain of people on both sides. This is a fertilizer newsletter so I will try to keep looking at it from a fertilizer perspective.
Directly, there was nothing that changed the global UAN marketplace. Neither country do much with it.
However, almost immediately after the attack by Palestine, global energy markets were on edge and quickly built in war premiums out of fear it would spread. This included the European natural gas market, Dutch TTF. We had been watching winter month values fall as lower demand and higher inventory levels weighed on price ideas. Just before the attacks, values were seen in the $13MMbtu range and hopes were rising that further European nitrogen production facility restart announcements would be heard. With roughly a third of global production of UAN coming from that region, it was going to be a game changer.
Unfortunately, values quickly rose and then steadied in the $16 - $18MMbtu range. Not high enough that we became fearful of production turning off, but certainly high enough to dash hopes of any further announcements of restarts.
Today, the world has a close eye on what is happening. An escalation/expansion of the war would seem to rally natural gas prices further and possibly start taking UAN values with it. As is always the case, things halfway around the world can and probably will impact you at home. Keep your eyes open.
NOLA/New Orleans, Louisiana
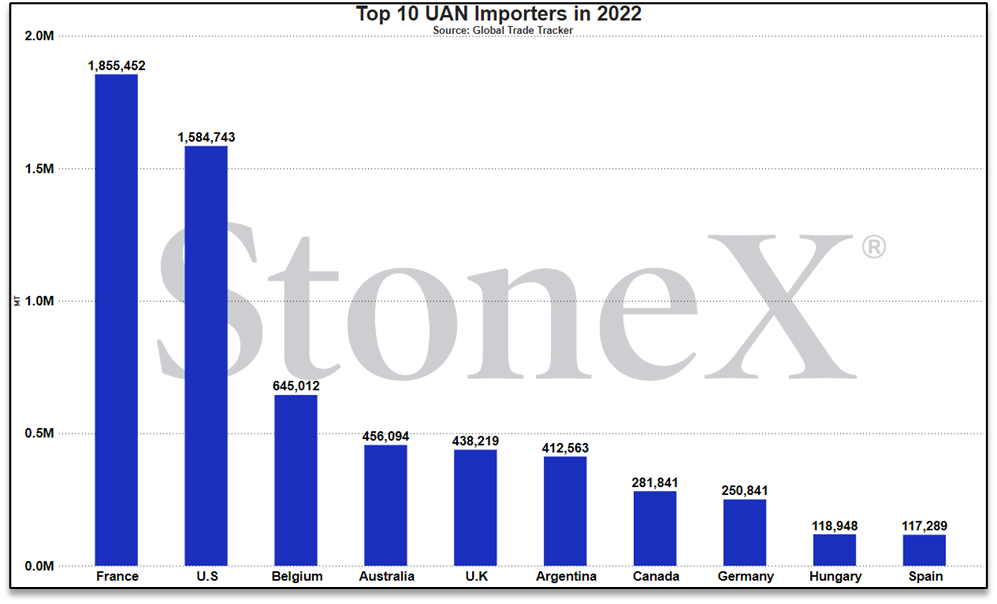
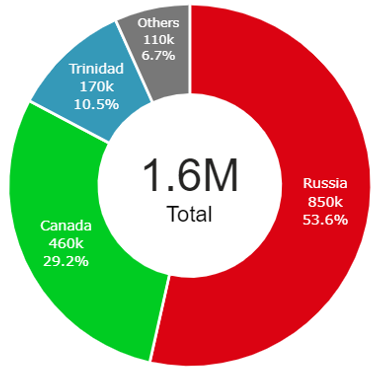
Number 2 global importer in 2022
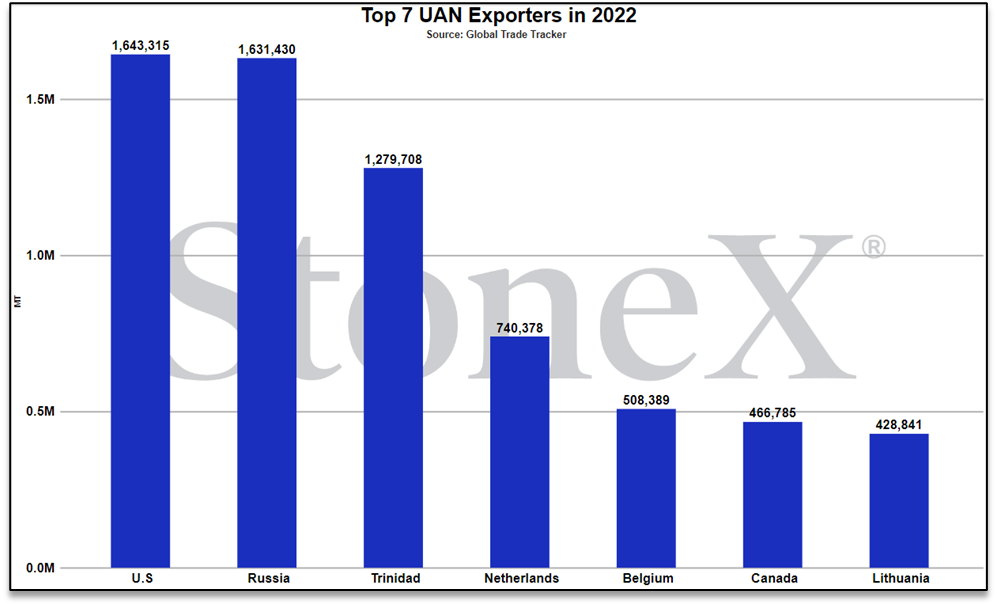
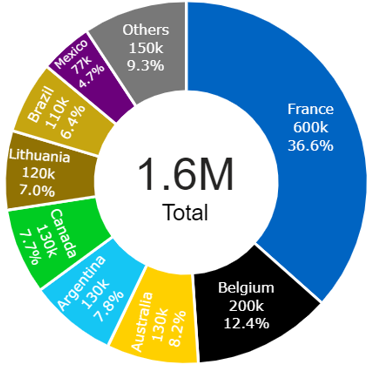
Number 1 global exporter in 2022
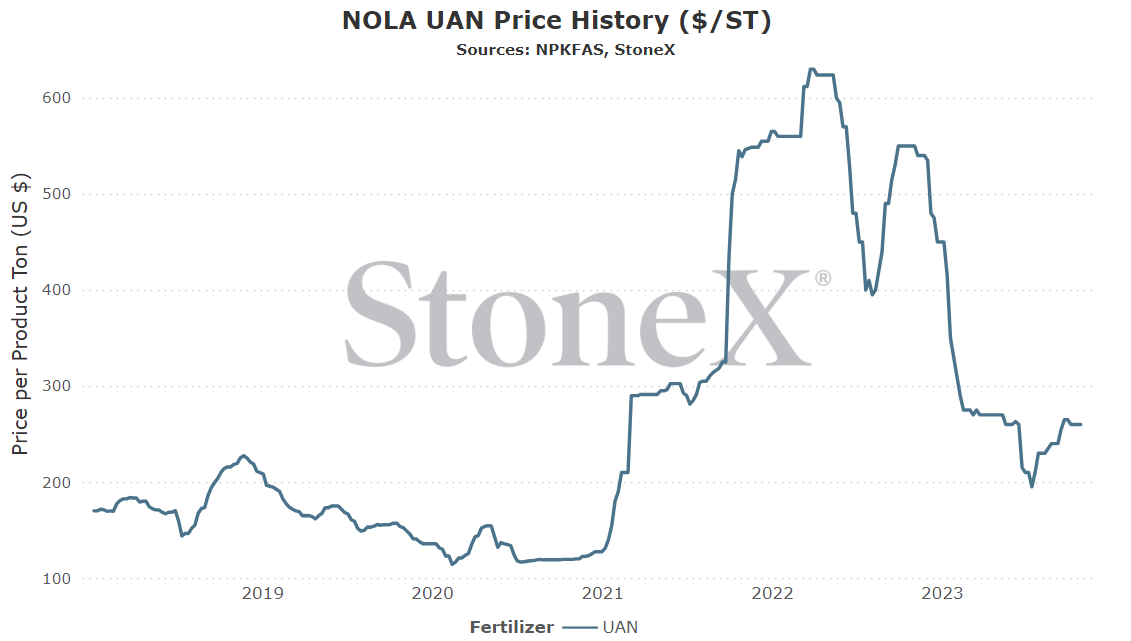
Price comparisons
Vs 30 days ago - -2% or approximately $5 lower
Vs 90 days ago - +13% or approximately $30 higher
Vs 6 months ago - -4% or approximately $10 lower
Vs 1 year ago - -53% or approximately $290 lower
Black Sea (Russia)
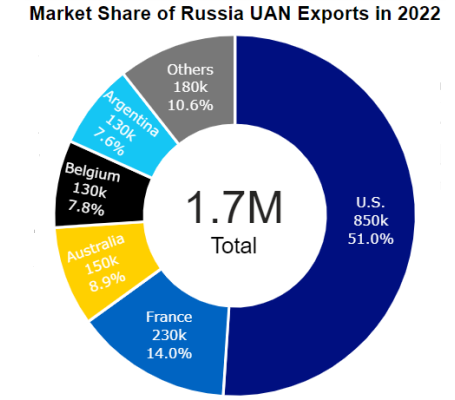
Number 2 global exporter in 2022
Price comparisons:
Vs 30 days ago - +2% or approximately $3 higher
Vs 90 days ago - +10% or approximately $16 higher
Vs 6 months ago - +7% or approximately $12 higher
Vs 1 year ago - -68% or approximately $372 lower
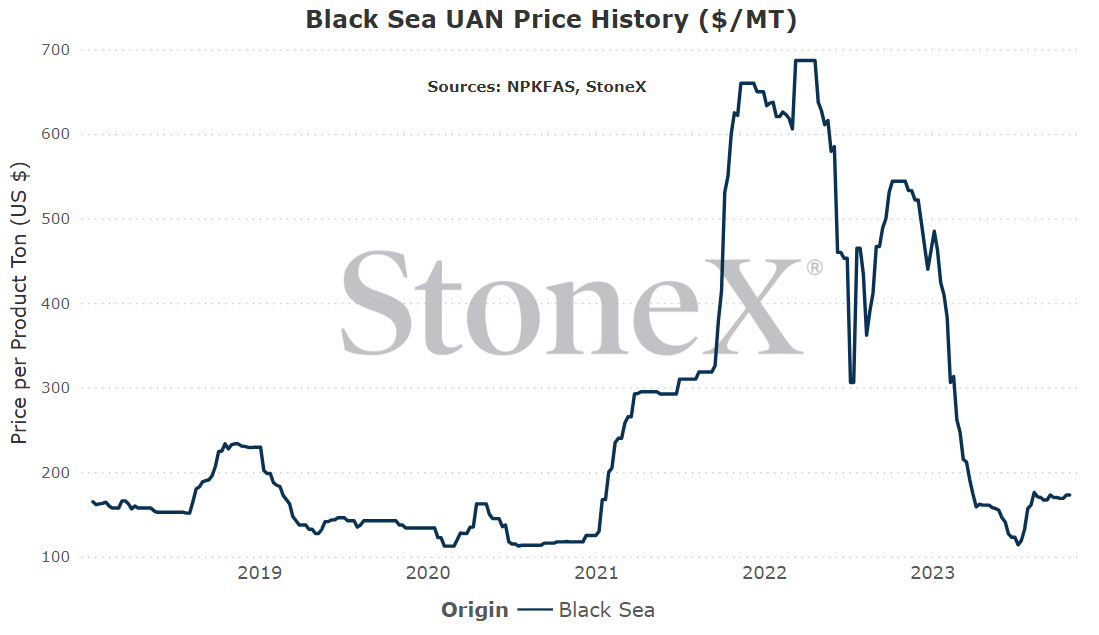
- European production remains lower than normal – approximately 1 out of every 3 tons of UAN produced in the world comes from the European region. While current production rates of 75 - 80% of normal is not a big dip, for UAN it results in a lot of missing tonnage. As long as European production is suffering, global supplies will remain tighter than normal.
- Israel/Palestine keeping global energy markets on edge/higher – the current war means the world is fearful of fighting expanding beyond those borders. As long as that fear remains in place, premiums in the energy markets remain in place. As long as energy/natural gas values remain elevated, it raises the cost of production for the global swing producer region (Europe). As their costs go up, so to does the global price point.
- North American production issues have grown – this has been a story that has ran under the radar. Going into summer, we expected production downtime as repairs have to be made. That in itself is not a shock. However, there have been longer repair periods and other plants have struggled with production. We do not know the number of UAN produced tons lost, but the number feels much bigger than originally expected. If correct, the S&D gets even tighter and manufacturers keep control of the price conversation...and they really like higher prices.
- High interest rates/river issues/struggling grain prices could hold demand at bay – it has been a while since the fertilizer market has had to factor in interest costs. However, every buyer in the supply chain must consider it. $2 - $3/month does not seem big until you consider that there is still 5 - 6 months before UAN application begins. That becomes a very real cost and could keep buyers on the sidelines for a while.
- Warm European winter could collapse natural gas values – today, the Dutch TTF is focused on the Israel/Palestine conflict. However, if we see another repeat of last winter where temps remained elevated and caused natural gas demand to crater, we could see more downward price pressure which would help raise production rates of UAN.
- Urea values start to fall – with the conclusion of the India urea purchase tender, I am wondering who (if anyone) will be stepping up to buy in the coming weeks. If it gets quiet, we could see urea prices start to fall as carry costs build as well as warehouse inventories. If urea starts to fall, we could see UAN follow. May not be a huge fall, but bearish none the less.
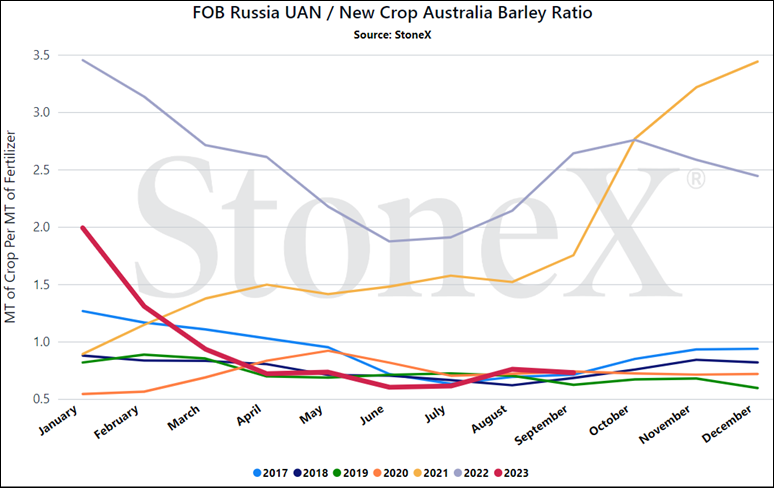
We believe that only looking at the flat price of either grains or fertilizer can be misleading:
-
Only selling grain can hurt you if fertilizer prices rise substantially
-
Only buying fertilizer can hurt you if grain prices fall
We look at the ratio "value" to get a better indication of where we are or how many bushels of X does it take to pay for 1 ton of fertilizer.
Would you rather:
-
Spend 100 bushels to pay for 1 ton of UAN
-
Spend 60 bushels to pay for 1 ton of UAN
When we compare the current ratio value against recent years, we start to see if we are high or low.
YOUR VALUES WILL LOOK DIFFERENT
This graph looks at the NOLA UAN price vs the flat grain price. There are no logistics on either product. Your location will look different due to fertilizer logistical costs, grain basis, etc.
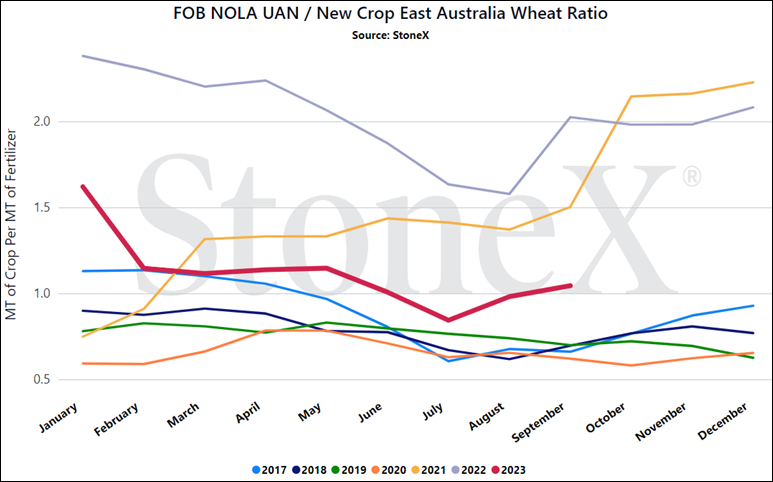
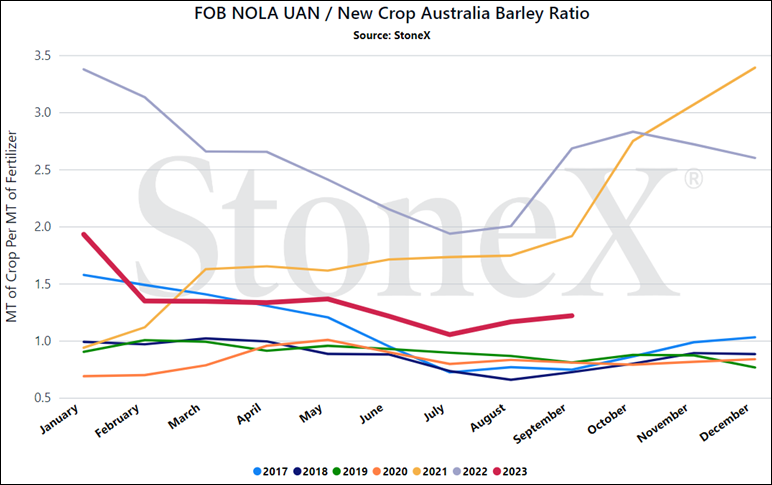
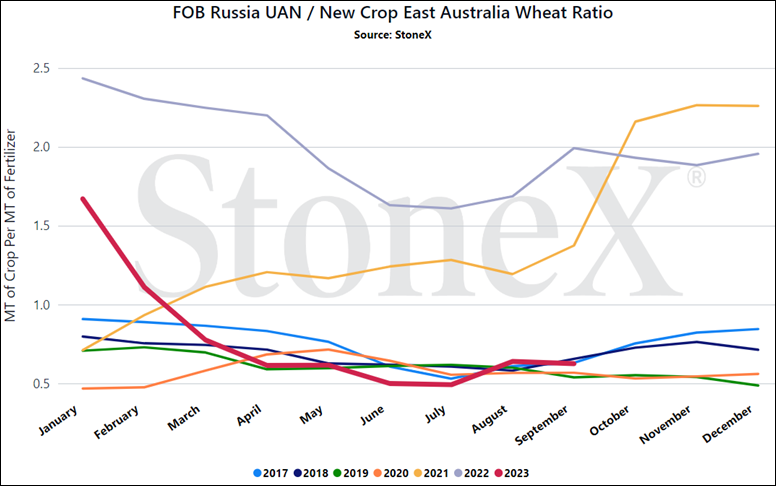
- Continued lack of destination options for Russian produced UAN - the U.S. remains one of the last remaining large UAN demand destinations available to Russia. That means they have to remain low priced to remain competitive. However, if we see changes to Canadian/Australian/European approaches to Russian produced UAN (i.e. reducing or deleting duties), the global market will change immediately after.
- Israel/Palestine's conflict inflicting pain on Dutch TTF - if the war escalates and starts to see outside nations start taking part, expect to see global energy values rise significantly as a result. This will be just as true for Europe/Dutch TTF. If the price rises enough, it could result in European UAN production being reduced which will further tighten global supplies. While it is an indirect situation, the results would the same.
All data was sourced from StoneX unless otherwise noted.
This material should be construed as market commentary, merely observing economic, political and/or market conditions, and not intended to refer to any particular trading strategy, promotional element or quality of service provided by the FCM Division of StoneX Financial Inc. (“SFI”), StoneX Financial (Canada) Inc. (“SFFC”) or StoneX Markets LLC (“SXM”). SFI, SFFC and SXM are not responsible for any redistribution of this material by third parties, or any trading decisions taken by persons not intended to view this material. Information contained herein was obtained from sources believed to be reliable, but is not guaranteed as to its accuracy. Contact designated personnel from SFI, SFFC or SXM for specific trading advice to meet your trading preferences. These materials represent the opinions and viewpoints of the author, and do not necessarily reflect the viewpoints and trading strategies employed by SFI, SFFC or SXM. The FCM Division of StoneX Financial Inc., a subsidiary of StoneX Group Inc., is a member of the National Futures Association (“NFA”) and registered with the U.S. Commodity Futures Trading Commission (“CFTC”) as a futures commission merchant and commodity trading advisor. StoneX Financial (Canada) Inc. is currently registered as a Futures Commission Merchant or equivalent in all provinces of Canada and is a member of the Investment Industry Regulatory Organization of Canada.




