Venezuela; the first Black Swan of the Year
Weekly roundup for StoneX Bullion
A very happy, peaceful and successful New Year to all our readers.
Please join our Metals Markets Webinar on 8th January;
https://stonex.cventevents.com/MetalsMarkets2026ChasingStability
06 January 2026
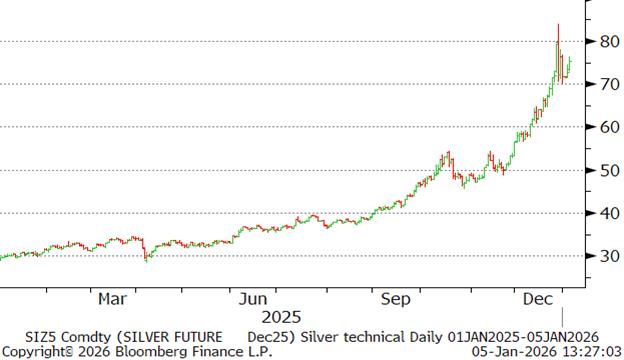
Welcome to 2026. After a febrile set of conditions in the precious metals markets, especially in the final quarter of last year it was to be hoped that this year would start on a quiet note. Instead, with the developments between the United States and Venezuela, we are back into risk-off mode and the gold price has gained almost $100 over the weekend, with silver adding almost $3.50. To put this into context, these overnight gains are 2.4% and 4.7% respectively, so silver is doing its usual thing and moving with twice the amplitude of gold.
That was, ultimately, the same story as 2025 in terms of price action; from year-end 2024 to year-end 2025, gold gained 67%, rising by $1,759 to close 2025 at $4,368, while silver was up by a mind-blowing 149% or $43 to close the year at $72.
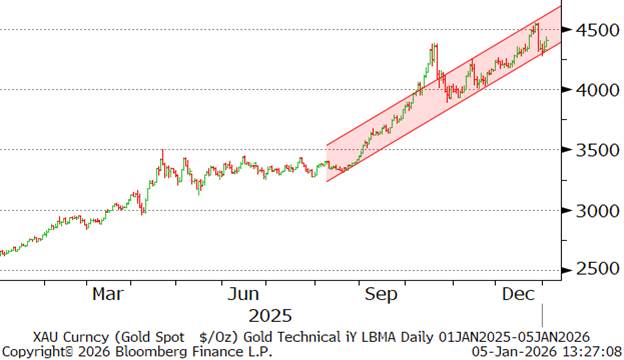
At time of writing on Monday 5th January, gold is trading above $4,400 and silver at $75.6.
We noted the following in our final note of 2025, but think it is worth making the point again;
“Gold made more record highs in both real and nominal terms and silver continued to crest new peaks in nominal terms. In real terms, the $50 silver price posted on 21st January 1980 works out at $214 in 2025 dollars. This is not to suggest that we are expecting silver to go to that level; far from it, but reflects the fact that it is a hybrid metal with 70% of its global fabrication going into the industrial sector”.
Gold
Also running through this sentiment, of course, is the ongoing concern about the independence of the Federal Reserve, the world’s largest central bank. The President has yet to name his choice for Jerome Powell’s successor at the Federal Reserve (his term ends 15th May); the favourite looks like Kevin Hassett, who is broadly aligned with the President’s view on interest rate policy – but it is important to bear in mind that putting Hassett into the Chair does not guarantee increased control in the hands of the President. Bear in mind that Stephen Miran, who is likely to step down at the end of his temporary term, is also of those same views and so Miran going out and Hassett coming in, even as Chair, would more or less balance each other out.
Meanwhile Chair Powell has not stipulated whether he will step down from the Board at the end of his term as Chair. Usually out-going Chairs do leave the Board, but his term as governor is not up until 2028, so this is taking up quite a lot of press copy – and has been for some months.
The Supreme Court starts hearing arguments in the Lisa Cook case on the 21st of this month but it is not clear when a decision will be handed down. Essentially the President wanted to fire Lisa Cook for cause on the back of the allegation of irregular mortgage activity on her part. Given that this is simply an allegation, she filed suit and in our view the outcome of this case will be one of the pivotal drivers affecting gold in 2026. If the Court finds in favour of the President, this could easily put give another boost to the gold price (and, by association, silver) as it would undermine the crucial independence of the Fed and the separation of the powers of the Judiciary, Legislative and Executive; it would also reduce confidence in the United States, not least because it raises the possibility of swings in policy every four years as opposed to a steady monetary policy, and would also likely undermine the dollar. If it finds for Cook then it could just as easily take gold lower.
Meanwhile investment in gold ETFs last year was approaching a record. The most recent figures from the World Gold Council (to 19th December) show net gains of 748.9t. This has been driven particularly by funds in North America, which had added 429.4t, while Asia showed increasing interest (from a low base), adding 188.9t, while Europe created 123.1t. In percentage terms, these increases were 26%, 87% and 10% respectively. Subsequent Bloomberg numbers, which are not as comprehensive as the WGC, imply further additions of 14.5t but this is likely to be understated.
Equally the net purchases from the Official Sector in the first three quarters of the year were 602t, (so ETF and the Official Sector have absorbed more than 1,340t this year). It is important to remember that investment and speculative activity, quite apart from commercial business, means that global OTC gold trades, over a 12-month period, are typically at least 90 times mine production levels and so while this investment / diversification activity from these two sectors is important in terms of tonnage, the message that the official sector, in particular, is sending to the market is important. In other words they are hedging against risk in all forms and that sentiment is on its own, a tailwind for gold.
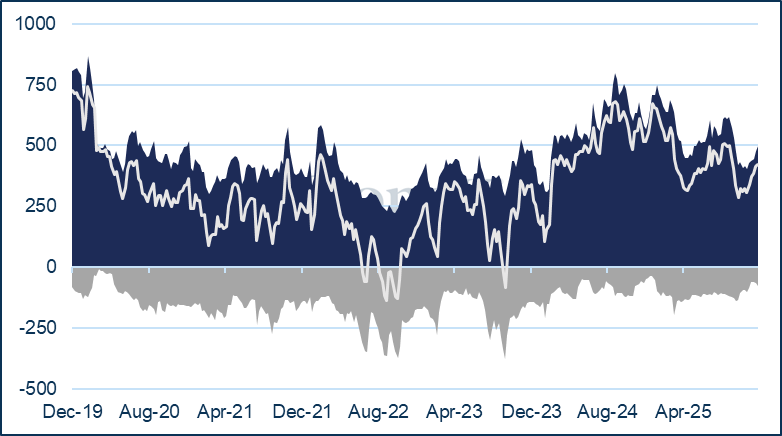
On COMEX, outright Managed Money longs added 93t over November and December to reach 499.5t (but this is still below the 123-month average of 588.0t), while outright shorts contracted by 18t, from 9.6t to 75.6t.
We expect the upward price momentum of 2025 to abate in 2026, but look for solid support above $3,500.
Silver’s tightness in London in October, during which it came to cost as much as 2.25% annualised to borrow metal overnight, has not fully abated, as silver’s classification as a Critical Mineral still renders it vulnerable to tariffs and / or quotas. While there are over 27,000t of metal in LBMA vaults, much of this is secured against ETFs and the free float is thin. India’s appetite for jewellery and silverware, after months of resistance to high rupee prices, has been reinvigorated and will likely persist into the first quarter of 2026, fuelled by the local wedding seasons.
Meanwhile US-based risk managers were not prepared to let metal out of the country, just in case. Ultimately with the London / COMEX arbitrage blowing out to more than $1.50/ounce, metal was flown (as opposed to shipped) across the Atlantic, with COMEX inventories dropping from 16531t in late September to 13,990t at end-December, a fall of 2,541t. This is still historically high, however; more normal levels are 9,000-10,000t.
ETF investment, meanwhile, stands (as recorded by Bloomberg) at 26,857 at time of writing, a gain of over 4,582t in the year, although there was some profit taking in the final days of the year. For context, mine production is roughly 26,000tpa.
On COMEX, Managed Money longs added 249t over November and December, to reach 5,631t, (also well below the 12-month average of 5,631t); shorts contracted by 140t to 2,087t.
Expect volatility, tension, swings in forward and lease rates, and a risk of a sharp drop when the investment momentum fades.
We are looking for gold to end 2026 in the region of $3,800 and silver, $55 as we believe that while there is still investor appetite, the massive increases in price last year are pricing in a lot of market risk premium.
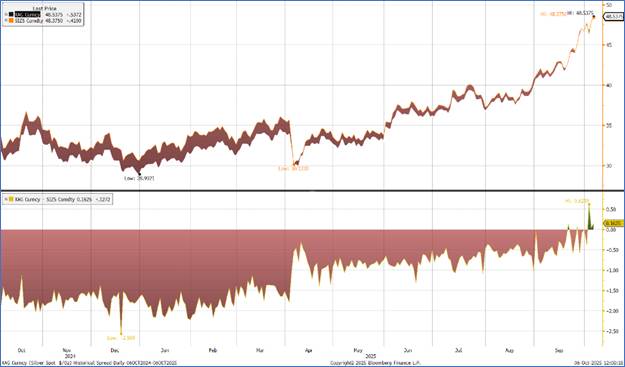
Silver galloping on under its own momentum; way overbought
Source: Bloomberg
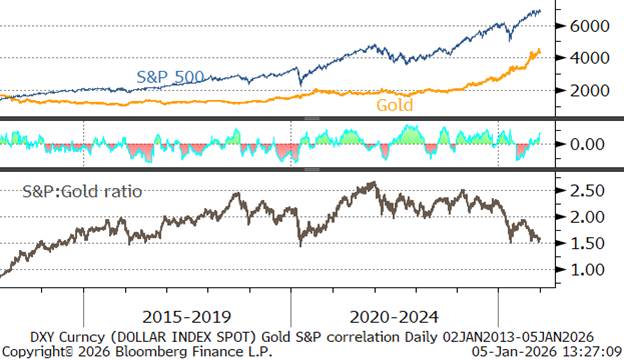
The S&P, gold and the dollar
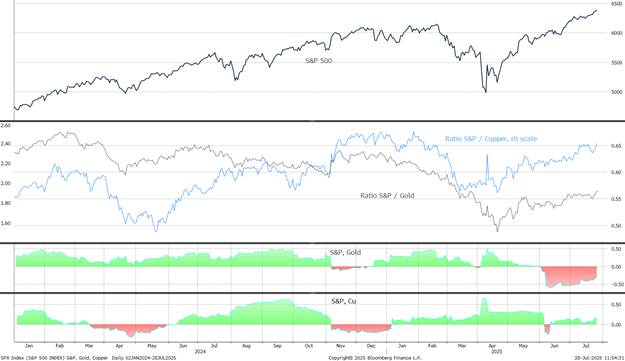
The S&P, gold and copper
Gold, January 2025 -to-date; late-year correction as CME announces margin hikes
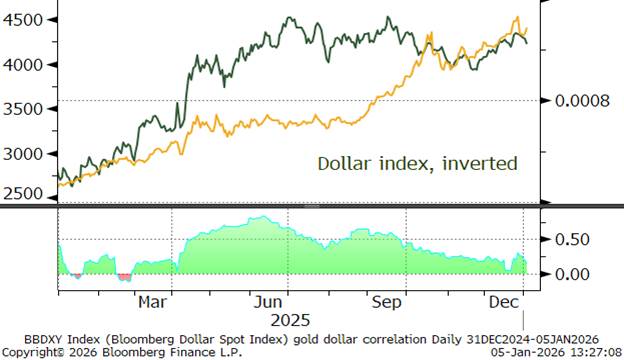
Gold:dollar correlation; easing again, now at-0.18
Source: Bloomberg, StoneX
Silver, also dropping post margin announcement; then taking off on Venezuela
Source: Bloomberg, StoneX
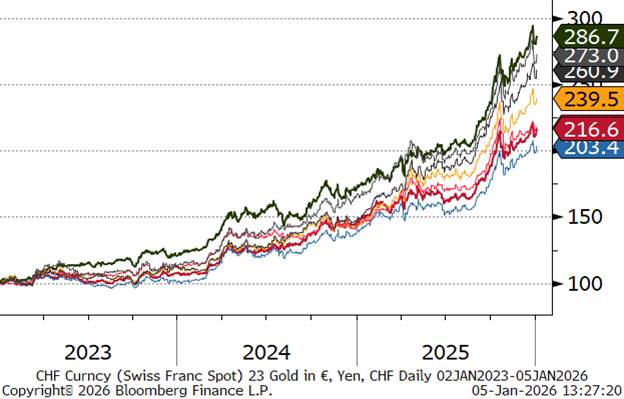
Gold in key local currencies.
Source: Bloomberg, StoneX
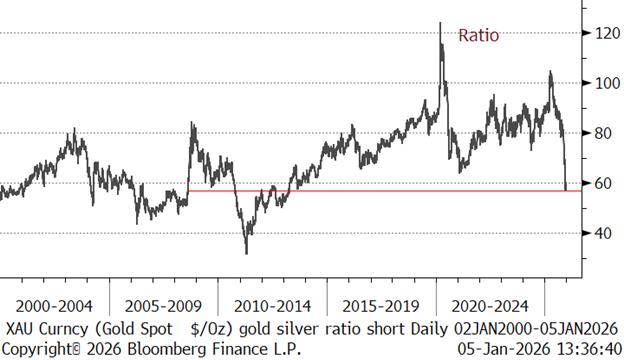
Gold:silver ratio, has touched eleven-year lows
Source: Bloomberg, StoneX
The CFTC numbers run as far as 23rd December
Gold COMEX positioning, Money Managers (t) –

COMEX Managed Money Silver Positioning (t)
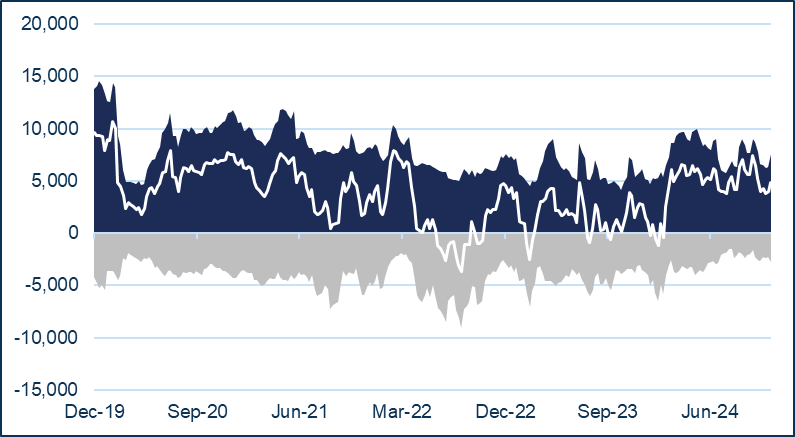
Source for both charts: CFTC, StoneX
| | 6 January 2026 | Previous week | % change | Year-to-date | Jan 2025 onwards | | Range as % |
| | | | | | Min | Max | |
| Gold (pm LBMA price) | 4,456.40 | 4,421.65 | 0.79% | 68.40% | 1,985.10 | 4,456.40 | 124.49% |
| Silver (LBMA price) | 75.07 | 72.18 | 4.00% | 155.25% | 22.09 | 75.07 | 239.91% |
| Platinum (pm LBMA price) | 2,246.00 | 2,083.00 | 7.83% | 143.87% | 1,264.00 | 2,246.00 | 77.69% |
| Palladium (pm LBMA price) | 1,722.00 | 1,773.00 | -2.88% | 86.97% | 852.00 | 1,837.00 | 115.61% |
| S&P 500 | 6,902.05 | 6,929.94 | -0.40% | 16.85% | 4,688.68 | 6,932.05 | 47.85% |
| $:€ | 1.1722 | 1.1773 | -0.43% | 12.62% | 1.0244 | 1.1867 | 15.84% |
Source: Bloomberg