Welcome to our round-up of precious metals activity in April 2022, and a look at the context helping to influence market volumes – and vice versa. The high-level patterns for the precious suite were interesting in that overall daily average monthly volumes for gold and palladium were down across the board i.e. in spot, swap/forwards, options and LoanLeaseDeposit (LLD) when compared with the daily averages over the preceding twelve months; platinum volumes were all down except spot; while silver had a better time of it with volumes only down in options and up everywhere else.
Within the month, very broadly, gold daily volumes were highest towards the end of the month in all sectors; silver was similar except for LLD, which was arguably busier in the middle of the month. Platinum was mixed but with intensifying activity in the latter part of April. Palladium spot was clearly busiest in the first week. Palladium options were almost non-existent while the forwards were busier in the early part than towards the end while the reverse was true of LLD.
In March, the LBMA suspended Good Delivery listing for gold and silver from six Russian refineries and when we were writing the April edition of these notes the LPPM was still monitoring the situation. The LPPM then announced on 8th April that certain Russian brands would be suspended. We will look at this in greater detail in the relevant sectors below, but as might have been expected the volumes in palladium fell by a lot more than those in platinum. In 2021 Russian palladium production accounted for roughly 38% of world total and platinum for roughly 10%. More of this below.
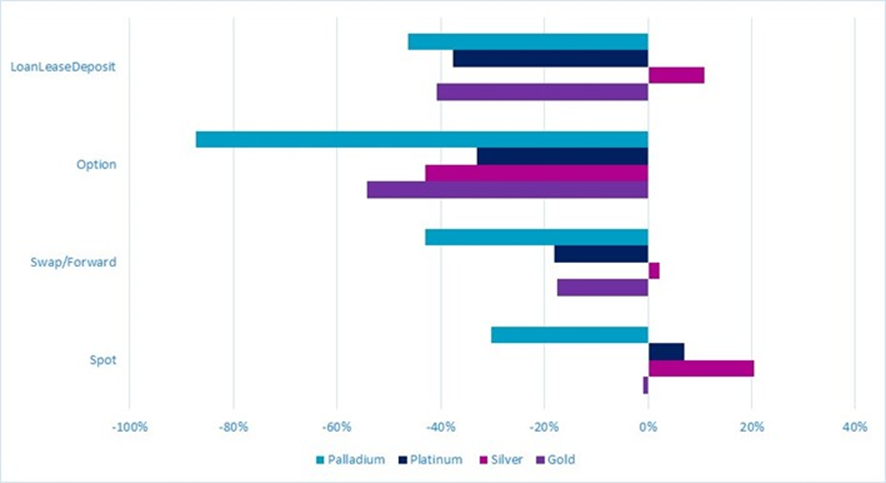
Daily average trading volumes in April, compared with April 2021-March 2022
GOLD
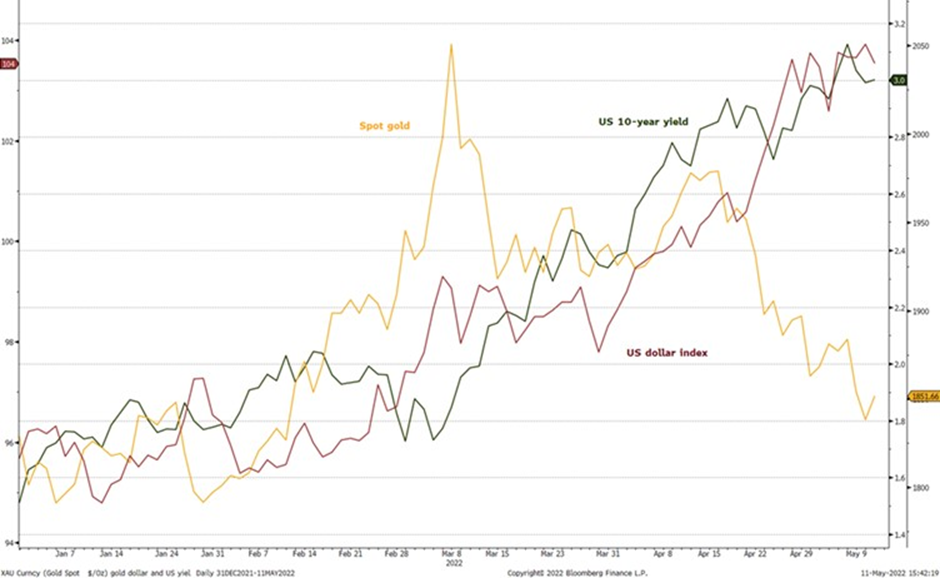
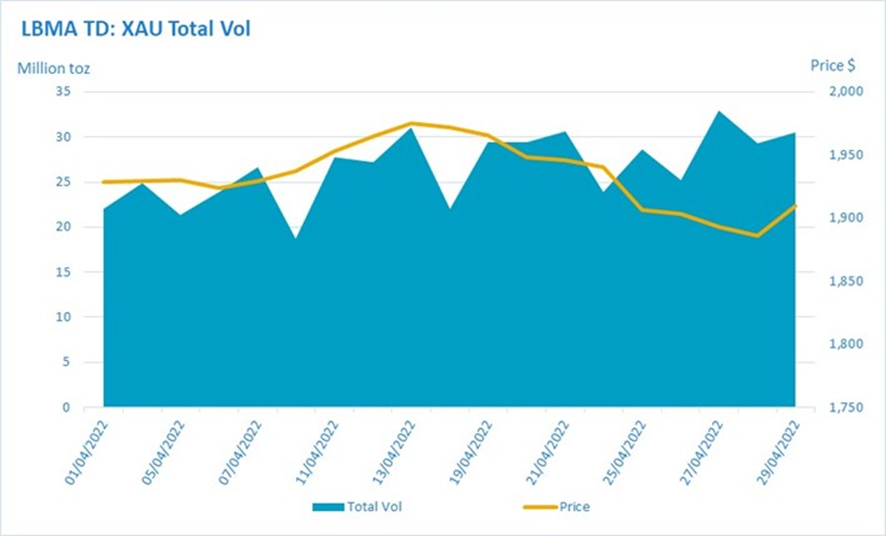
Gold’s month can probably be summarised as uncertainty to start with, fresh buying interest developing as confidence returned in the second week and taking prices to a test of $2,000; then hedging into the downturn followed by heavy volumes all round (apart from LLD) at month-end as prices battled around the $1,900 level.
The start of April was a very stressful time in the global markets with tensions heightening over Ukraine and the markets focusing on the Federal Reserve again (to be fair, the markets are always keeping an eye on the Fed). There were also question marks over the degree of harmony across the world’s major oil producers. Set in this environment, with the markets firmly in risk-off, spot gold trading volumes at the start of the month were low as market participants were uncertain of what was in store. The physical market was also quiet.
Early April – gold, dollar and rates all moving higher
Source: Bloomberg, StoneX
Activity then picked up and prices started looking brighter, possibly triggered by the release of the Minutes of the March Federal Open Market Committee meeting, which re-focused the markets’ attention on inflationary pressures. At that point the inflation narrative plus the Ukraine situation were more powerful than concerns over interest rate levels, especially given that real rates remain in negative territory. After a solid bull run in the first half of the month, gold peaked on the 18th at $1,979 (intraday) and on this occasion the usual rule, about turning trend meaning high volume, didn’t apply - although volumes did improve. Two days later, however, 21st April, was the start of the price slide and at 20.4M ounces this was the second highest volume day of the month in the spot sector.
To some extent this reversal can be laid at the feet of Fed Chair Jay Powell who spoke at a virtual IMF economic conference and said that it was appropriate, in his view, to be “moving a little more quickly”; the markets, already skittish, took this as in implication that there would be a degree of front-loading and started pricing in a 75-point hike in June. This pulled the rug, to some extent, from both Treasuries and gold, which slid towards $1,900 by month-end.
One of the most telling elements of the month in gold was that swap and forward rates were a lot higher from 12th April onwards than in the first few days. Volumes were particularly high either side of Easter, coinciding also with the top of the month’s range as gold tested, and failed at, $2,000. Forward volumes were notably heavy in the days that gold slid to $1,900, suggesting that there was some active hedging in the market.
The story was the other way around in the LLD sector, with daily average volumes higher in the first few days, tailed off, picked up again and then closed right down at month end. The implication here is that there may have been some lending into the market from official sector sources at the start of the month but that this was variable thereafter.
Overall, gold finished the month on a lively note, caught between action on both sides of the market and laying the groundwork for a short-lived rally at the start of May
SILVER
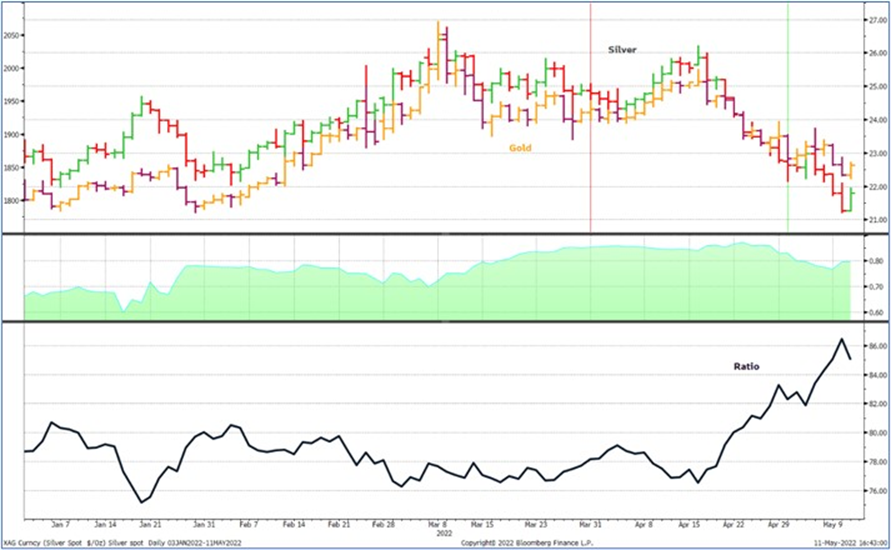
On the surface, it looks as if silver was following a similar path to gold during April. Short-lived early weakness, rallying through to 18th April then the start of a downward slide. The essential difference, though, was that silver largely underperformed gold, even when the latter was on the up.
All other things being equal, silver is generally likely to outperform gold in a bull run and underperform in a bear, as it is a smaller and more volatile market. In the general consciousness silver is frequently associated with gold because of their combined history in coinage and use in decorative ware and jewellery. It must be remembered, though, that roughly 60% of silver demand is industrial (and over 65% of supply is either primary by-product or scrap recycling). What this can mean is that, especially in an uncertain economic environment, if any upward move in gold is anaemic and unconvincing, silver may not respond in its usual enthusiastic manner.
This is largely what happened in April, with the gold:silver ratio narrowing in the early phase and then widening over the rest of the month. On this occasion, silver notably underperformed on the way down with the ratio rising to the highest since end-July 2020 (and going higher still in early May).
Gold and silver year-to-date; misleadingly close short-term profile
Source: Bloomberg
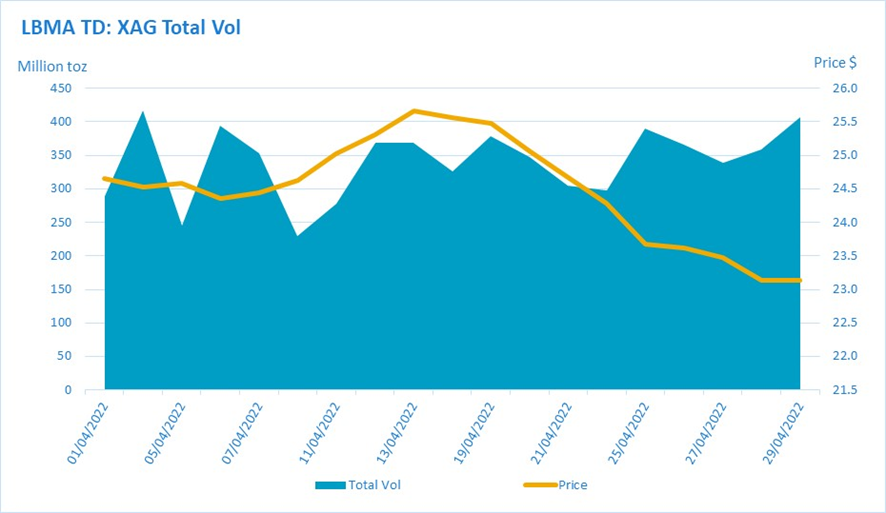
As far as trading patterns are concerned, silver was the liveliest of the four metals when compared with the previous twelve months; this almost certainly reflect a polarisation of views within the market. This is backed up to some extent by what was happening in the ETPs and on COMEX; ETPs experienced frequent changes of direction between creations and redemptions, while COMEX saw longs and shorts expanding and contracting together in each week (i.e. longs up and shorts up; then longs down and shorts down…)- apart from the final week, in which long liquidation was compounded by fresh shorts.
Spot volumes were 20% higher than the average over April to March (gold was down by 1%). LLD was up by 11% and Swap/Forwards were up by 2%. The heaviest spot volumes were in mid-month when silver was wrestling with resistance at $26 for four days, when it finally failed. The lowest spot volumes were early in the month as both gold and silver marked time amid conflicting forces. The final eight days were all “down-days” as the markets increasingly focused on the likelihood of a 50 point hike from the Fed (and started to fret over the possibility, now dismissed by Jay Powell, of a 75-popint hike in June). Trading was in reasonably high volume, and only fractionally below the average of the remainder of April, in which volumes had been boosted by the fight at the top of the market.
Swap and forwards, meanwhile, were very quiet as the market was making up its mind about the tests of $26, and were also relatively low as the descent commenced, but trading momentum picked up as prices veered lower. During this latter period also, LLD activity was moderate, and these two factors between them suggest that there may have been some industrial forward buying into prices that had, by this stage, reverted to where they had started the month, at $22. Options activity was subdued across the board, some 43% below the average over the previous 12 months.
So on balance, silver was fighting with itself for parts of the month but defensive selling on the way down looks to have had the upper hand.
PLATINUM
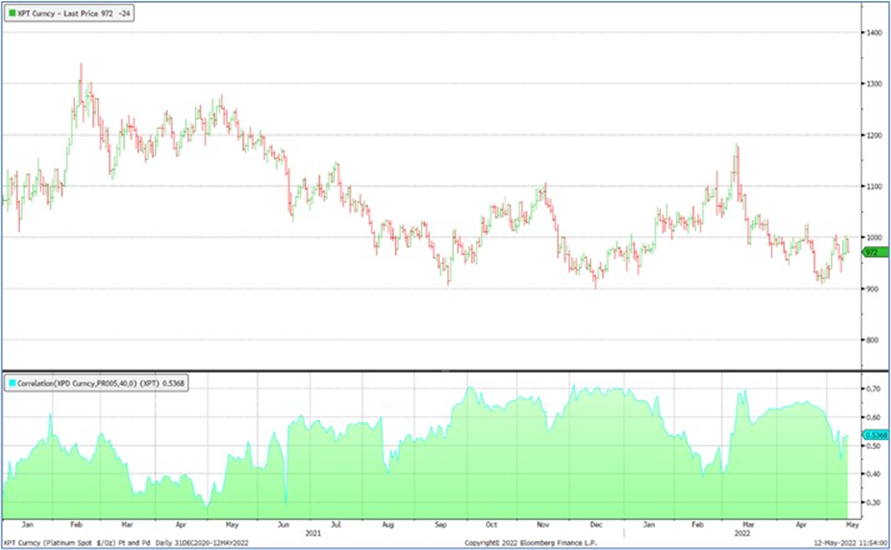
Platinum dipped at the start of April, rallied in line with gold and silver and went into reverse on the 19th on fresh concerns about the fundamental outlook as Fed officials became more hawkish (see gold and palladium sections) and the auto sector remained under pressure. As we noted in April, Ukraine is responsible for roughly 50% of the world’s neon supply (and a higher proportion of the very high quality neon required in some uses in the United States), and the markets are concerned that the crisis in the country could result in further disruption to semiconductor supply chains as it is vital for laser engraving of the chips. After sliding through the psychologically significant $1,000 level (and failing in further challenges of that level), spot prices slithered lower and didn’t find support until the $900 - $940 range.
The market has been keeping half an eye on the strike action at the gold operations in South Africa at Sibanye-Stillwater, as the CEO at the company has warned that the strike (now two months long) could be used by the platinum workers to give them some leverage. The South African platinum mining industry works on a triennial wage cycle, and this is a negotiation year. Amplats is already in negotiation and has offered 7% for a five-year period; other operators are due to start negotiations soon.
Concerns over potential strike action, along with the continued phasing in of emission controls in China that, among other things, halve the mount of permissible carbon monoxide emissions on heavy duty vehicles, point to industrial stockpiling during the month. Imports into China were strong in March and anecdotal evidence would suggest that this may have continued. As we write in early May the platinum forward curve is heavily inverted and this looks like hedging or defensive purchasing against potential imbalances. The trading patterns in the swap-forward segment would certainly bear this out. The average daily trading volumes in this sector from 22nd April, when platinum dropped through $950, through to month end, which was a period of consolidation between $900 and $950, was almost the same as the daily average for the period April 2021 to March 2022 – but 39% higher than the average in the rest of April.
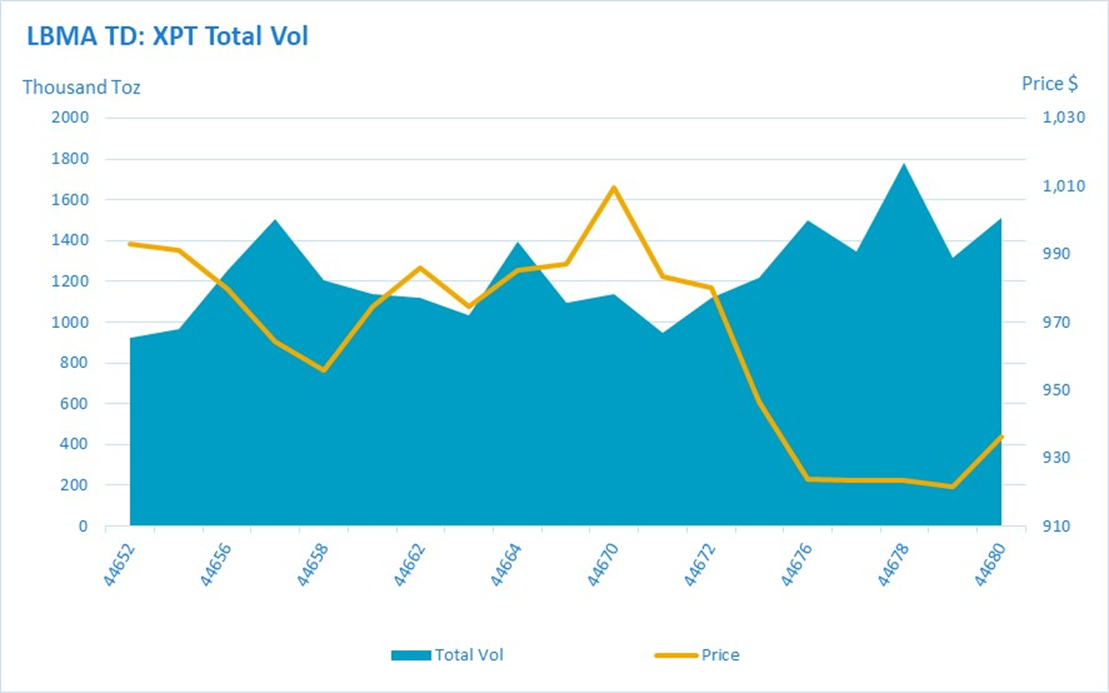
The pattern was not dissimilar in spot; the late -April daily spot turnover was 16% higher than the April-March period, and 14% higher than in the earlier part of this April.
That activity helped to set the scene for the rally in prices that developed in early May. Interestingly, the managed money activity on NYMEX had seen plenty of long liquidation through April and a big increase in short positions. In late April there was fresh long-side interest, but the shorts were also on the increase; but the numbers would suggest that weak-handed holders had been cleared out of the market.
Activity in the LLD sector over the whole of the month was unremarkable, beyond the fact that was 38% lower than the previous twelve months’ average.
Spot platinum, January 2021 to early May 2022 and its correlation with palladium
Source: Bloomberg
PALLADIUM
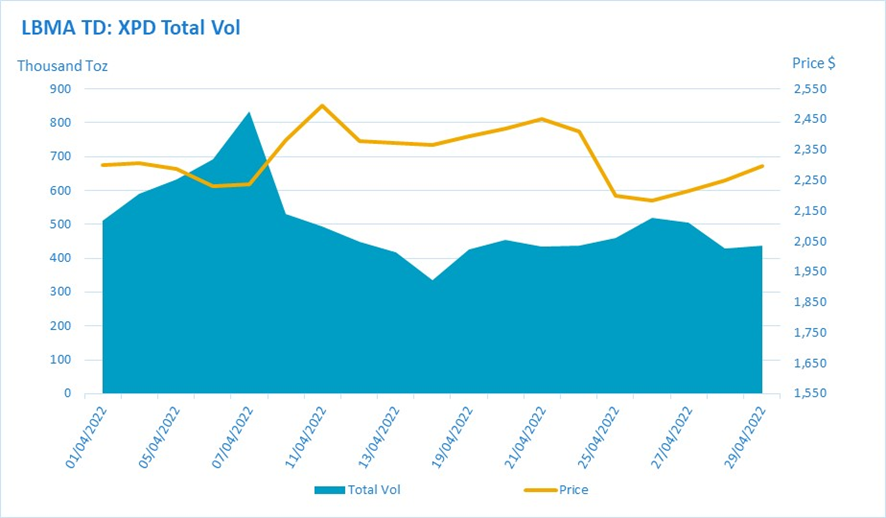
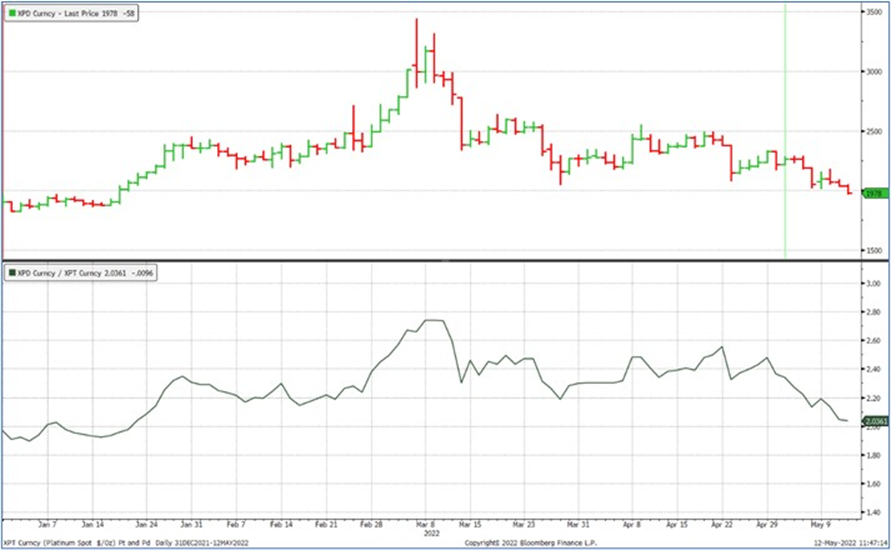
Palladium also started April on a positive note, but it topped out sooner than gold silver and platinum, on Monday 11th, the first trading day after the LPPM announcement that it was suspending the platinum and palladium brands from Krastsvetmet (Krasnoyarsk) and the Prioksky Plant of PZCM. As we noted last week, Russia generally accounts for 38% of world palladium supply and the announcement initially caused some concern that industrial usage, already under threat from COVID legacy and the associated shortage of semiconductor chips, would grind to a halt. That has not in fact happened as supply and demand have continued to rumble on, albeit that the demand side is fundamentally subdued for the above reasons. Palladium had been under some pressure at the start of the month but rallied during the second week on the back of light industrial interest to test an intraday high for the month of $2,551, substantially below the $3,442 peak in early March. These April gains were more than relinquished in the second half of the month before some bargain hunting interest developed at the lows around $2,100, but this was just a small rally before the downtrend was resumed in early May.
Spot palladium and the ratio with platinum, six months view
Source: Bloomberg
The price rally developed despite a strengthening dollar and hawkish comments from FOMC Bullard (a renowned hawk) plus FOMC Minutes that were relatively hawkish in their own right and had much more to do with market sentiment about the potential impact of sanctions. The reversal in mid-month did not conform to the usual pattern of swollen volumes and was more a function of market nervousness, coming down in sympathy with gold and silver (again, as outlined in the Gold section, driven in part by concern over the potential economic impact of aggressive rate hikes), although there is a subtle but important difference here; gold and silver were more concerned with gold vs. rates; palladium was more ruffled about any possible disruption to economic recovery.
As far as trading patterns are concerned volumes dropped substantially in the period from Monday 11th April in all the different sectors apart from LLD, which was steady, albeit in much reduced volume. Swaps/Forwards dwindled in the second half of the month, possibly due to falling prices, but perhaps also due to concerns about potential supply risks. If that was the case, then those fears appear, for now at least, to have been ill-founded.