Silver –what happens to the gold:silver ratio now?
With the gold:silver ratio spiking recently and silver underperforming, in this piece we take a look at the underlying fundamentals, recent technicals, the ratio itself and pull it all together at the end by reverting to the fundamentals, recent developments, and possible outcome. It could well be that the ratio has further to retreat.
We noted in our weekly round-up on Monday (23rd August) that while the Bloomberg base metals index had dropped 5.6% over the Monday-Thursday of the previous week, silver’s fall had been just 3.7%, reflecting some support from steady gold. Since then silver has again underperformed as gold appears to have run out of steam and the markets fret about the robustness of economic recovery.
While this may seem an odd way of starting a piece about silver, which is so frequently thought of as a precious metal, the point here is that when gold is not trading an identifiable bull or bear trend then silver will often revert to taking guidance from the base metals, reflecting the fact that roughly 60% of silver’s demand is actually industrial rather than precious, and its relationship with gold is historical rather than fundamentally fully justified.
This is for these key reasons: -
- Silver used to be an internationally accepted currency (although latterly it was more used for intra-national transactions while gold was more frequently used in international trade)
- When the dollar was put on the gold standard (again) in 1934, U.S. citizens were not allowed to hold it for investment purposes and so they turned to silver
- At a more prosaic level, there is of course the jewellery and decorative elements of the market, which tends to underpin silver’s perception as a precious metal
- And finally of course there is the relationship with gold, justified or not, that keeps silver in the precious spectrum and makes the gold:silver ratio a much discussed and much traded instrument.
So what does recent activity tell us?
Form a fundamental standpoint; this year looks as if jewellery and silverware will comprise just 26% of total, with industrial at 74%. When we add in estimates for physical investment, which look likely to be substantially below last year, with silver ETPs currently running 200M ounces below last year’s rates, jewellery and silverware drop to 24% and industrial demand, 68%.
Silver use by major components, 2021(e)
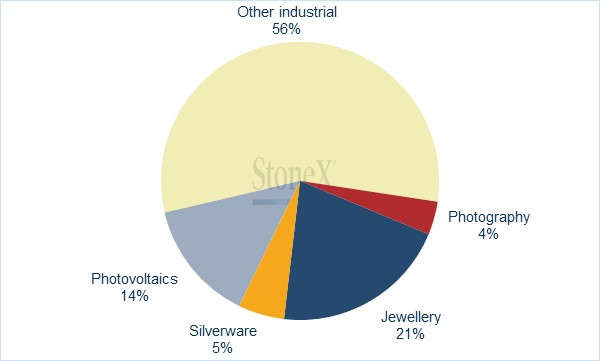
Source: Metals Focus, StoneX
Relationship with copper, gold
So on the basis that silver has as much of an industrial personality as it does as a precious metal, the recent price action is instructive, as is the fact that while gold rebounded from its recent “flash crash” fall with heavy short-covering, silver shorts actually increased.
So here is a summary of the 40-day rolling correlations between silver and gold, and silver and copper, over the short and medium term:
| |
Silver-gold
|
Silver-copper
|
|
Five years
|
0.81
|
0.26
|
|
This year
|
0.80
|
0.39
|
|
August
|
0.76
|
0.39
|
Clearly gold holds the upper hand in terms of correlation – but remember that correlation does not equate to direction. The relationship with copper has been closer this year than over the past five years as silver has underperformed gold due to caution over the economic outlook, which has been exacerbated by the dislocation in the electronics sector (which is of course itself covid-related).
Relative performance
|
% change
|
Silver
|
Gold
|
Copper
|
|
Five years
|
25.6
|
35.3
|
103.5
|
|
This year
|
-10.8
|
-4.9
|
20.2
|
|
August
|
-7.2
|
-1.7
|
-3.5
|
So the natural conclusion from this and the evidence of market positioning confirms the intuitive one, i.e. that silver has been struggling under morose industrial sentiment, and while it has been buoyed by gold to a degree, the base metals’ influence has been stronger.
So what has this done for the gold:silver ratio and what lies next?
Gold:silver ratio, 2010 to date
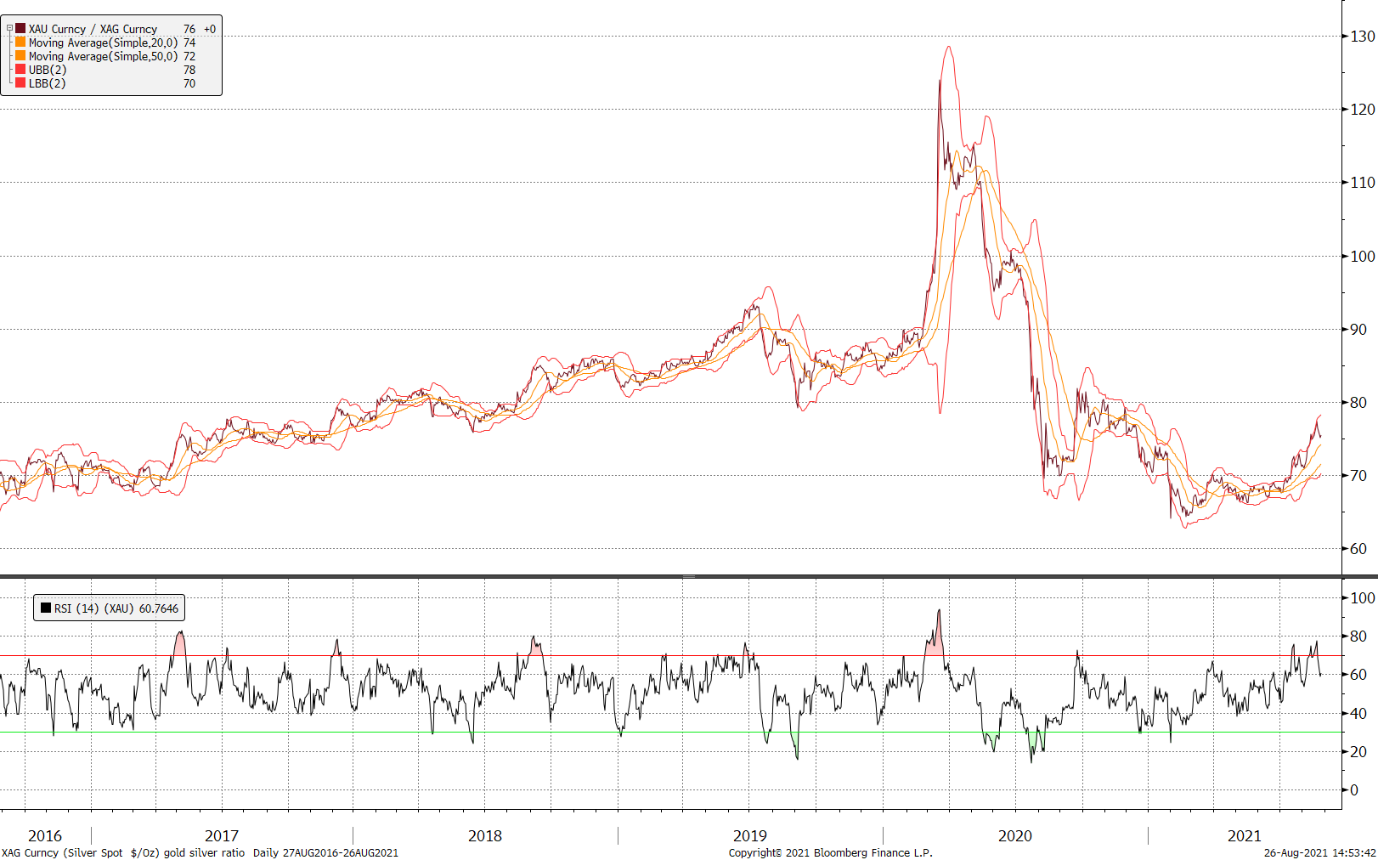
Source: Bloomberg
At the start of this year the gold:silver ratio was just over 70, in retreat from the highs of 124 posted in mid-March 2020 as gold corrected and silver went into meltdown. During that exogenous shock, gold dropped to four-months lows and recovered its losses in just five weeks. Silver crashed to a 10‑ year-11-month low and took almost 20 weeks to unwind the losses. The ratio then bottomed out in mid-February as the next wave of viruses started to take hold and it has more or less been in a bull run ever since. The mid-July to mid-August increases, however, were very sharp as fundamentals took over and the ratio did not start to correct until it was heavily into overbought territory on both Bollinger and Relative Strength Index parameters.
Clearly one can play many tunes with numbers, and “long-term average” is one example. Apart from the semi-whimsical aside that in Biblical times, apparently, the gold:silver ratio was parity, we believe that probably the best time to peg the start of a long-term average measurement is from 1971, when gold and silver had resolved the dislocations forced on them, particularly on gold, by the gold standard for the dollar. On this basis, the long-term average gold:silver ratio is 59. As we write, the ratio Is not just that far away from the average, since the standard deviation over the period is 18.15, meaning that at 76, the ratio is less than one standard deviation from the average.
That, however, is a very long-term assessment and there is virtually no chance at all that the ratio could revert to the long-term mean.
Gold:silver ratio, one-year horizon
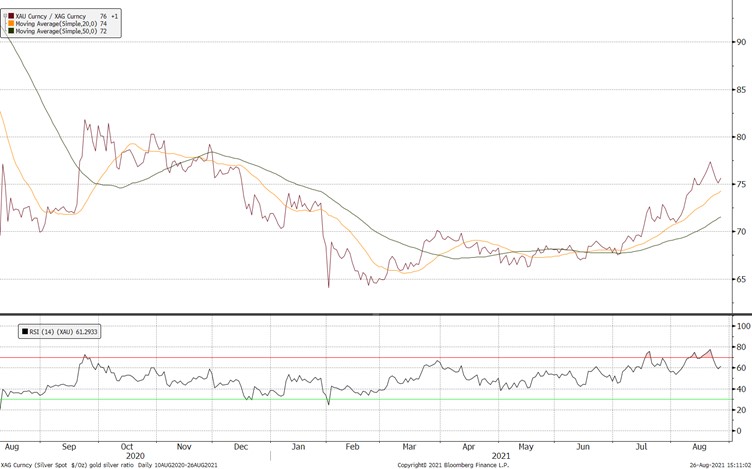
Source: Bloomberg
A more realistic assessment would be from the start of August 2020, once the covid dislocation had worked its way through. On this basis the average ratio is 71.7 and the current ratio is almost exactly one standard deviation from the average. Support stands at 74.3 from the 20D moving average and the 50D average stands at 71.7, with a solid bank of congestion between 66.3 and 68.5.
Back to the fundamentals and the outlook
At 5,983 tonnes (global demand is ~30,000t) the current level of outright silver shorts ion COMEX is the largest since mid-November 2019. On the other side of the market, the persistently low prices of recent weeks have now galvanised physical demand. Interest is picking up in India as the lockdowns ease and some of that pent-up demand returns to the market; there are clear signs of industrial demand building elsewhere (although the electronics sector is struggling the solar cell industry is a particularly important growth area, albeit nowhere near as strong as in the period 2015-2017, when it almost doubled).
Added to this the container shortage that has been hitting other market sectors is also starting to hit silver – in quite a turnaround from a few months ago when there was a mass of by-product silver waiting to come to the market, now it may prove difficult to ship in the quantities that would keep the market flowing completely freely.
So while there is unlikely to be a fundamentally driven price spike in the market, especially given that it is in surplus, the fresh buying interest should help to contain the recent weakness and there is the possibility that there is some volatility ahead of us in the forward markets.
It also suggests that the ratio could be about to retreat further towards the underlying technical support levels.
For a deeper historical study of the gold:silver ratio, please click here.