Below, our analyst team highlights the top trades to watch in 2026 – read on to help you prepare for the new trading year!
US Treasury Yields (Matt Weller)
US Treasury Yields Key Points
- 2026 brings a risk that premature interest rate cuts from a more dovish Federal Reserve could lead to a rise in longer-term Treasury yields (and mortgage rates).
- This phenomenon is called a “bear steepening” of the yield curve, where short-term interest rates remain low or fall but longer-term interest rates nonetheless rise.
- A bullish breakout above ~4.6% in 10yr Treasury yields could target at least 18-year highs in yields just above 5.00%, with potential for a more substantial move if market confidence is truly shaken.
2026 is setting up to be a fascinating year, and my colleagues will be covering their own “Trades to Watch” in the coming year over the next few days.
For my part, I’ll be watching the benchmark 10-year US Treasury yield as at least a key economic indicator and potential trade setup in 2026. The US Treasury market is one of the deepest and most liquid markets on the planet, and it serves as a key indicator of the so-called “risk-free” rate that serves as the basis for all other investments.
Everyone knows that the US Federal Reserve has been cutting interest rates on and off since late 2024, and more easing is expected in the coming year. What some traders don’t realize though is that the Fed’s target Fed Funds rate is specifically related the short-term cost of borrowing, which is why many analysts look at the chart of 2-year yields as a proxy for what the Federal Reserve will do.
Longer-term interest rates, such as the 10- and 30-year Treasury rate is determined more by underlying economic conditions – specifically growth and inflation – than near-term expectations over those periods.
With real-estate-investor-turned-President Donald Trump set to nominate a dove to take over as Chairman of the Federal Reserve in Q2, most are (reasonably) anticipating 2-3 more interest rate cuts by the end of 2026. Indeed, Trump himself made the following proclamation in mid-December: “I will soon announce our next chairman of the Federal Reserve, someone who believes in lower interest rates by a lot, and mortgage payments will be coming down even further.”
I have few doubts about the first half of the quote, but there’s a (substantial in my view) risk that continued interest rate cuts could actually lead to a rise in longer-term yields and mortgage rates if the market deems them premature. If the Fed makes a policy error by cutting interest rates below the “neutral” level with inflation remaining above its target, it could paradoxically lead to higher long-term interest rates, as traders price in the risk of more substantial inflation down the road.
In bond trader parlance, this phenomenon is called a “bear steepening” of the yield curve, where short-term interest rates remain low or fall but longer-term interest rates nonetheless rise. Because the 10-year Treasury yield is used as the risk-free rate that all other investments are measured against, such a development may be seen as bearish for major US indices (especially housing-related stocks as mortgage rates rise) and, potentially, the US dollar.
There’s admittedly plenty of projection in the above analysis, but at a minimum, readers should be wary of the risk that a dovish shift at the Federal Reserve could lead to a “surprise” increase in longer-term interest rates in 2026.
US Treasury Yield Technical Analysis: TNX Daily Chart
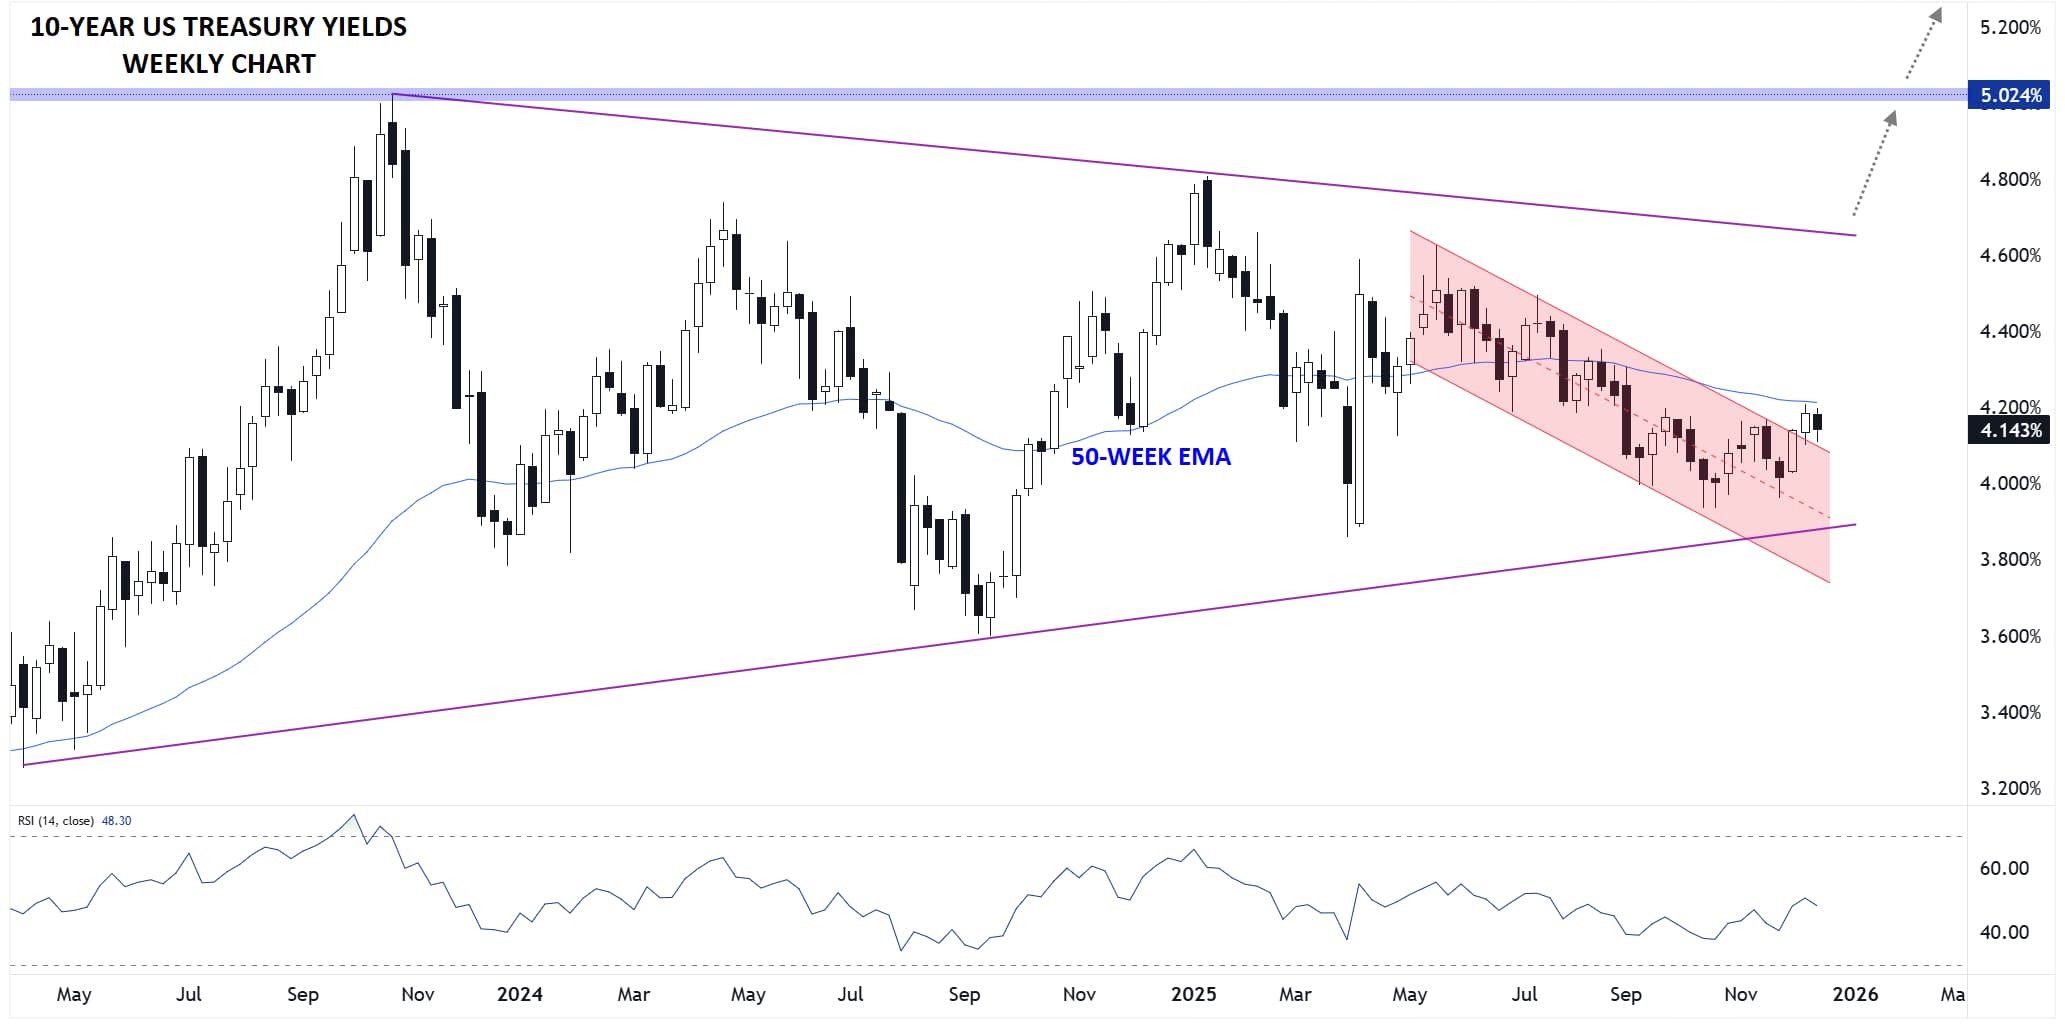
Source: StoneX, TradingView
Looking at the chart of 10-year US Treasury yields, interest rates have put in a series of higher lows and lower highs over the last 2.5 years, creating a textbook symmetrical triangle pattern. This pattern would be confirmed by a breakout beyond the trend line connecting the highs or lows, signaling a likely continuation in the same direction of the breakout.
If the above scenario plays out, a bullish breakout above the upper trend line (currently around 4.6%) would open the door for a move up to at least 18-year highs in yields just above 5.00%, with potential for a more substantial move if market confidence is truly shaken.
-- Written by Matt Weller, Global Head of Research
Check out Matt’s Daily Market Update videos on YouTube and be sure to follow Matt on Twitter: @MWellerFX
USD/JPY (Julian Pineda)
Toward the end of 2025, USD/JPY continues to show consistent bullish bias, remaining near the highs of the year. Part of this weakness in the Japanese yen can be explained by its low interest rate, one of the lowest among major central banks globally. However, recent economic dynamics suggest that the Bank of Japan (BOJ) may begin adjusting its monetary policy stance, which could eventually support a more stable strengthening of the yen during 2026.

What Could the BOJ’s New Stance Look Like?
Currently, the BOJ’s interest rate is significantly lower than that of other major central banks, making it difficult for the yen to regain ground against other currencies. Such low rates make Japanese fixed-income investments less attractive, which limits demand for yen.
At the time of writing, the BOJ plans to end 2025 with a rate of 0.75%, higher than the 0.5% maintained through most of the year, but still far below its peers: the United States (3.75%), Canada (2.25%), and the European Union (2.15%). In comparative terms, the yen remains one of the least competitive currencies for fixed-income investors.
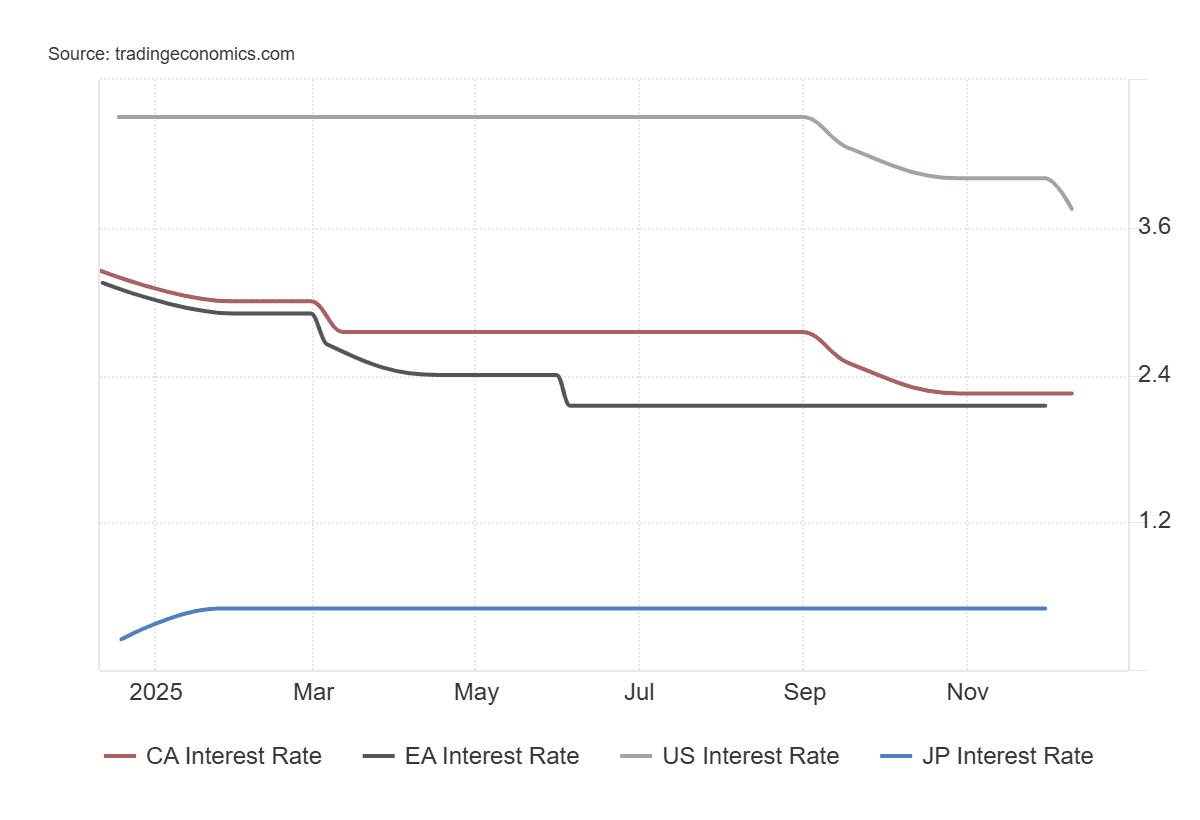
Source: TradingEconomics
Looking ahead to 2026, the BOJ could enter the year as one of the few central banks expected to raise interest rates, moving from the stable 0.5% level to the new 0.75%. This shift is mainly due to one of the pillars of its monetary policy — inflation — no longer being temporary and beginning to show greater persistence.
After reaching an annual low of 2.7% in August, inflation climbed to 3.0% in October, once again moving away from the 2% target. This demonstrates that inflationary pressures have become significant again and could become a serious issue if the BOJ decides to maintain excessively low rates in 2026.
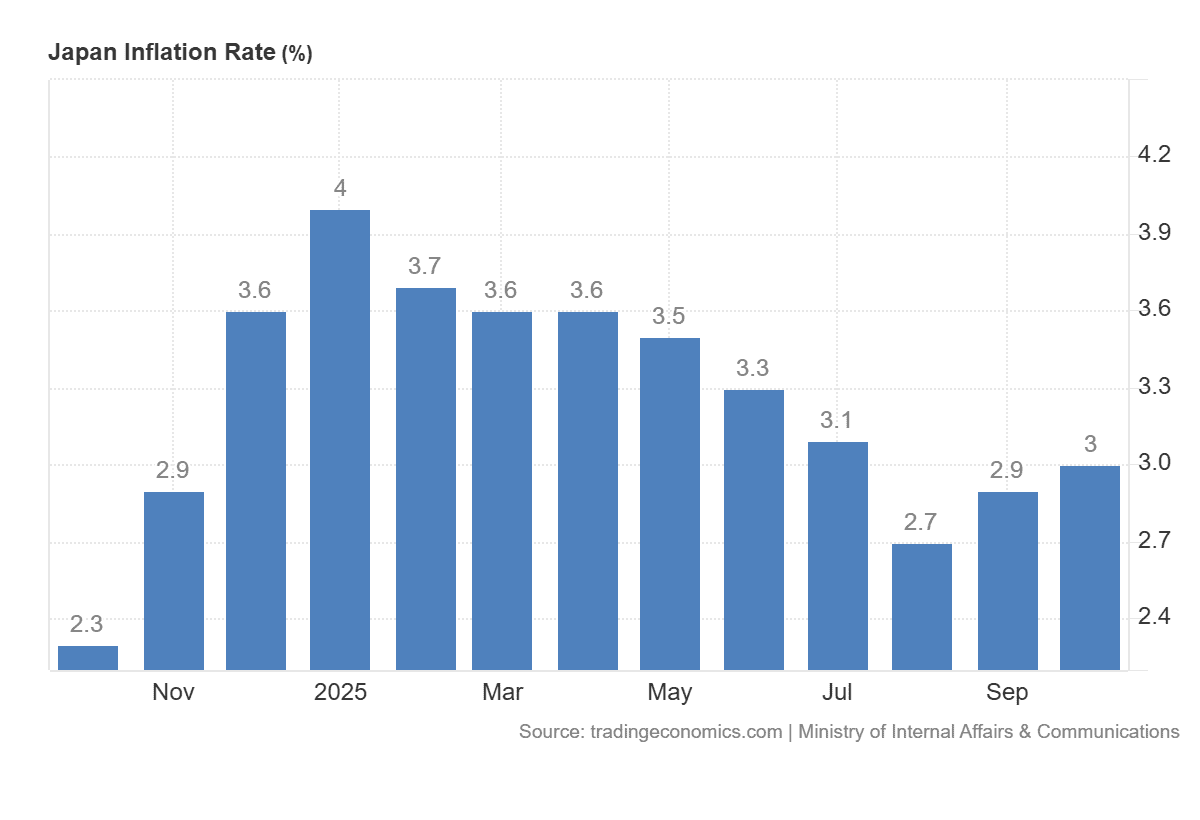
Source: TradingEconomics
Additionally, wage growth in Japan is at one of its highest levels in the past three decades. At the end of 2024, the average increase was 3.6%, and by the end of 2025 it is expected to exceed 4.0%. If this trend continues, it could drive greater domestic consumption, further pushing up prices and fueling inflationary pressures in 2026.
Another important factor is that the prolonged weakness of the yen has become both an economic and political issue. Officials within the government and the BOJ have noted that a weak yen raises the cost of imports, which eventually pushes up domestic prices. Prime Minister Sanae Takaichi recently stated that, aside from pro-growth policies expected for 2026, yen weakness remains one of the main risks for the Japanese economy. This suggests that, along with potential government support measures for the currency, the BOJ may need to step away from its ultra-loose monetary stance and move toward policy normalization to strengthen the yen.
Considering all this, the 2026 outlook points to a yen that begins the year relatively weak but with increasing potential for recovery if the BOJ begins implementing rate hikes. As one of the only central banks likely to raise rates in 2026, Japan could see sustained improvements in yen demand, encouraging greater investor interest. This could produce a bearish bias in USD/JPY, especially if the Federal Reserve confirms that it will maintain neutral or even lower rates in 2026, making it more difficult for the dollar to hold its ground.
Technical Outlook for USD/JPY in 2026
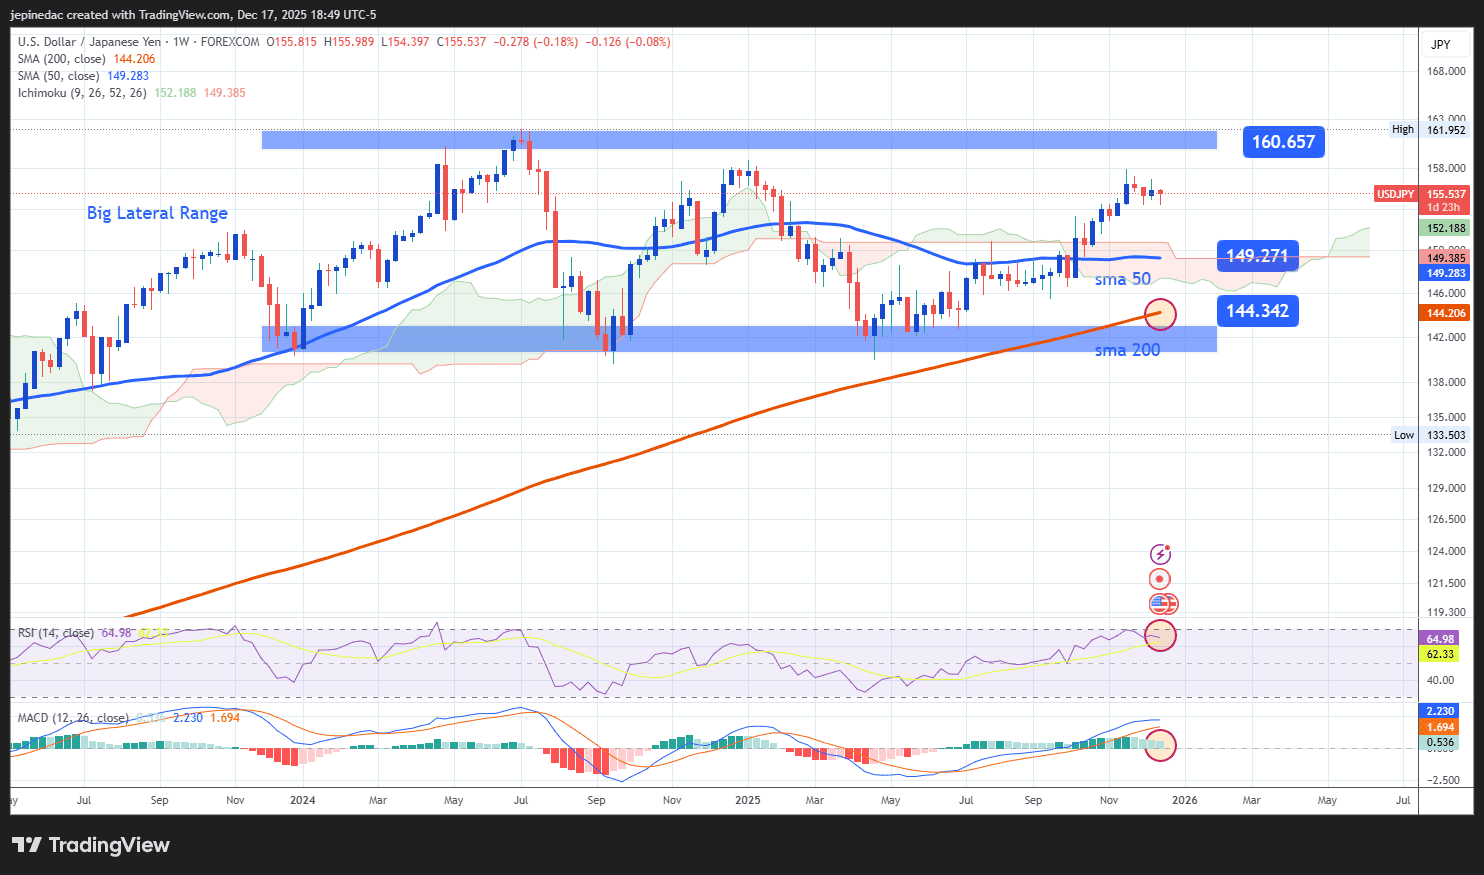
Source: StoneX, Tradingview
- The Large Lateral Range Remains Intact: Since January 2024, USD/JPY has traded within a broad sideways range between the upper boundary at 160 yen per dollar and the lower boundary near 140 yen per dollar. Despite the dollar’s recovery against the yen in 2025, the bullish momentum still appears insufficient to break out of this dominant range. Even when price attempted to approach levels not seen since June 2024, it quickly encountered renewed weakness, reinforcing the resilience of this lateral structure. If the neutrality observed in the last weeks of 2025 persists, the bullish bias that dominated much of the year could be at risk entering the first quarter of 2026.
- RSI: The RSI has begun showing a downward slope, suggesting that average bullish momentum has weakened during the final weeks of 2025. If this behavior continues into early 2026, it could pave the way for stronger selling pressure, favoring the yen and increasing downward momentum in USD/JPY.
- MACD: The MACD histogram maintains consistent declines toward the zero line, signaling weakening strength in the weekly moving averages. If this structure continues, it could indicate the emergence of stronger bearish pressure heading into 2026.
Key Levels:
- 160.600 – Key Resistance: A level not seen since 2024, marking the upper boundary of the large lateral range. A move into this zone could revive a more dominant bullish bias and allow the development of a more structured uptrend for 2026.
- 149.271 – Nearby Barrier: This zone is aligned with the 50-period simple moving average on the weekly chart. A return to this level could mark the end of the bullish momentum that prevailed through much of 2025, opening the door to a period of indecision within the broader range.
- 144.300 – Main Support: This level corresponds to the 200-week moving average and represents an inflection point for price strength. Bearish movements that revisit this area could trigger a shift in momentum, allowing a more substantial downtrend to begin forming in favor of the yen during 2026.
Written by Julian Pineda, CFA, CMT – Market Analyst
Follow him at: @julianpineda25
The Nasdaq 100 (Matt Simpson)
The Nasdaq 100 enters 2026 in a mature bull market rather than at the start of a new cycle. While the longer-term trend remains intact, a growing cluster of technical, breadth and earnings-related signals suggests the balance of risks has shifted toward a correction rather than a continuation of the recent rally.
Importantly, this is not a bearish call on technology stocks or the Nasdaq’s secular trend. Instead, the setup points to a more typical late-cycle adjustment — one driven by earnings and guidance risk rather than macro stress — before dip buyers are likely to re-emerge later in the year.
2026 Base Case: Nasdaq Correction Before Trend Resumption
- A Nasdaq 100 correction in 2026 is more likely to be earnings-led than macro-driven, with Q1 and Q3 posing the highest risk as AI expectations collide with delivery timelines.
- Historical drawdowns suggest a 5–10% pullback is the most probable outcome, with a smaller but non-trivial risk of a deeper 10–20% correction in the event of sharper earnings disappointment.
- Breadth has improved beneath the surface, but rising NGX/NDX signals point to a maturing, late-cycle rally rather than a fresh acceleration phase.
- Index direction remains highly dependent on a narrow group of mega-cap stocks, where any loss of leadership could exert an outsized drag on the Nasdaq 100.
Nasdaq 100 Correction Risk After a Prolonged Uptrend
Love it or loathe it, the long-term chart of the Nasdaq shows the index remains in a secular uptrend, albeit one punctuated by periodic drawdowns and sharp sell-offs. There are no extreme readings from longer-term breadth indicators, such as the percentage of stocks trading above their 50- and 200-month moving averages.
While weekly price action has become increasingly choppy and hints at the development of an ABC-style correction, there is little evidence to suggest a major secular top is forming in the absence of a genuine black swan event.
Ultimately, I expect dips to continue to be bought through 2026, allowing the broader bullish trend to reassert itself and push to new highs by year end.
That said, the Nasdaq 100 may already be entering — or be close to entering — a more meaningful corrective phase.
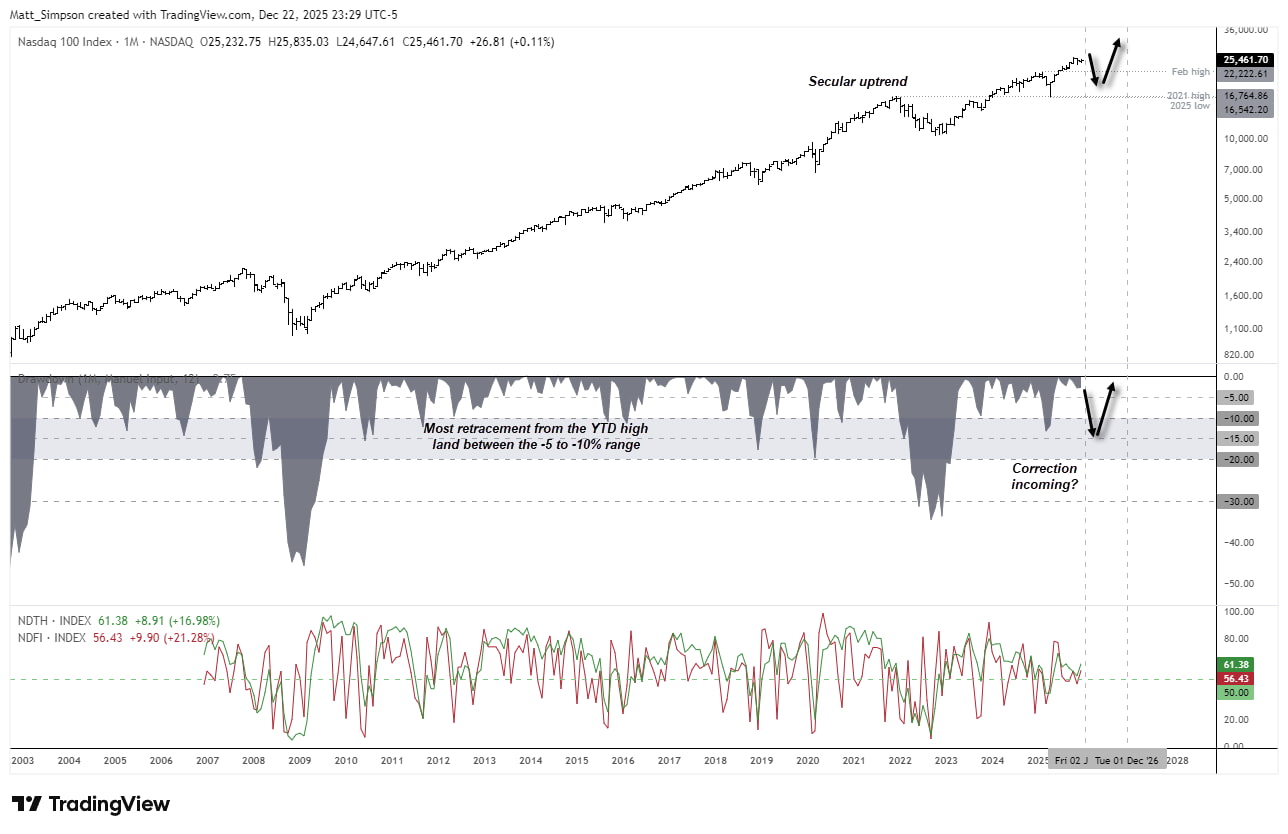
Chart analysis by Matt Simpson, Source: TradingView, Nasdaq
10–20% Retracement Risk: What History Suggests
The lower indicator shows the percentage drawdown from the prior 12-month high, helping to distinguish major sell-offs from more routine corrections while also highlighting their frequency. Unsurprisingly, the largest declines occurred during the dot-com bust, but the focus here is on smaller pullbacks, which are statistically far more common.
Since 2003, the vast majority of Nasdaq corrections have been less than 10%. Only thirteen have exceeded 10%, and just two extended beyond 20%. Barring a major shock, this suggests any pullback in 2026 is more likely to fall in the 5–10% range, with a smaller risk of a deeper 10–20% correction.
Nasdaq 100 Technical Analysis: Key Correction Levels
The weekly chart suggests an ABC-style correction may already be underway. Retracement levels have been plotted using December’s current high as the assumed year-to-date peak, helping identify areas where any pullback could stall.
Notably, the February high aligns closely with the 38.2% Fibonacci retracement, sitting just below the 10% drawdown zone. This places the ~22,300 area as a plausible near-term target for bears, or a zone where bulls may look to buy dips later in the year.
In the event of a sharper sell-off, a deeper correction of around 20% would bring prices towards the 50–61.8% Fibonacci retracement zone, clustered just above the 20,000 level.
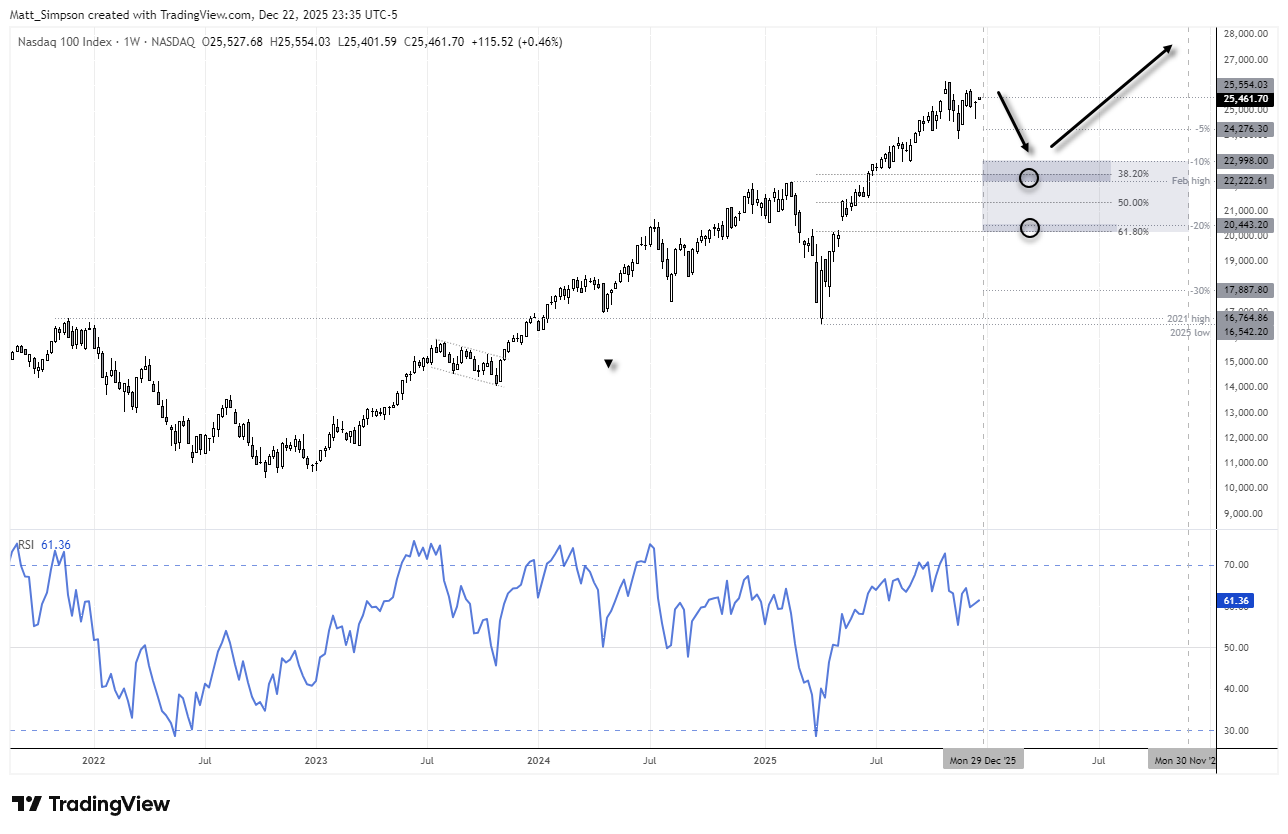
Chart analysis by Matt Simpson, Source: TradingView, Nasdaq
Breadth Signals a Maturing Nasdaq 100 Rally
The Nasdaq 100 Next Generation Index (NGX) tracks the next tier of technology companies that sit just below the top 100 by market capitalisation. Notably, the NGX is trading at record highs ahead of the Tech 100, while the NGX/NDX ratio has started to turn higher — a combination that often appears during the later stages of an equity rally.
The NGX/NDX ratio formed a prominent trough in July 2024 and has since carved out a double bottom and higher lows through H2 2025. While this does not necessarily signal an imminent downturn for the Nasdaq 100, it does suggest the index is no longer the clear leader, pointing instead to a loss of momentum and a maturing, late-cycle expansion.
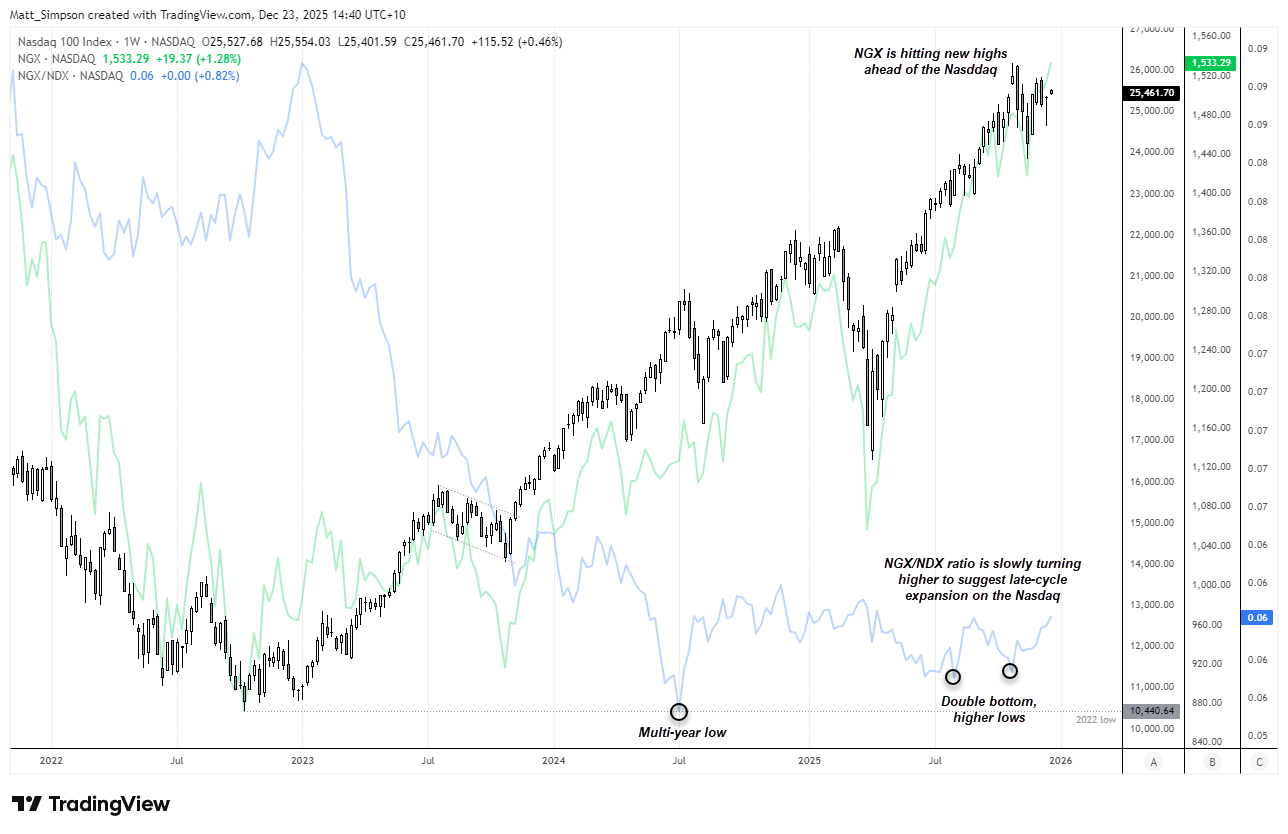
Chart analysis by Matt Simpson, Source: TradingView, Nasdaq
Nasdaq Q4 Earnings Season Is One to Watch
Q1 looks a potential hotspot for optimism to be challenged, as it coincides with full-year guidance resets. By early 2026, AI investment cycles will be well understood, while monetisation remains uneven. That creates a scenario where companies can beat near-term earnings yet still disappoint on outlook.
With valuations still elevated early in the year, even cautious guidance revisions could trigger analyst downgrades, rotation out of crowded AI leaders, and a broader Nasdaq pullback. Historically, this is when expectations adjust fastest — and most painfully.
Ultimately, the Nasdaq does not need earnings misses to trigger a sell-off; softer guidance alone may suffice. While breadth has improved beneath the surface, Nasdaq direction in 2026 remains highly dependent on a narrow group of mega-cap stocks
Nasdaq 100 Outlook: Mega-Cap Stocks Driving Index Direction
The Nasdaq 100 remains dominated by a small group of mega-cap stocks that continue to dictate index direction. However, with several of these leaders now showing late-cycle technical signals, any loss of momentum at the top could have an outsized impact on the index — even as broader participation improves beneath the surface.
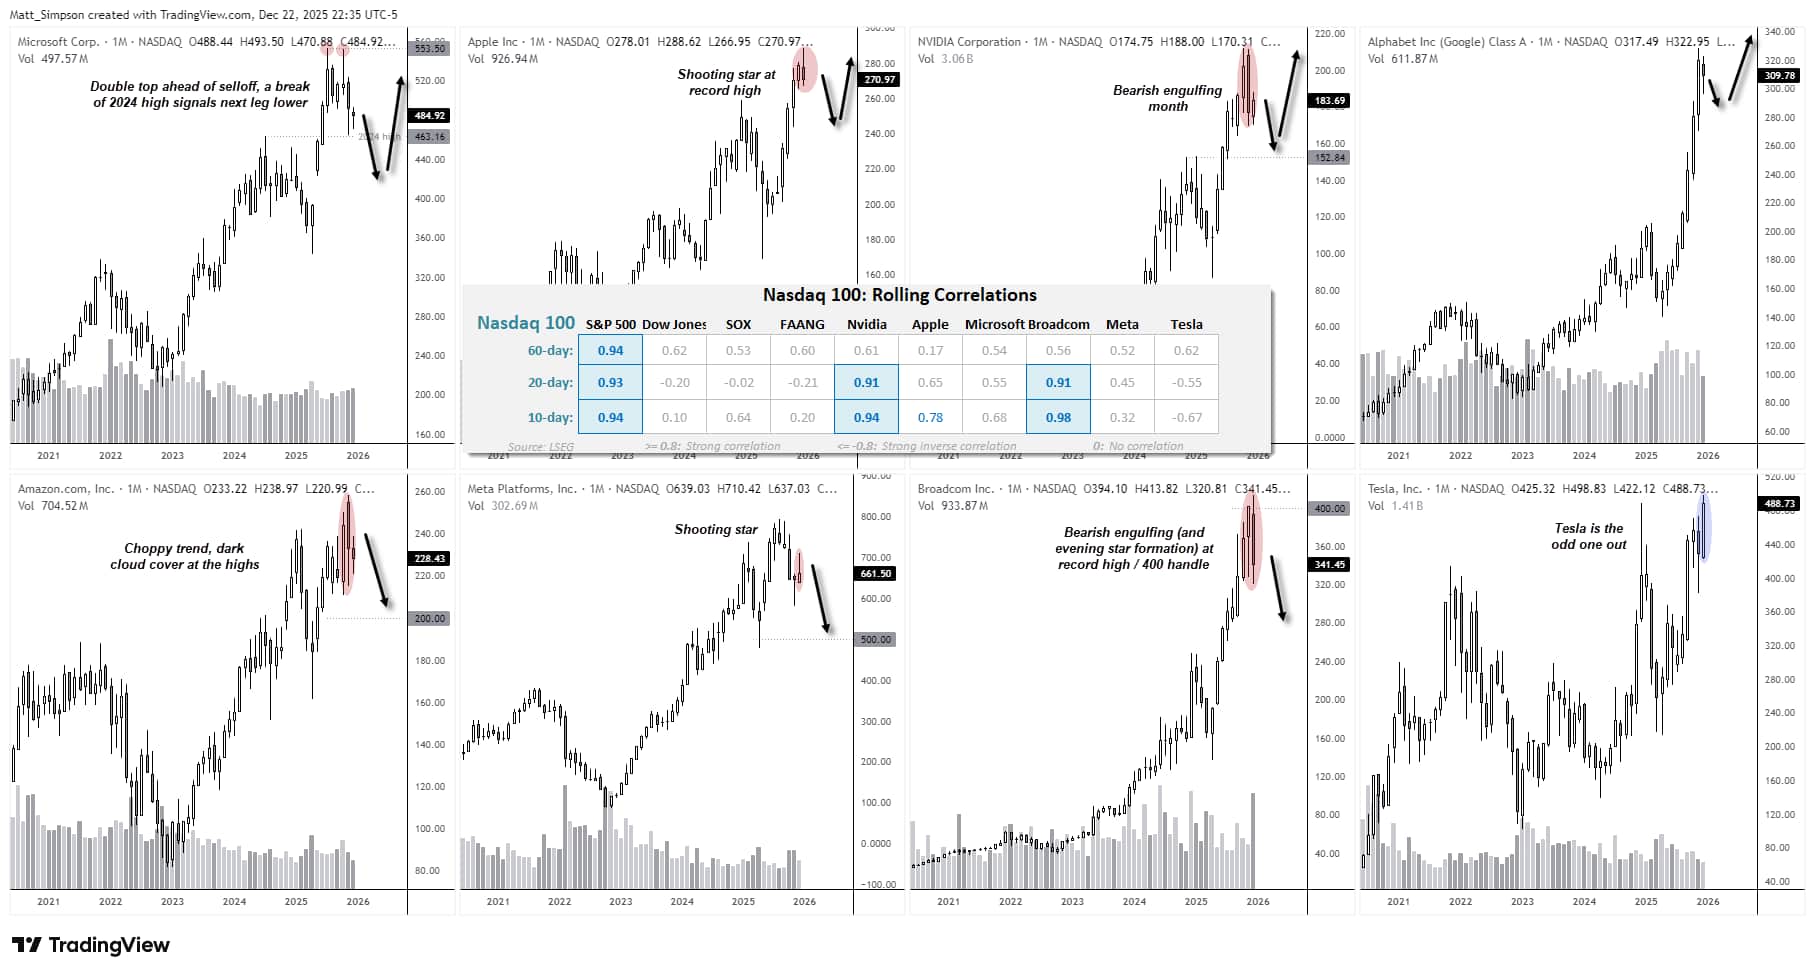
Chart analysis by Matt Simpson, Source: TradingView, NYSE
Microsoft (MSFT) – Nasdaq Leadership at Risk?
A potential double top has formed on Microsoft’s monthly chart at record highs, with the second peak marked by a shooting star reversal. A bearish engulfing candle followed in November, while December printed an inside month. A break below the 2024 high would signal scope for a deeper pullback and raise broader concerns for the wider technology sector, given Microsoft’s outsized influence on the Nasdaq 100.
Key earnings dates for MSFT:
- Q4 2025: late January 2026
- Q1 2026: late April 2026
- Q2 2026: late July 2026
- Q3 2026: late October 2026
Apple (AAPL) – Defensive Leader Losing Momentum
Apple’s share price has benefited from its decision to scale back AI investment at a time when investors are increasingly questioning sector-wide valuations. However, after a six-month rally, Apple printed a shooting star on the monthly chart in December near record highs. Volume has also been trending lower, suggesting a gradual deterioration in investor participation despite rising prices.
Key earnings dates for AAPL (expected):
- Q4 2025: early February 2026
- Q1 2026: early May 2026
- Q2 2026: late July / early August 2026
- Q3 2026: early November 2026
NVIDIA (NVDA) – AI Momentum Under Scrutiny
Nvidia continues to attract scrutiny around valuation and positioning following its outsized rally. While the longer-term trend remains intact, the pace of gains suggests a meaningful pullback would not be unusual. Prices have continued to rise even as volumes trend lower, while November’s bearish engulfing candle — despite lacking a volume spike — highlights elevated volatility at record highs after an extended move. That combination warrants caution for bulls and Nasdaq traders alike.
Key earnings dates for NVDA (expected):
- Q4 2025: mid–late February 2026
- Q1 2026: late May 2026
- Q2 2026: late August 2026
- Q3 2026: mid–late November 2026
Alphabet (GOOGL) – Consolidation Risk After Strong Run
This is not a stock I would personally look to short, but I would be wary of being too aggressively long after such a strong rally. Alphabet advanced for eight consecutive months into its November record high before printing a bearish inside month in December. The subdued volumes during December suggest this may simply represent a pause within the broader uptrend rather than a decisive reversal signal. Even so, it adds to a growing list of Nasdaq mega-cap stocks hinting at potential weakness, at least through the first quarter.
Key earnings dates for GOOGL:
- Q4 2025: late January / early February 2026
- Q1 2026: late April 2026
- Q2 2026: late July 2026
- Q3 2026: late October 2026
Amazon (AMZN) – Rally Vulnerable to Fading
Amazon has recently been on my short watchlist, although without a broader market downturn it appears unlikely to break decisively below 200 in the near term. Price action has turned choppy, and the stock failed to convincingly clear its February high when it rallied in October. A two-bar bearish reversal (dark cloud cover) formed in November, leaving a bias for rallies to be faded, at least towards the 200 area.
Key earnings dates for AMZN:
- Q4 2025: early February 2026
- Q1 2026: late April / early May 2026
- Q2 2026: late July 2026
- Q3 2026: late October 2026
Meta Platforms (META) – Momentum Fades at Highs
While Meta had previously been on my long watchlist, bearish momentum returned once prices reached my bullish target near 700. A shooting star has since formed on the monthly chart, increasing the risk of at least one further leg lower, particularly if broader Nasdaq momentum continues to cool.
Key earnings dates for META:
- Q4 2025: late January / early February 2026
- Q1 2026: late April 2026
- Q2 2026: late July 2026
- Q3 2026: late October 2026
Broadcom (AVGO) – Key Nasdaq Correlation Warning
Broadcom shows one of the strongest correlations with the Nasdaq among AI-related stocks, making its price action particularly important. The stock printed a bearish outside month in December on elevated volume, signalling a meaningful shift in sentiment towards sellers. Should Broadcom struggle in 2026, it would raise broader concerns for the Nasdaq 100’s resilience.
Key earnings dates for Broadcom:
- Q4 2025: early March 2026
- Q1 2026: early June 2026
- Q2 2026: early September 2026
- Q3 2026: early December 2026
Tesla (TSLA) – Speculative Sentiment Barometer
Tesla stands out as the only stock in this group to close at a record high in December on the monthly chart. If there is cause for caution, it lies in the fact that the rally from the April low occurred alongside declining volume. Prices have only marginally traded above the 2024 high, while 500 now looms as a key resistance level.
Key earnings dates for Tesla:
- Q4 2025: late January 2026
- Q1 2026: mid–late April 2026
- Q2 2026: late July 2026
- Q3 2026: mid–late October 2026
-- Written by Matt Simpson
Follow Matt on Twitter @cLeverEdge
Crude Oil and Bitcoin (Mike Boutros)
Oil Prices Spills into 2026- Bitcoin Buyers on Hold, for Now
- A purely technical view on Oil prices and Bitcoin – threats remains lower but exhaustion risk mounts
- WTI plunges more than 22% in 2025 – technical downtrend remains intact into yearly cross
- Trend support now in view- risk for oil price inflection early in the year
- Bitcoin break of multi-year uptrend threatens larger correction-hits lowest momentum read since 2022
- BTC/USD four-year cycle threatens deeper setbacks but focus shifts to potential exhaustion-low in first half of 2026
Oil Price Chart – WTI Weekly
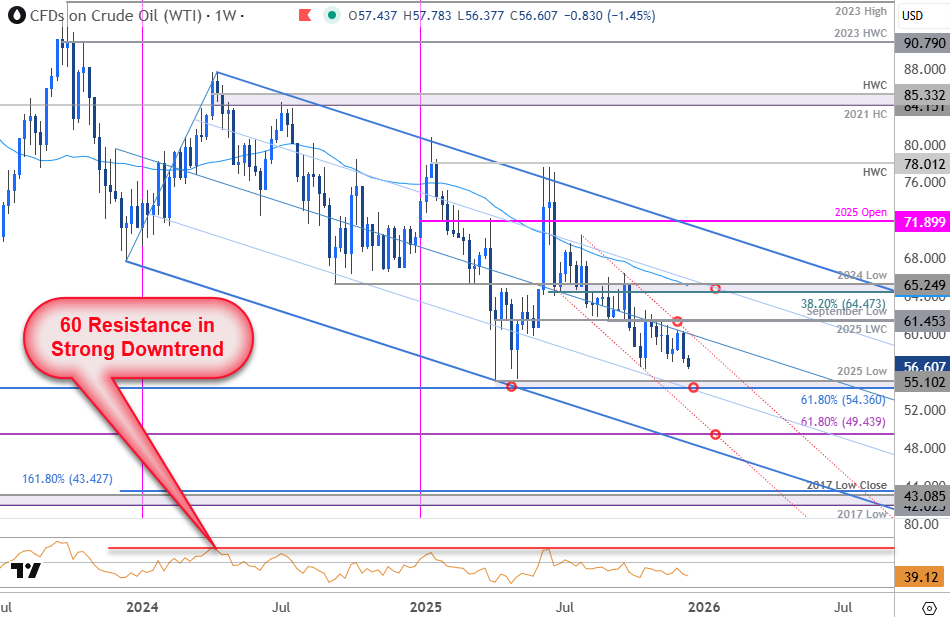
Chart Prepared by Michael Boutros, Technical Strategist; WTI on TradingView
Oil prices have continued to trade within the confines of a multi-year downtrend with the decline respecting this pitchfork extending off the 2024 high. Note that weekly RSI has remained below 60 on every recovery since and keeps the momentum profile tilted to the downside into 2026.
Initial weekly support is now seen at the 54.36-55.10- a region defined by the 2025 swing low and the 61.8% extension of the 2022 decline. Note that the 25% parallel converges on this threshold into the yearly cross and a break / weekly close below will be needed to fuel the next major leg of this decline.
Subsequent support is seen at the 61.8% retracement of the 2020 advance at 49.44 and 42.02-43.42- a region defined by the 2017 low / low-close and the 1.618% extension off the 2023 decline. Both regions of interest for possible downside exhaustion / price inflection IF reached.
Resistance is eyed at the September low and the 2025 low-week close (LWC) at 61.43/45. Broader bearish invalidation stands at 64.47-65.25- a region defined by the 38.2% retracement, the 52-week moving average, and the 2024 swing low. A breach / close above this threshold would be needed to suggest a more significant low is in place / a larger trend reversal is underway.
Bottom line: Be on the lookout for a potential exhaustion low heading into the first half of 2026. From a trading standpoint, look to reduce short-exposure / lower protective stops on a stretch towards the lower parallel- rallies should be limited to 61.45 IF price is heading for a break lower on this stretch with a close below 54.36 needed to fuel the next major leg of this decline.
Bitcoin Price Chart- BTC/USD Weekly
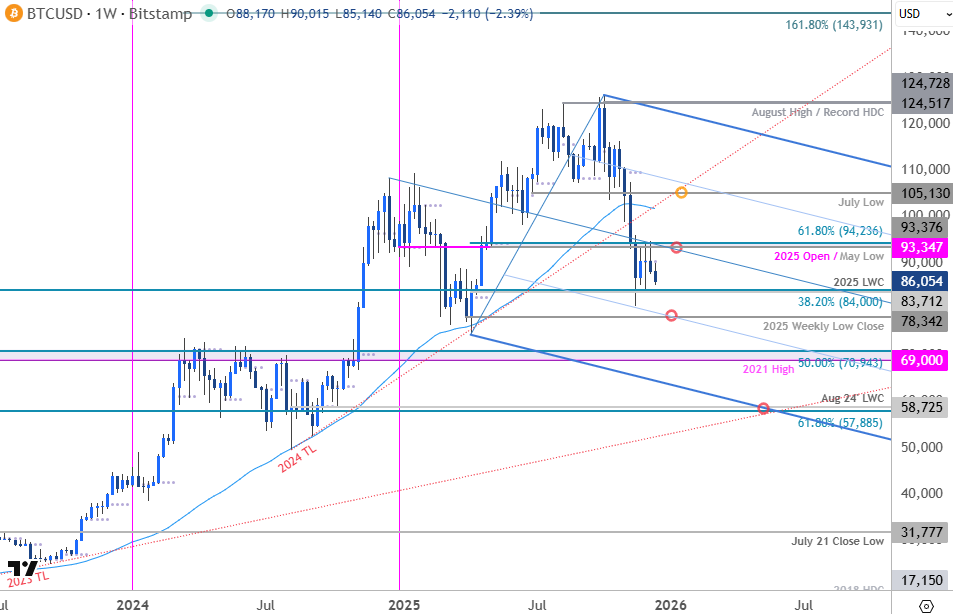
Chart Prepared by Michael Boutros, Sr. Technical Strategist; BTC/USD on TradingView
Bitcoin plunged more than 36% off the record highs registered in October with BTC/USD poised to close the year down nearly 7.7%. A break below a key pivot zone in November leaves the outlook tilted to the downside into the yearly cross but the focus is on a potential exhaustion low in the first half of 2026.
Initial weekly support objectives rests with the 2025 low-week close (LWC) and the 38.2% retracement of the late 2022 advance at 83,712 / 84,000 and the 2025 weekly close low at 78,342. Note that the 25% parallel of the descending pitchfork converges on this threshold into the start of the year – look for a larger reaction there IF reached with a break / close below risking another bout of accelerated losses. Subsequent support rests with the 2021 high / 50% retracement at 69,000-70,943 and the 61.8% retracement / August 2024 LWC at 57,885-58,725.
Weekly resistance is eyed at 93,347-94,236- a region defined by the 2025 yearly open, the May low, and the 61.8% retracement of the yearly range. Note that the median-line converges on this threshold over the next few months and a breach / weekly close above would be needed to suggest a more significant low is in place and a larger trend reversal is underway. Subsequent resistance is eyed at the 52-week moving average (currently ~101,800) and the July low at 105,130. Strength surpassing this threshold would mark potential resumption of the multi-year uptrend towards objectives at the August high / record high-day close (HDC) at 124,517 and the 1.618% extension of the 2022 advance at 143.931.
Bottom line: Record capital outflows suggest a larger shift in sentiment, and the threat remains tilted lower heading into next year. The four-year cycle is in full-swing and while previous cycles saw declines of 80% plus, the evolving macro backdrop may limit the extent of the decline- look for greater regulatory clarity, lower rates, and broader adoption to possibly cap this spill next year.
From a trading standpoint, a larger decline here may offer more favorable opportunities closer to trend support. Look for signs of downside exhaustion / price inflection on a stretch towards the lower parallel with a breach above the 52-week moving average ultimately needed to put the bulls back in control.
--- Written by Michael Boutros, Senior Market Analyst
Follow Michael on X @MBForex
The Dow Jones Industrial Average (Razan Hilal)
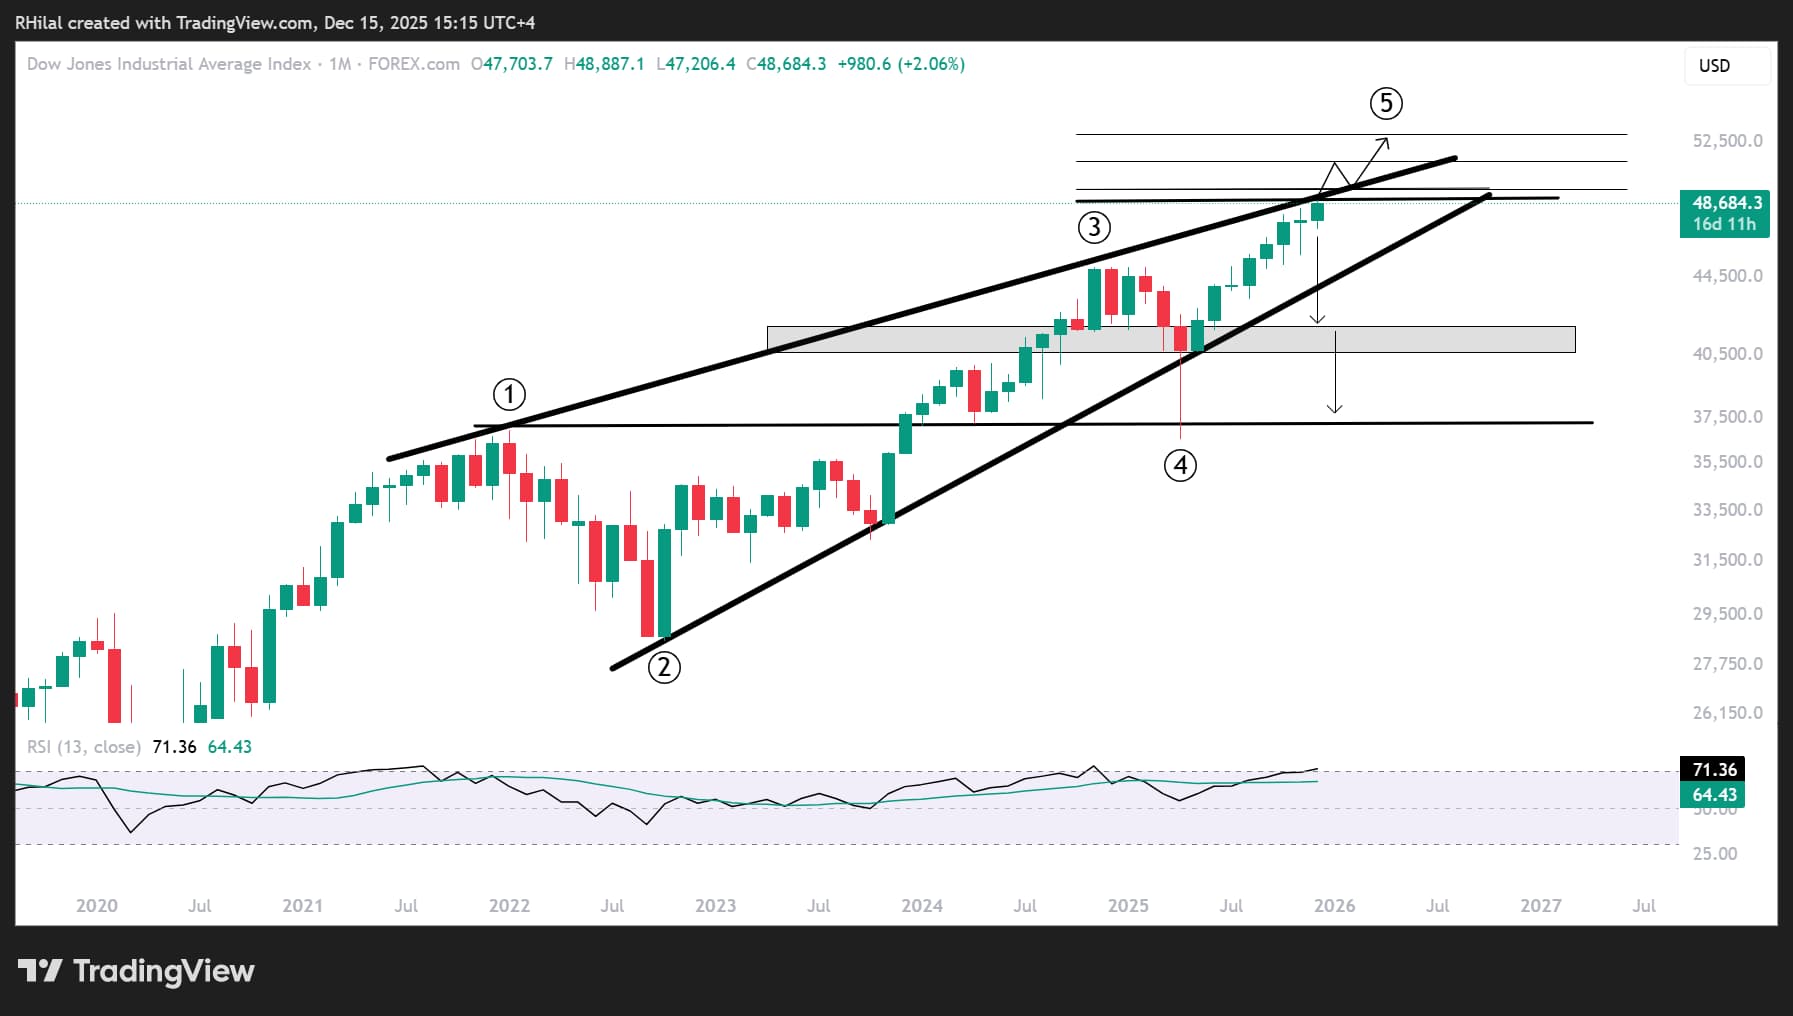
Dow Jones Outlook: Monthly Time Frame – Log Scale
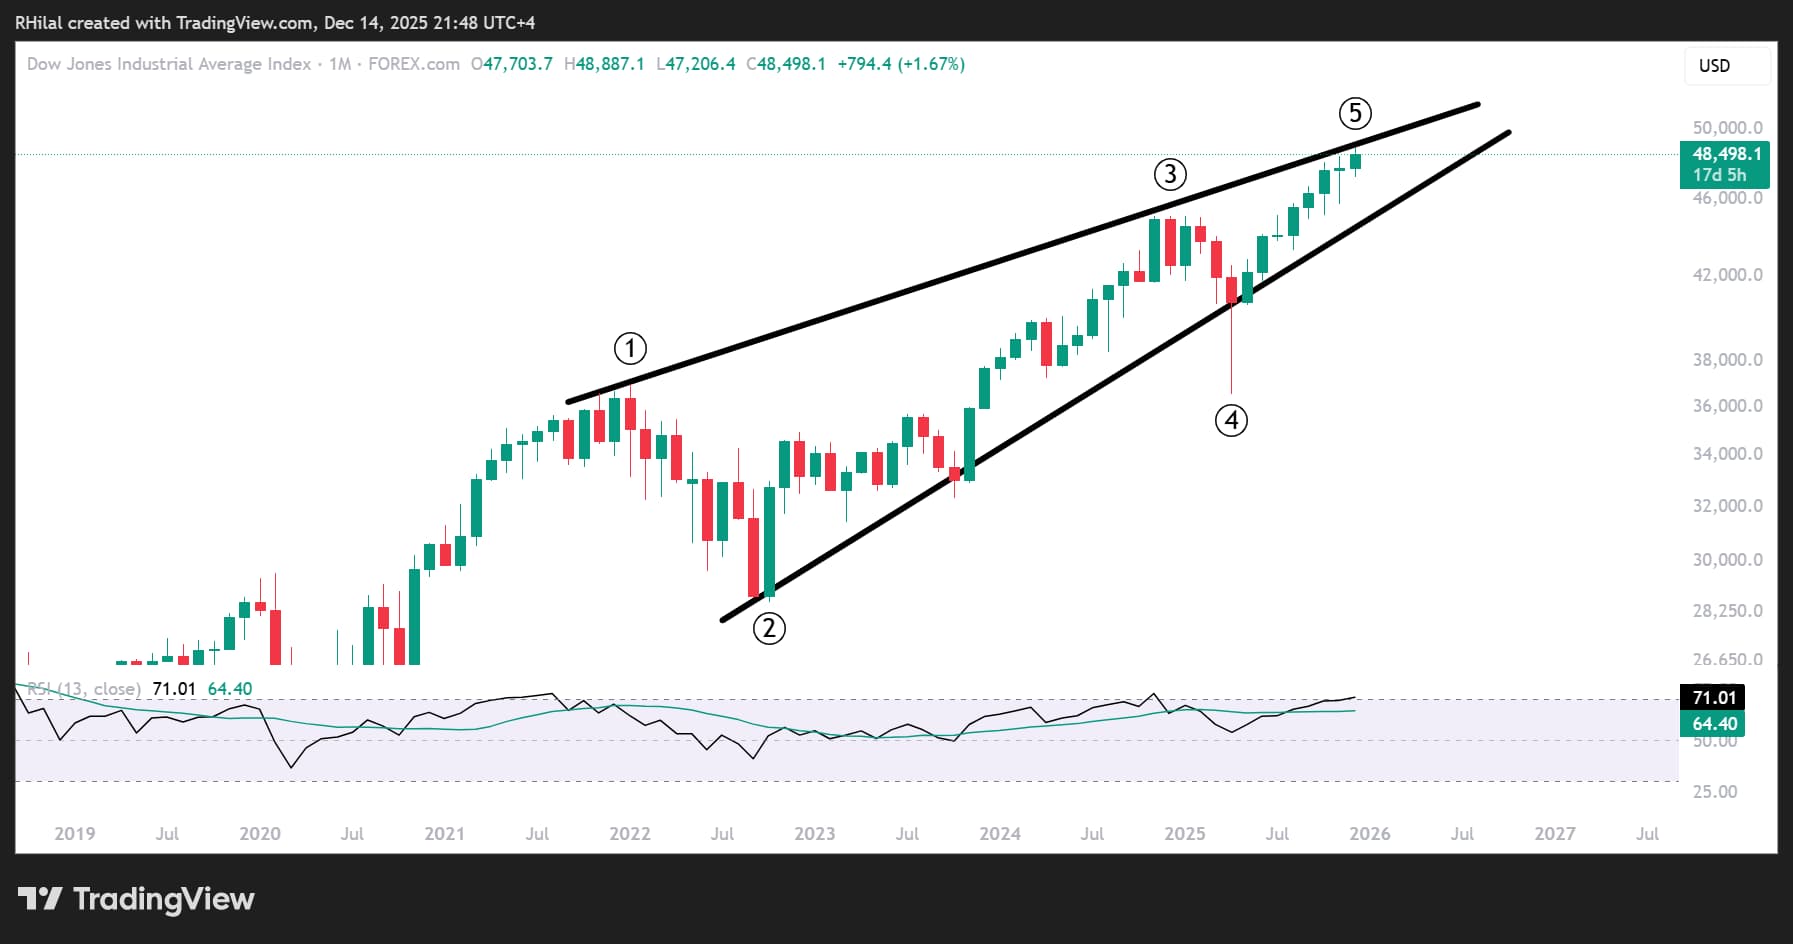
Source: Trading view
After the 2025 tariff-induced decline, U.S. indices rallied more than 30%, reaching unprecedented records in line with dovish policy pressures under the Trump administration and the tech-sector surge.
However, when zooming out to the monthly time frame, a contracting price structure becomes clear, connecting the consecutive higher highs of January 2022, November 2024, and now December 2025. This diagonal-like formation presents risks of steep scenarios ahead as the Dow approaches the 50,000-checkpoint.
Dow Jones Outlook: Monthly Time Frame – Log Scale
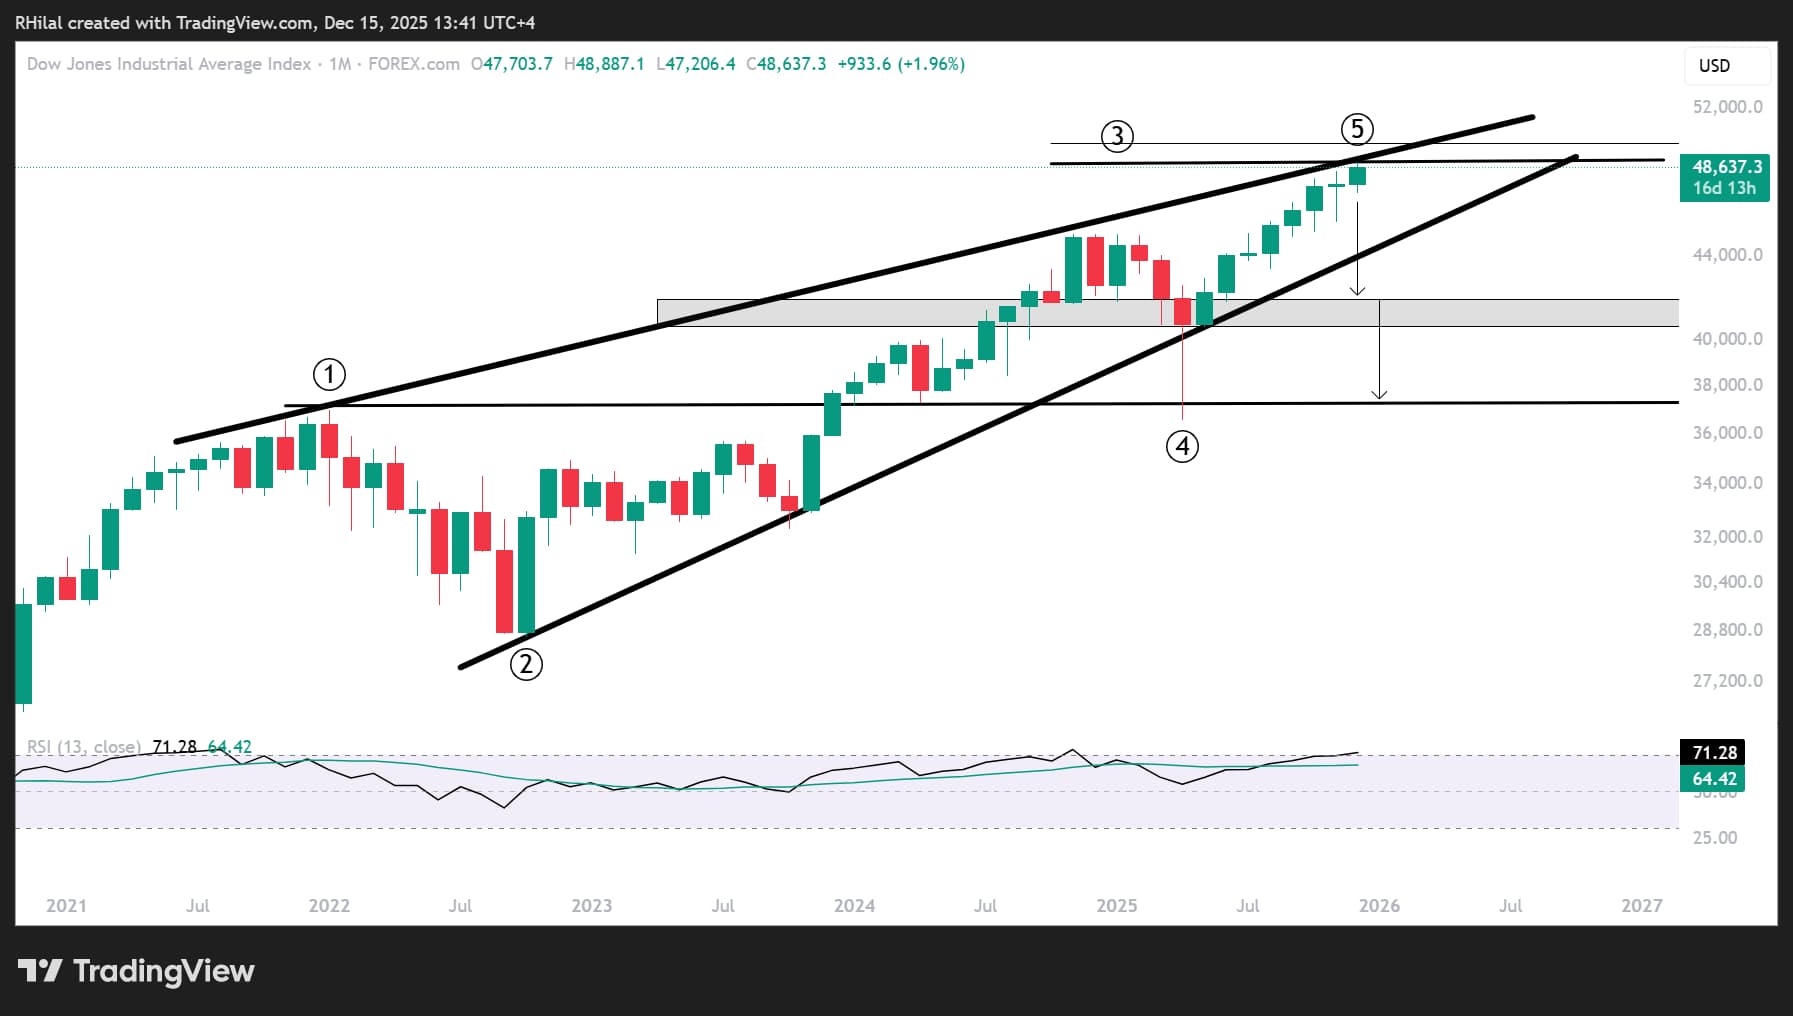
Source: Trading view
Bearish Scenario:
If the pattern plays out as a diagonal, a steep corrective phase would be expected, consistent with diagonal characteristics, with key downside levels highlighted around 45,000, 41,700, 40,700, and 37,000, offering potential buy-the-dip opportunities.
Should this scenario unfold, markets may shift into risk-off mode, especially if policy fatigue or trend exhaustion emerges during the second year of a new presidency — a phase that historically reflects a brief market cooldown before a new bullish cycle resumes.
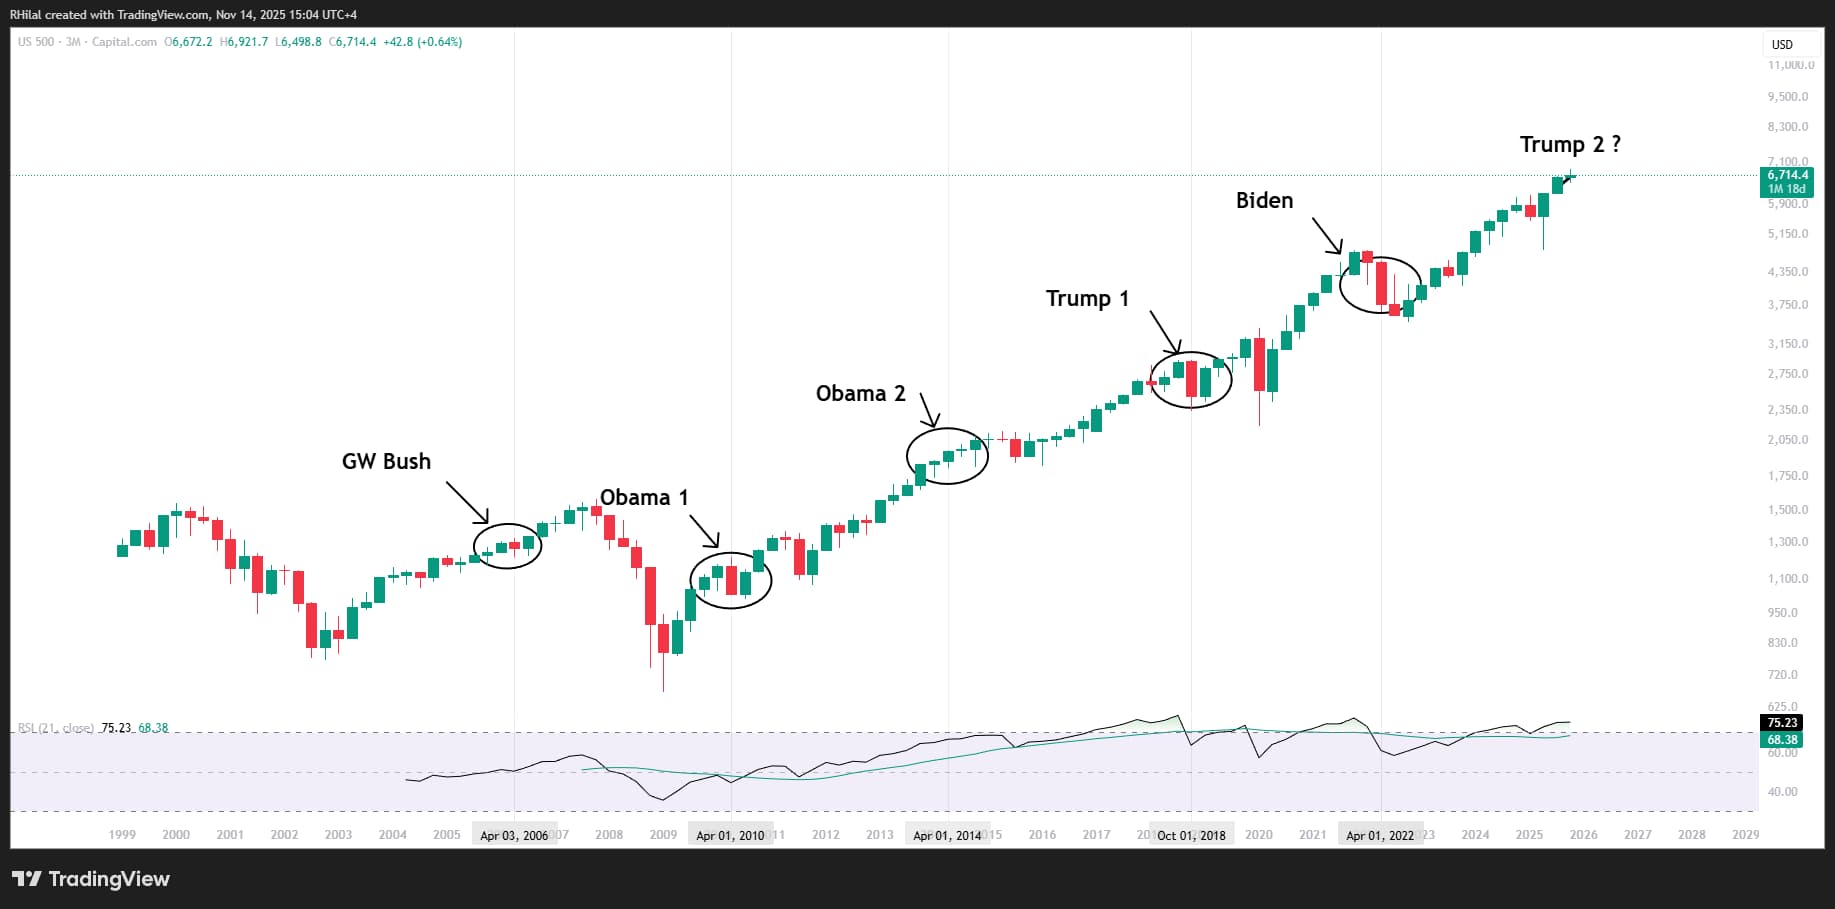
US 500 Outlook – 3 Month Chart – Log Scale
Source: Trading view
From a presidential-cycle perspective, particularly since the early 2000s, the second year of a president’s term often leans toward a corrective or consolidation phase as markets adjust to policy exhaustion and reduced momentum.
Following a steep rally driven by Trump’s return, tariff tensions, geopolitical frictions, and record-breaking momentum, caution toward a potential pullback before the trend resumes remains a valid and historically supported case.
Dow Jones Outlook: Monthly Time Frame – Log Scale
Source: Trading view
Despite the bearish probabilities, the guiding principle remains: the trend is your friend, and an overbought momentum signal is not necessarily a sell trigger. A clean hold above the upper bound of the contracting structure — effectively invalidating the diagonal — would open the door to a bullish continuation.
Bullish Scenario:
From the upside, if the Dow breaks and holds above the 50,000 mark — clearing a resistance structure that has held for nearly three years — the diagonal scenario becomes less relevant, and gains may continue in line with the primary bull run and overall market risk sentiment.
Key upside levels include: 51,250, 53,000, and 57,500.
The following levels are derived using the Fibonacci extension tool between the September 2022 low, November 2024 high, and April 2025 low.
Written by Razan Hilal, CMT
Follow on X: @Rh_waves
The VIX (John Kicklighter)
Talking Points:
- Risk appetite swelled and collapsed across the markets after the Liberation Day reciprocal tariffs were announced in April and reversed soon after
- What was initially an opportunistic bid on the dip after the tariff discount, turned into justification through AI and other themes that grew increasingly long-in-the-tooth
- Risk appetite can hold out if fundamental meet the lofty expectations, but expecting low volatility amid an ‘oblivious’ threat outlook well into 2026 seems highly improbable
Markets experienced a few jolts of volatility through the past year – April’s tariffs charge, October’s US government shutdown and November’s monetary policy perspective pivot – but those short-term charges consistently retreated from their extremes and back to the general underlying trend. While the brief bouts of fear provided significant market impact, the persistence of benchmarks for sentiment – like the S&P 500 or Dow Jones Industrial Average – moderated the ultimate impact that these readings would otherwise exert on broader conviction.
With US indices lingering near record highs and so many other sentiment measures similarly elevated historically, it is easy to fall into a belief that the quiet advance will automatically persist into the new year. This seems further supported by the moderating influence for many of the systemic fundamental themes from the past year: tariff-driven geopolitical risks and inflation expectations; transition of monetary policy trends; economic pacing threats and fiscal stability issues. That said, it is worth noting that the norm with which spikes in volatility reverted to was ultimately on a steady trend higher. For reference, the 13 and 26-week (quarter and half-year) averages of the VIX volatility index have risen substantially from the Summer 2024 lull. We can see similar measure through the medium-term’s 3-month VIX.
Chart of VIX Volatility Index (Daily)
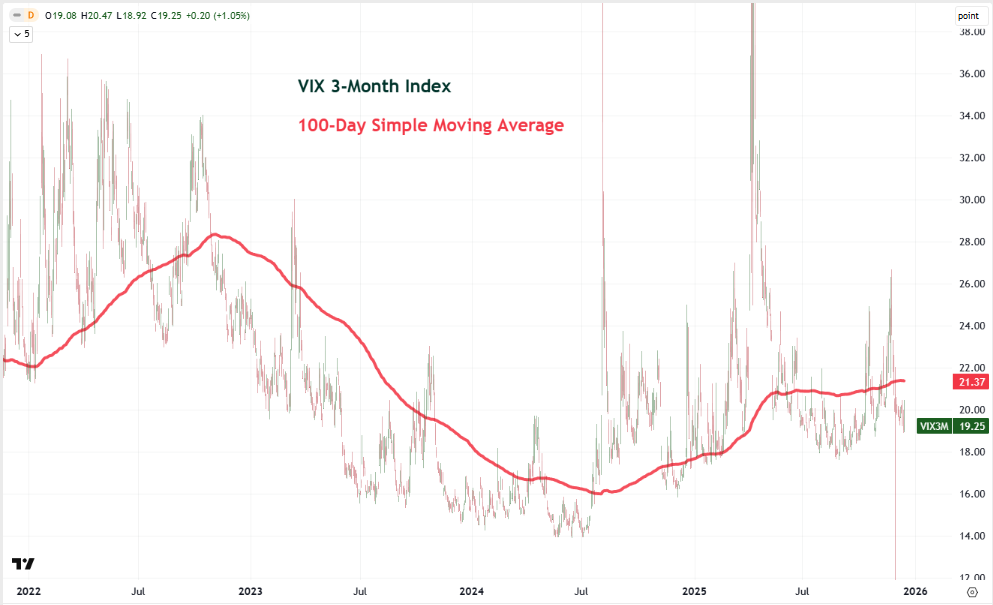
Source: TradingView, John Kicklighter
There is a ‘chicken and the egg’ debate over market volatility. Some believe that volatility will rise when market catalysts present greater uncertainty and thereby price volatility. I agree with that, particularly when it pertains to short-term swells in volatility readings. However, it is more frequently the case that market conditions establish the environment with which event risk draw experiences are greater or lesser market-moving capacity. With the trend in underlying implied volatility rising against the backdrop of record high markets (leading to a discordant risk profile and hedging costs), it seems more likely that the backdrop will establish an environment where updates will trigger bigger movements.
What’s more, this isn’t just a reflection of US markets – much less US equities as is reflected by the VIX – but has the potential for the financial markets at large. Trends higher in speculative assets like equities and Bitcoin as well as financial stability representatives like gold suggest a spillover of uncertainty can happen from core markets across the board. And, ultimately, the wider the reach of volatility, the more systemic and persistent it will be for the financial system. When the markets are ready, they will have their pick of traditional justifications to draw from.
Chart of VIX Volatility Index (Daily)
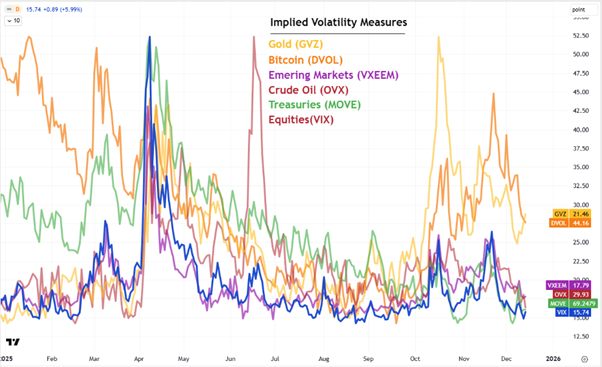
Source: TradingView, John Kicklighter
For taking advantage of volatility, there are a few approaches to take. Attempting to take a view through the derivatives based on measures like the VIX itself are not particularly appealing because of the time restrictions of the derivatives and inherent flaws for some of the more popular exposures (like the VXX iPath Short-Term VIX Futures ETN). Instead, I like to monitor the implied measures as a gauge to reflect a sustainable rebound in conditions. Then, it is finding those underlying markets with a strong correlation (inverted for many) to the VIX itself.
The S&P 500 has one of the most consistent negative correlations to the VIX (across durations) and that should make sense as it is derived from the indices’ derivative measures. That said, the speculative nature of the options pricing the VIX has seemed to override the hedging capacity of the products. That has moderated its signal power for implied (expected) volatility, but it also weakens its guidance capabilities for the S&P 500 itself when separating a quick pullback from a lasting trend.
Chart of S&P 500 and Inverted VIX 3-Month (Daily)
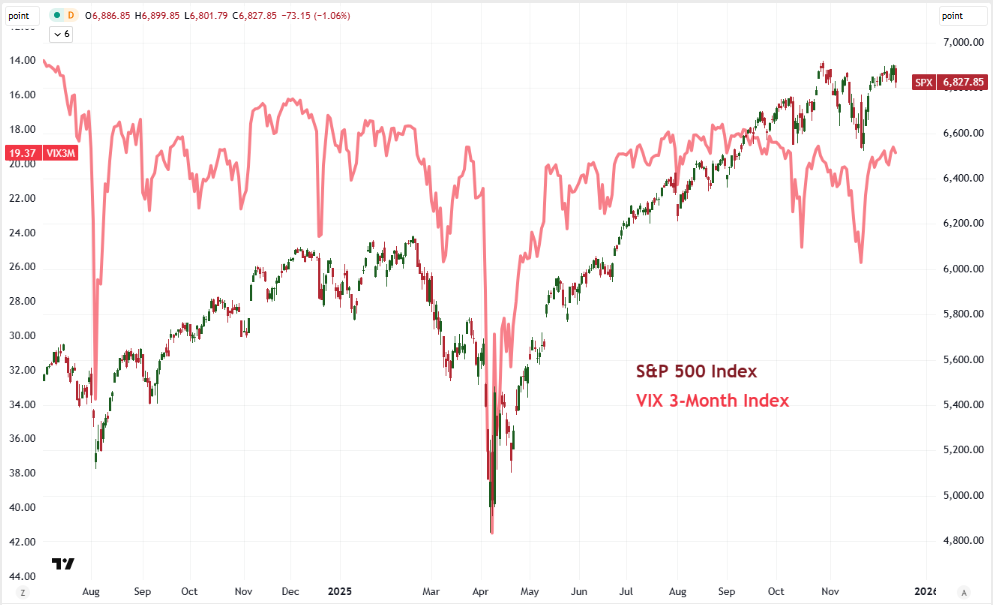
Source: TradingView, John Kicklighter
A little further afield than the direct VIX-S&P 500 relation, but adding in additional fundamental consideration, is the USDJPY. Historically, Yen crosses have played the role of carry trade with the Japanese currency providing the ‘funding’, or short side. That is owing to three decades of essentially zero interest rate which has pushed Japanese investors to send their capital abroad for meaningful return. However, the BOJ has been on a slow hiking regime this past year to slowly eat into the carry trade while major counterparts have experienced a dovish cycle from their own monetary policy groups. That has materially lowered the yield differentials for the likes of USDJPY and other crosses.
That said, there remains a hearty positive carry for pairs like USDJPY which can appeal in the environment where complacency keeps risk appetite bid. Alternatively, should fear start to break through the status quo and generate more significant market volatility and broader uncertainty along with it; this carry-price divergence is more likely to close. While the Yen is not necessarily a more appealing haven than the US dollar, the first consideration towards a sentiment shift is to unwind extended exposure (eg long carry) rather than seek out absolute risk-free haven (eg Treasuries priced in dollars). Add to this a pressure from Japanese authorities worried about the purchasing power of a weak Yen, ready to take advantage of market natural market swoons potentially through intervention; and this seems a pair to watch in the context of volatility trends.
Chart of USDJPY, US-Japan 2-Year Yield Differential, Inverted VIX 3-Month (Daily)
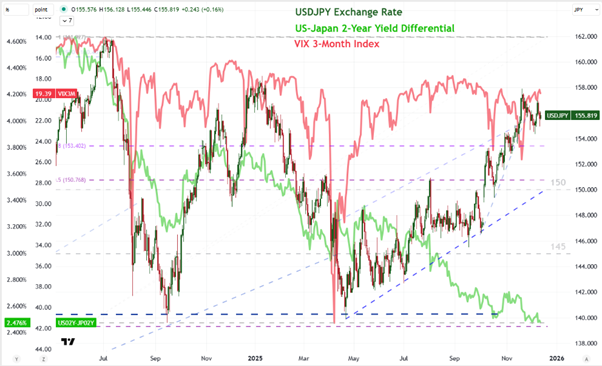
Source: TradingView, Standard & Poor’s, John Kicklighter
-- Written by John Kicklighter, Global Head of Content