As 2026 begins, the currencies of the United States, Mexico, and Canada continue to be essential pillars of financial stability and sustained trade flows within the North American economic bloc. Heading into the first quarter of 2026, the USD/CAD and USD/MXN pairs face a landscape shaped by changes in interest rates, potential adjustments in trade relations, and ongoing uncertainty surrounding economic growth. Within this context, it is important to highlight that both the Canadian dollar and the Mexican peso remained notably strong through most of 2025—an outlook that could persist if the structural weakness of the U.S. dollar continues into early 2026.
What Can Be Expected from Central Banks Now?
As of this writing, North American central banks are beginning to show clear divergence in their monetary policy paths: some maintain expectations of additional rate cuts, while others have shifted to a more neutral stance. The Bank of Mexico stands out, having lowered its benchmark rate from 10.00% to 7.25% since January 2025—making it the only central bank in the region implementing a sustained easing cycle and the most accommodative monetary authority in North America over the past year.
The Bank of Canada, meanwhile, has followed a different path, alternating between rate cuts and periods of neutrality. Since January 2025, its policy rate has decreased from 3.00% to the current 2.25% (its latest decision of 2025), returning to a state of consistent neutrality, in line with the direction adopted through most of the year. This reflects a more modest rate-cut cycle, contrasting with the more flexible monetary paths observed in other regional economies.
The Federal Reserve, surprised markets with its September decision. Throughout most of 2025, it maintained a neutral rate posture at 4.5%, becoming the only central bank in the region that had not adjusted policy since the December 2024 cut. However, market expectations shifted toward a steady cutting cycle, and the policy rate ultimately fell to 3.75%.
North American Interest Rates Table – 2025

Colors: Green to red; green indicates higher rates and red indicates lower rates.
Source: Data - Tradingeconomics
North American Interest Rates Chart – 2025

Source: Tradingeconomics
With these shifts in mind, the key question is what monetary path North American central banks will take in 2026, as this will likely be decisive for the long-term behavior of their currencies:
- On December 10, the Bank of Canada held its rate at 2.25%, highlighting Canada’s economic resilience in 2025 after a 2.6% Q3 GDP reading. Stronger activity may increase inflationary pressures, leading the bank to maintain a neutral stance into year-end.
- On November 6, the Bank of Mexico lowered its rate to 7.25%, noting that—even after the cut—it remains high relative to other central banks. The decision was influenced by global uncertainty stemming from trade tensions. However, the bank warned that an uptick in inflation may require a policy reassessment in 2026.
- On December 10, the Federal Reserve reduced its rate by 25 basis points to 3.75%, marking its third cut of 2025. The move was driven by labor-market weakness and subdued inflation, keeping the door open for further easing if employment conditions deteriorate.
Thus, inflation data behavior could be critical in shaping upcoming policy decisions. In Canada, inflation rose to 2.2% in October, up from 1.7% in July, slightly above the 2% target. In Mexico, inflation reached 3.8% in November, above both the 3.51% recorded in October and the 3% target.
In the United States, inflation data has been distorted by the recent government shutdown. The latest figure shows a 3% reading in September, higher than the 2.3% in April 2025 and still far from the Fed’s 2% target.
North America Inflation Chart – 2025

Source: Tradingeconomics
Inflation’s upward trajectory has moved central banks further away from their targets. For the Bank of Mexico and the Bank of Canada, this could limit additional cuts, especially as both institutions emphasize the need to keep inflation contained. In fact, inflation was a key factor behind Canada’s decision to maintain a neutral rate stance into late 2025. If CPI continues rising, expectations for lower rates may be restricted during Q1 2026 in both countries.
In the United States, the situation differs: the Federal Reserve has prioritized the labor market, supporting a bias toward lower rates, especially given data disruptions caused by the government shutdown. Unless inflation increases meaningfully, the Fed may continue alternating between low and neutral rates through 2026, consistent with its messaging following the December meeting.
Taken together, the shifts in central bank policy stances could redefine the strength of North American currencies. Mexico continues to hold the highest interest rate in the region, which keeps the Mexican peso attractive in a global low-rate environment. In Canada, inflation concerns support a more neutral policy stance, providing ongoing support for the Canadian dollar. In contrast, the Federal Reserve’s more dovish approach leaves room for additional rate cuts in 2026, weakening demand for U.S. Treasuries and reducing overall appetite for the U.S. dollar. This suggests that, unlike Mexico and Canada—where monetary conditions still offer support—the U.S. dollar may continue to face downside pressure, as seen through much of 2025, which could ultimately lead to persistent selling pressure on both USD/MXN and USD/CAD over the longer term.
What to Expect from the U.S. Dollar?
The U.S. dollar remained broadly weak throughout 2025—first due to economic uncertainty and trade conflict, and later because of rate-cut announcements beginning in August, which marked a clear shift in Fed policy. The DXY index captured this trend, falling below 100 and even touching 96, a level not seen since 2022.

Source: TVC, Tradingview
Although the DXY experienced a partial recovery, it still exhibits a bearish outlook heading into late 2025, consistent with the Fed’s push toward lower rates. If this weakness and indecision persist, both the Mexican peso and Canadian dollar could continue strengthening, reinforcing the downside momentum seen in USD/MXN and USD/CAD across the year. However, the magnitude of the dollar’s decline during the year also suggests limited room for extended weakness, which may prompt short-term bullish corrections in both pairs.
Trade Negotiations Ahead
Throughout 2025, North American trade tensions escalated—driven largely by the administration’s trade war—deteriorating economic relations just ahead of the crucial 2026 USMCA (T-MEC) review. Mexico is reassessing its stance through public consultations and considering trade diversification, while Canada is seeking to strengthen domestic demand and explore new partnerships, including in Asia.
Despite these tensions, the USMCA remains a foundational agreement for both economies, ensuring trade facilitation and regulatory certainty. The 2026 review will be critical, determining whether the agreement is renewed for another 16 years. Government communications may begin signaling the probable direction of the decision.
If tensions lead to a non-renewal or to significant modifications of the agreement, resulting uncertainty could weaken investment confidence, reducing demand for both the Mexican peso and the Canadian dollar—similar to reactions seen during tariff escalations in 2025. Thus, early 2026 currency performance will depend, in part, on positive signals surrounding USMCA continuity. Otherwise, a stronger bearish bias could emerge for both currencies.
USD/CAD Shows Signs of Indecision
Source: StoneX, Tradingview
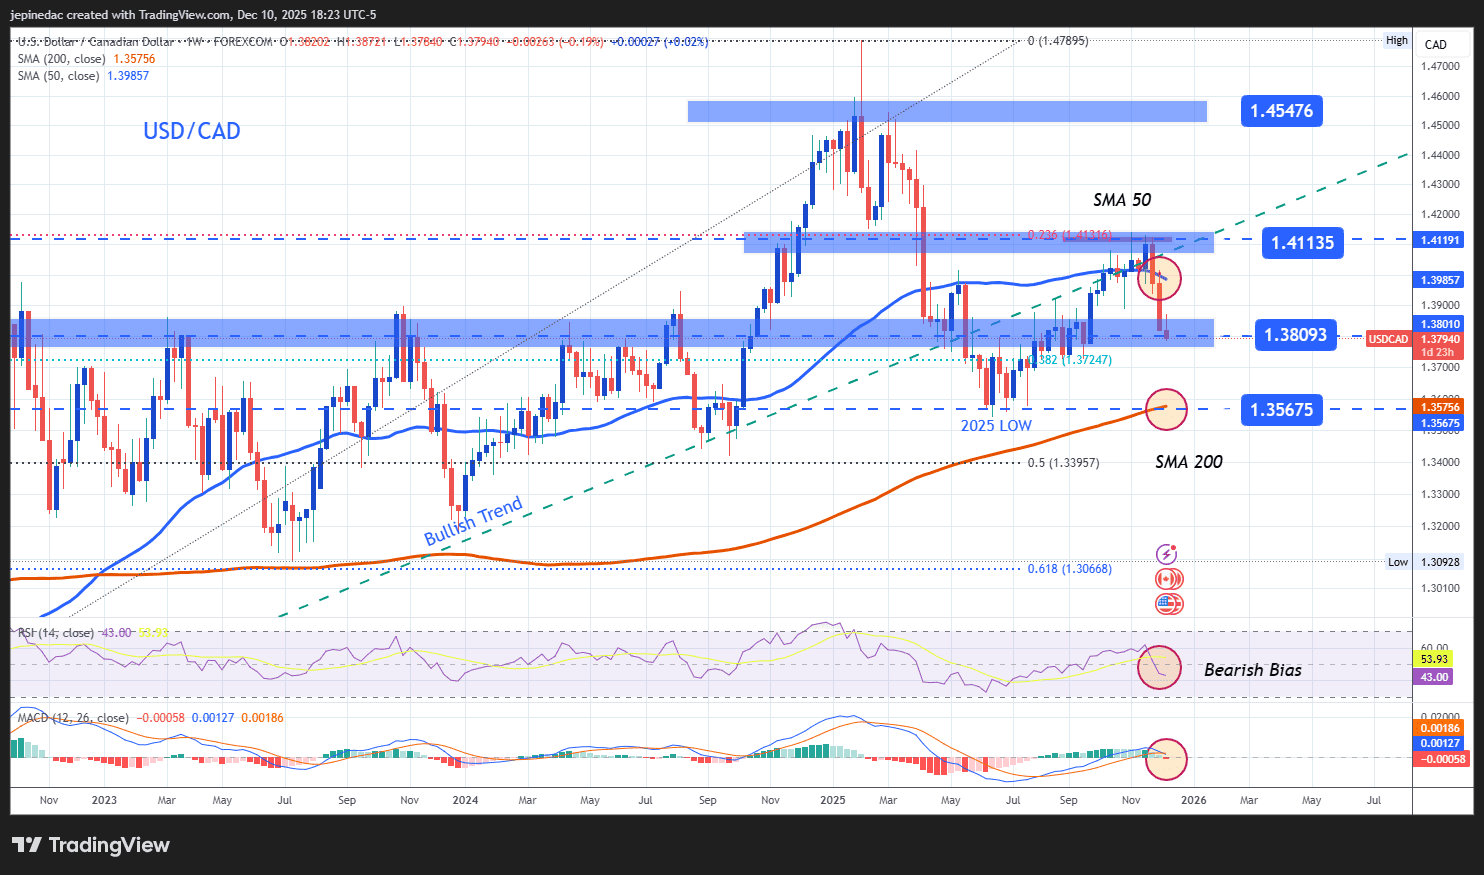
- Long-Term Uptrend Breaks: Since May 2021, USD/CAD had maintained a consistent long-term bullish trend; however, this structure was broken during 2025, giving way to a dominant bearish bias in favor of the Canadian dollar. As a result, attempts by the U.S. dollar to regain strength have been insufficient to reactivate the long-standing uptrend that prevailed for several years. This shift has created a scenario of persistent indecision, where the pair has been unable to establish a clear directional bias in recent months. If buying pressure fails to strengthen, USD/CAD could move into a sideways range during the early months of 2026, especially if buyers cannot recover enough momentum to restore the long-term bullish trend that previously guided the pair.
- Indicators:
- RSI: The RSI continues to oscillate steadily below the neutral 50 level, reflecting that bearish momentum has dominated toward the end of 2025. This indicates a persistent selling bias in USD/CAD based on the indicator’s average behavior. As long as this pattern remains intact, selling pressure is likely to strengthen, reducing the probability of a sustained return to the long-term uptrend seen in previous years.
- MACD: A similar outlook appears in the MACD, whose histogram has crossed below the zero line, signaling that bearish strength has begun to dominate the average of the short-term moving averages. If the histogram continues to record values below zero, selling pressure could become more relevant during the first months of 2026.
- Key Levels:
- 1.41135 – Key Resistance: This resistance is located near the 23.6% Fibonacci retracement, considered the most important technical barrier on the chart and positioned above the 50- and 200-period moving averages. A buying breakout above this level could restore a bullish bias and reactivate the long-term uptrend as the dominant technical structure.
- 1.38093 – Current Barrier: This barrier is positioned near the 38.2% Fibonacci retracement and coincides with the most relevant neutrality zone observed over the past three years. If price continues fluctuating around this area, indecision may increase and USD/CAD could form a long-term lateral range.
- 1.35675 – Crucial Support: This support is located at the 200-period simple moving average and aligns with the 2025 lows. A break below this level would signal a structural change in the chart and could confirm the formation of a more consistent long-term downtrend.
USD/MXN Maintains Dominant Bearish Bias
Source: StoneX, Tradingview
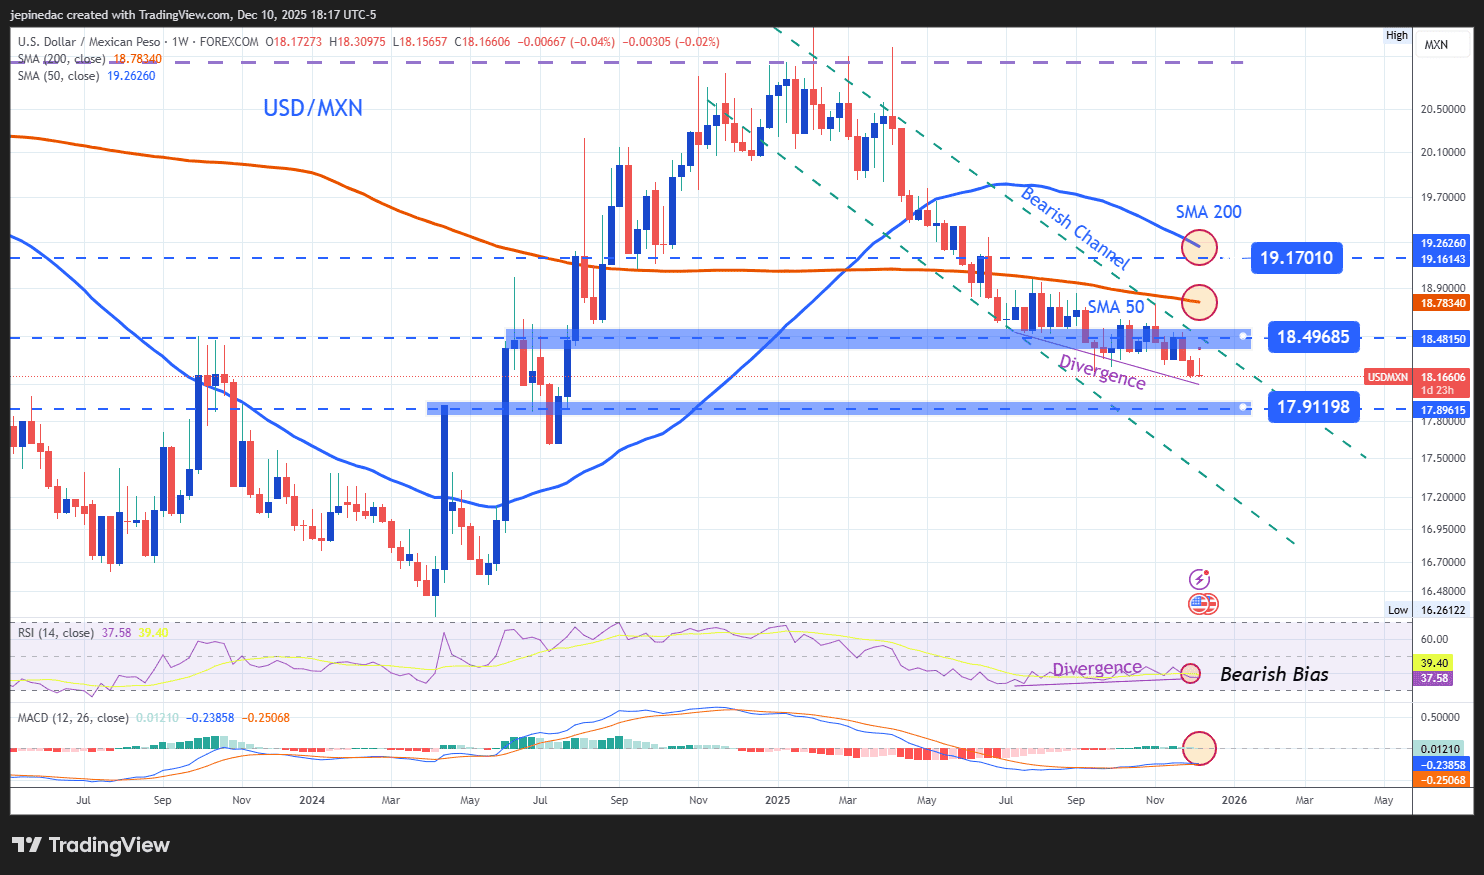
- Downward Channel Holds Firm: Since early January 2025, USD/MXN has traded within a consistent bearish channel, which intensified in April when price movement became more pronounced and began printing progressively lower lows, reflecting the Mexican peso’s dominance over the U.S. dollar. Although several short-term upward corrections have occurred, there is still no buying dominance, confirming that the long-term bearish trend remains the most relevant technical structure and continues to guide the pair’s predominant direction. As long as selling pressure remains steady, the bearish channel is likely to dominate USD/MXN’s behavior in the coming months.
- Indicators:
- RSI: The RSI continues to fluctuate below the neutral 50 level, confirming that bearish momentum has dominated in recent months. However, the indicator has begun forming higher lows, while the price prints lower lows, suggesting a developing bullish divergence. This may indicate an exhaustion of selling pressure, allowing for more consistent upward corrections. Although these corrections do not pose an immediate threat to the broader bearish channel, they may introduce short-term neutrality into the pair’s price action.
- MACD: The MACD histogram remains very close to the zero line, indicating that the average force of short-term moving averages has yet to define a clear directional movement. If this behavior persists, it could signal long-term neutrality, consistent with the potential for short-term bullish corrections within the existing bearish structure.
- Key Levels:
- 19.17 – Crucial Resistance: This resistance level aligns with the 200-period moving average, making it the key barrier for bullish movements. A breakout above this zone would signal a shift in technical strength, undermining the current steep bearish channel and potentially giving rise to a new long-term buying pressure.
- 18.50 – Nearby Resistance: This level represents a neutrality zone observed in recent months and may act as a recurring barrier against short-term bullish corrections. As long as price remains consistently below this level, the dominant bearish bias is likely to persist over the long term.
- 17.90 – Final Support: This support level corresponds to price territory not seen since July 2024 and serves as the most important barrier for bearish movement. If selling pressure pushes price consistently toward or below this level, the dominant bearish bias could continue, extending the bearish channel through the coming months.
Written by Julian Pineda, CFA, CMT – Market Analyst
Follow him at: @julianpineda25