April Pits Market Seasonality Norms Against High Exogenous Risk for S&P 500, Oil and Gold
Key Talking Points:
- Both the S&P 500 and Nasdaq 100 have tended to strengthen in March, but lackluster performance so far in 2025 has bulls on edge
- March has historically seen the second-worst performance of all months for gold, which has recently pulled back from record highs
- The budding trade war and developments on the tariff front could well outweigh the long-term historical seasonal tendencies this month
The beginning of a new month marks a good opportunity to review the seasonal patterns that have influenced the markets since 1990.
As always, these seasonal tendencies are just historical averages, and any individual month or year may vary from the historic average, so it’s important to complement these seasonal leans with alternative forms of analysis to create a long-term successful trading strategy. In other words, past performance is not necessarily indicative of future results.
S&P 500 Seasonality – S&P 500 (Price-Only)
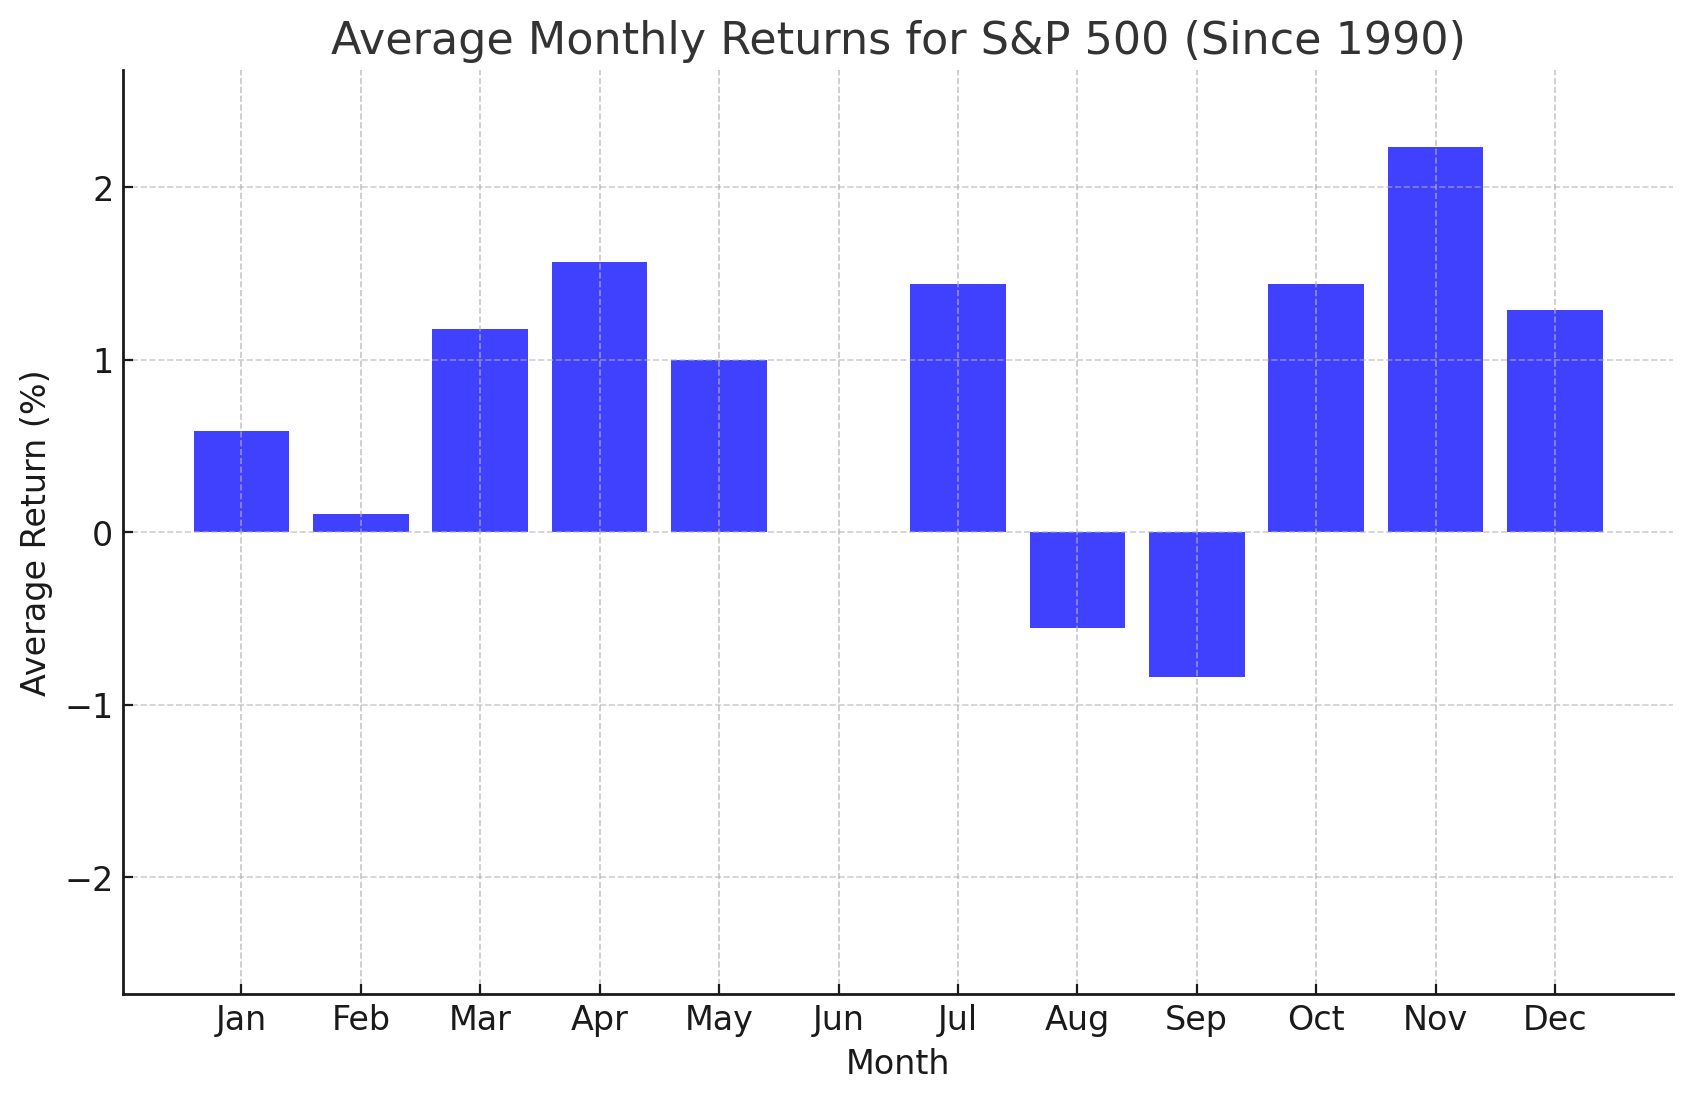
Chart Source: TradingView, StoneX.Please note that past performance is not necessarily indicative of future results.
Historically, April has been the second-strongest month for US stocks, with the broad S&P 500 index sporting an average (price-only) return of +1.6% over the last 35 years. Following a dour start to the year, readers may be understandably skeptical that such a rally could emerge, but it is notable that one of the big factors weighing on the stock market has been uncertainty around President Trump’s “reciprocal tariffs,” which are set to be announced on April 2. Perhaps if the market can put that uncertainty behind it, there’s a case for a seasonal bounce ahead of the summer.
Nasdaq 100 Seasonality – NDX (Price-Only)
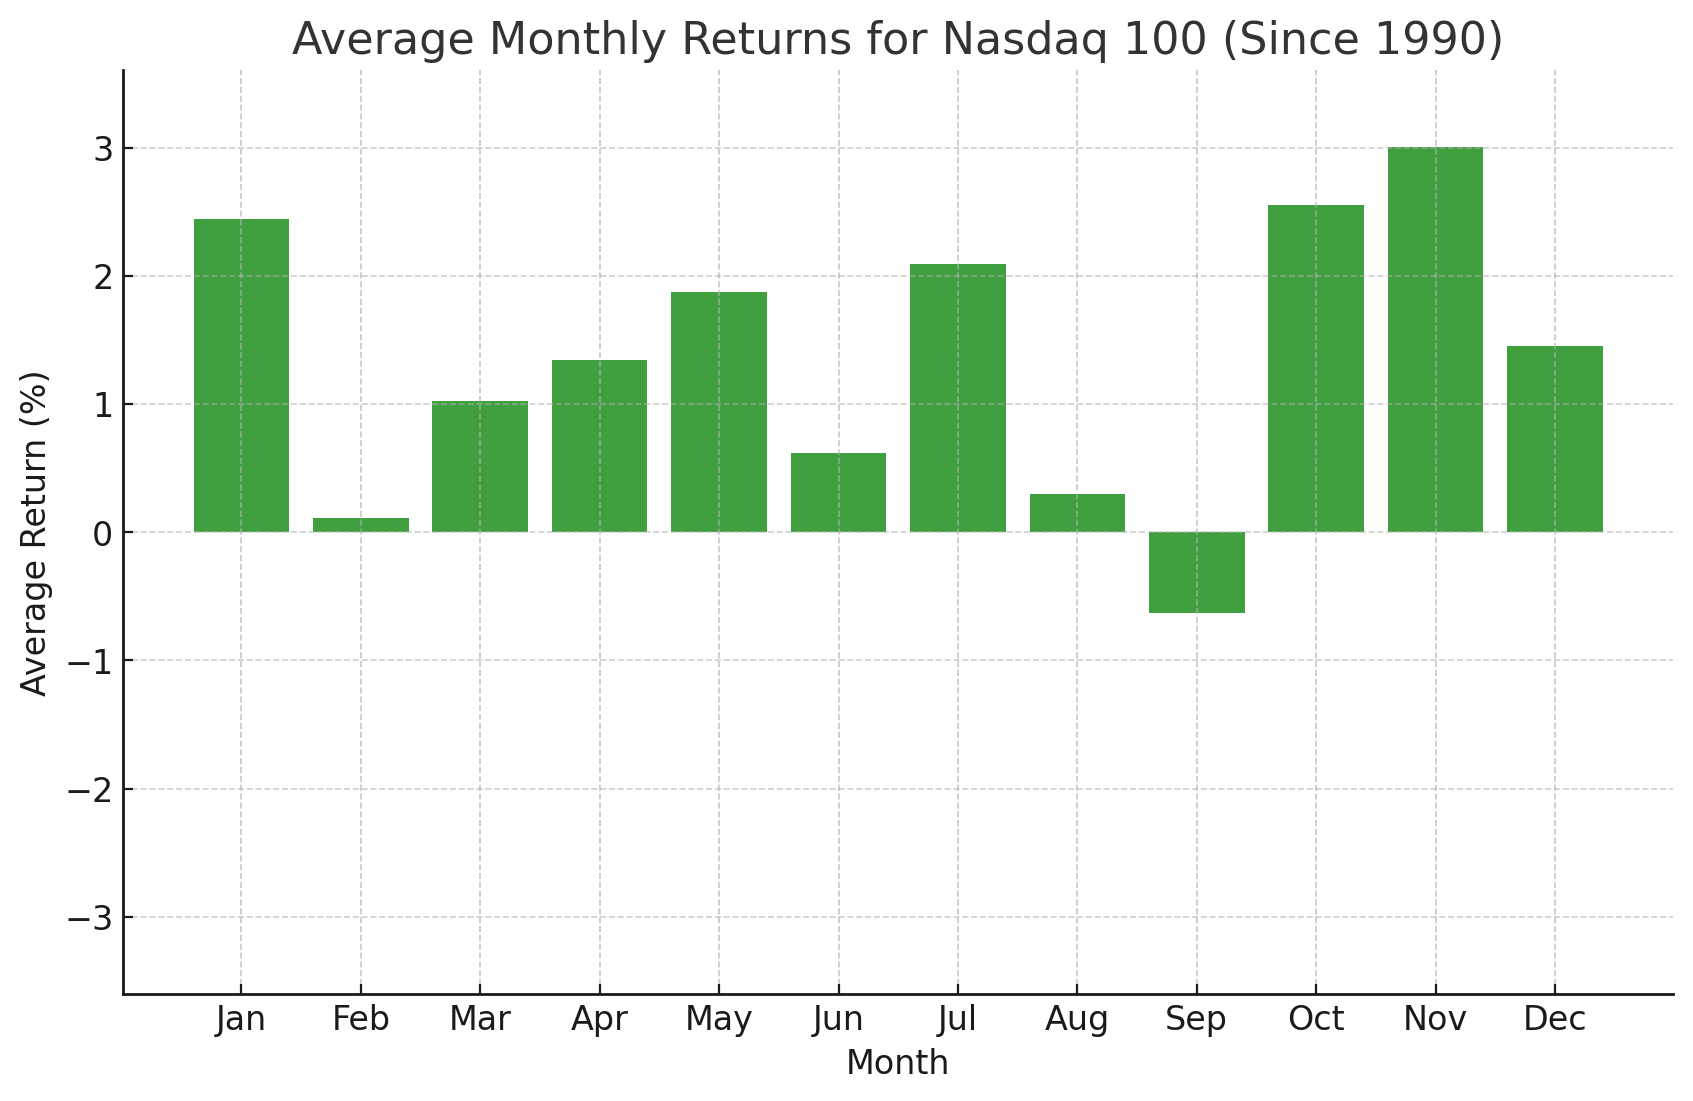
Chart Source: TradingView, StoneX. Please note that past performance is not necessarily indicative of future results.
Looking at the above chart, the Nasdaq 100 has historically rallied in April as well, albeit by a more tepid 1.3% since 1990. Long the leader among the US indices, the Nasdaq 100 is seeing the worst performance of the major US indices year-to-date as the shine comes off the AI-driven “Magnificent Seven” trade, including the quintessential AI darling, Nvidia.
Volatility Index Seasonality – VIX
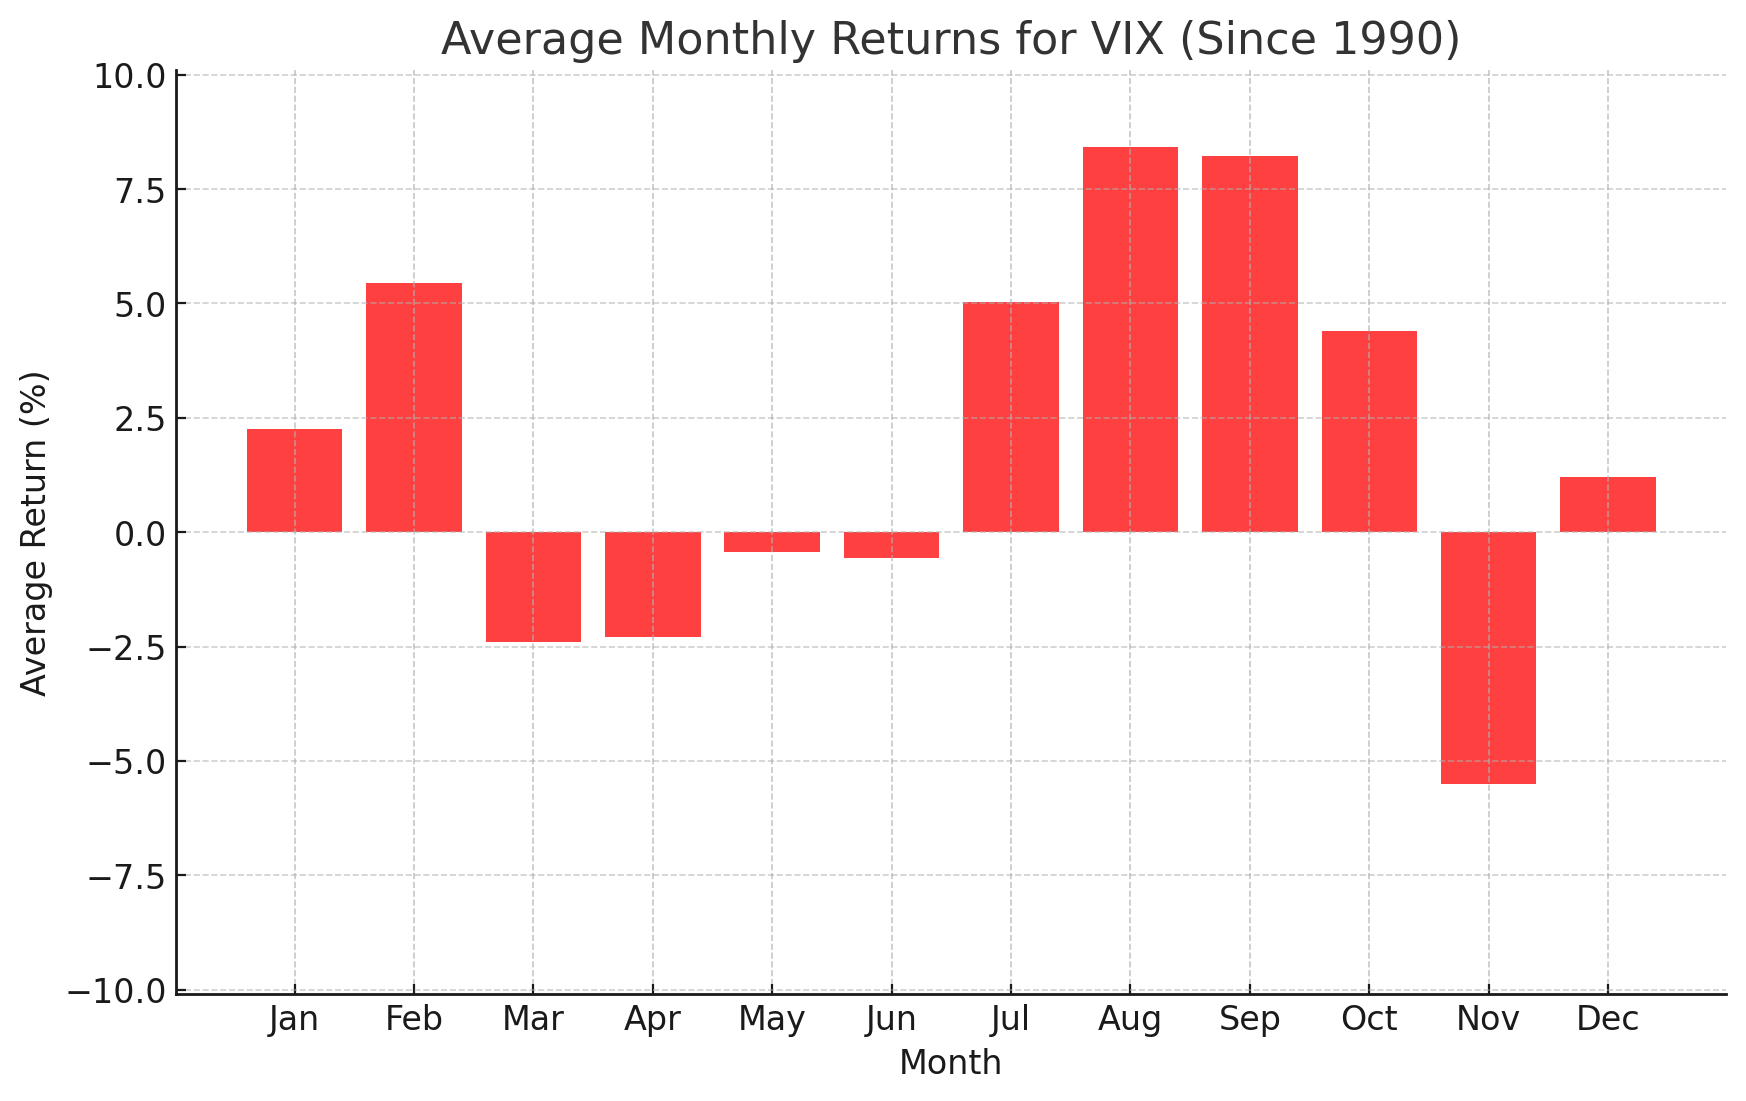
Chart Source: TradingView, StoneX. Please note that past performance is not necessarily indicative of future results.
Like March, April has historically been a month where stock market volatility falls, with the VIX index contracting by an average of -2.3% since 1990. That said, there may be different trends based on the election cycle as traders come to grips with the policies of the new Administration, as we’ve seen over the last couple months. As of writing, there is tremendous uncertainty around the situation in Ukraine, along with fears of a potential trade war between the US and the rest of the world, pushing the VIX back above 20 to relatively high levels compared to the last couple of years.
Gold Seasonality – XAU/USD
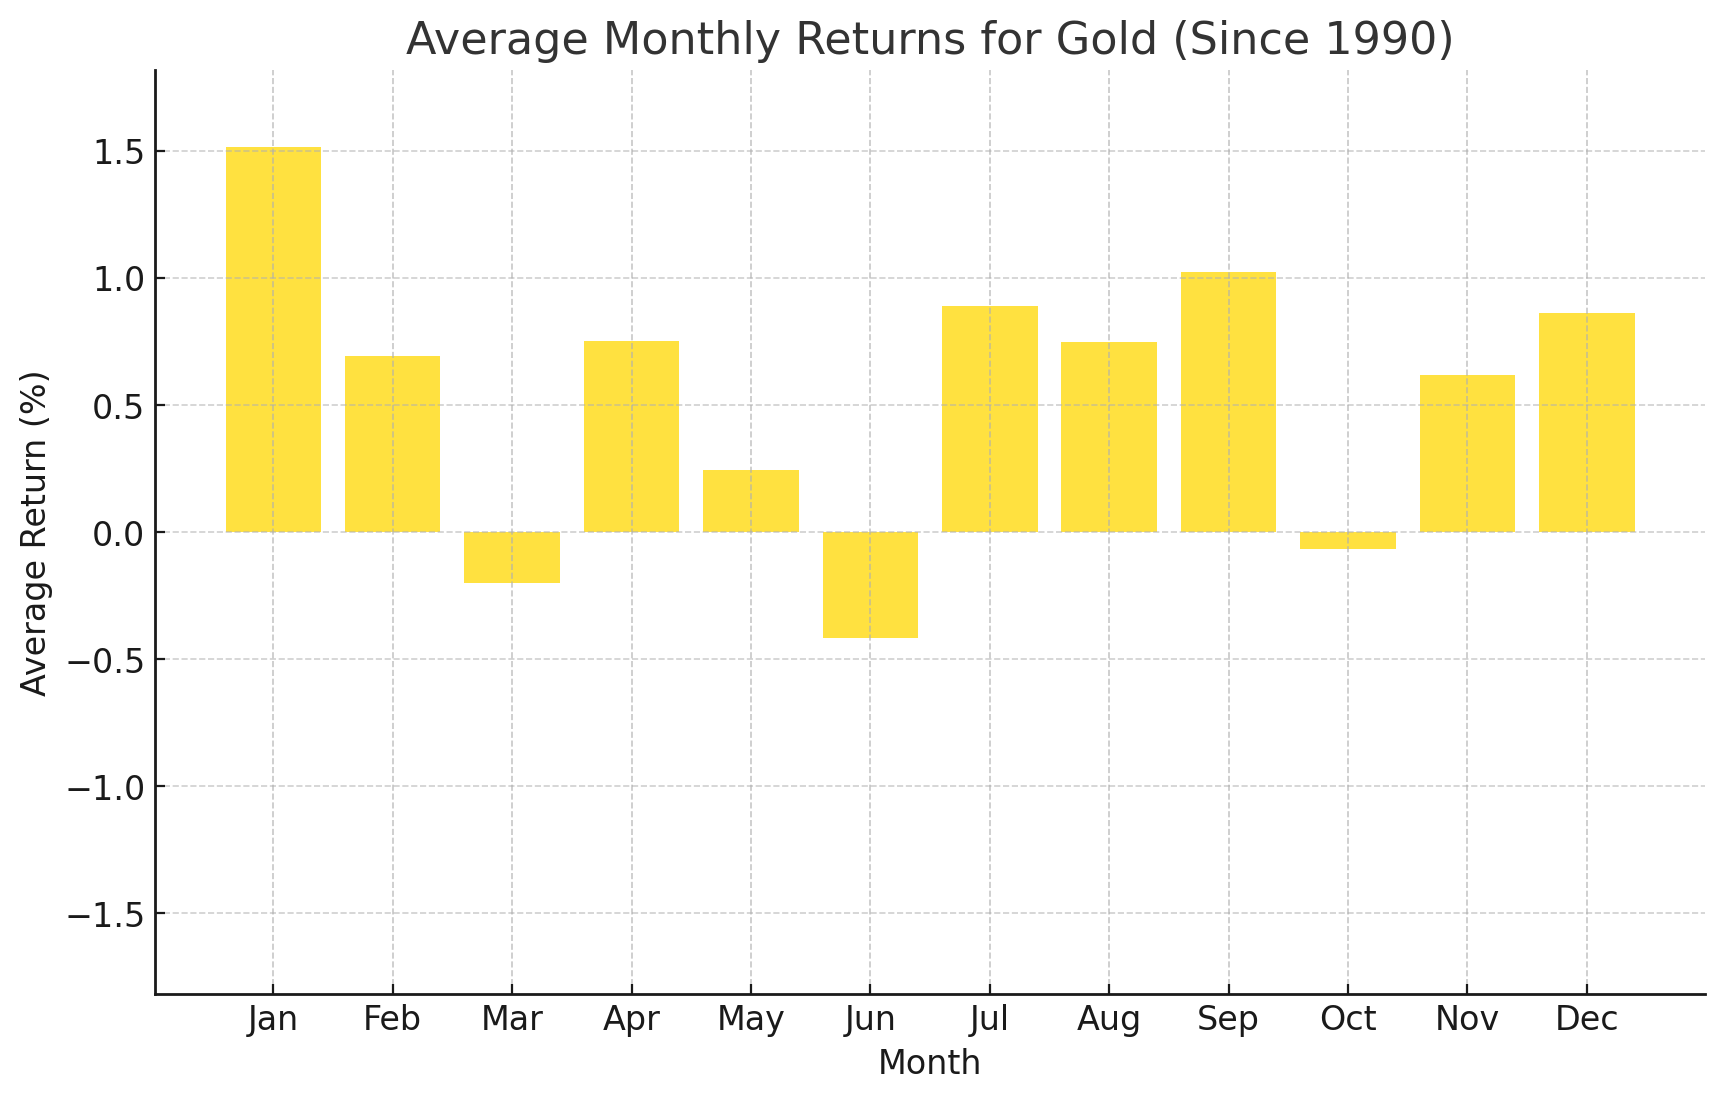
Chart Source: TradingView, StoneX. Please note that past performance is not necessarily indicative of future results.
Turning our attention to commodities, April has been a solid month for gold performance, with an average gain of 0.8% going back to 1990. The yellow metal broke out to fresh record highs in late March, and appears well positioned to extend its rally amidst still-falling interest rates globally, trade uncertainty, and a well established uptrend going back to late 2022.
WTI Crude Oil Seasonality – WTI Chart
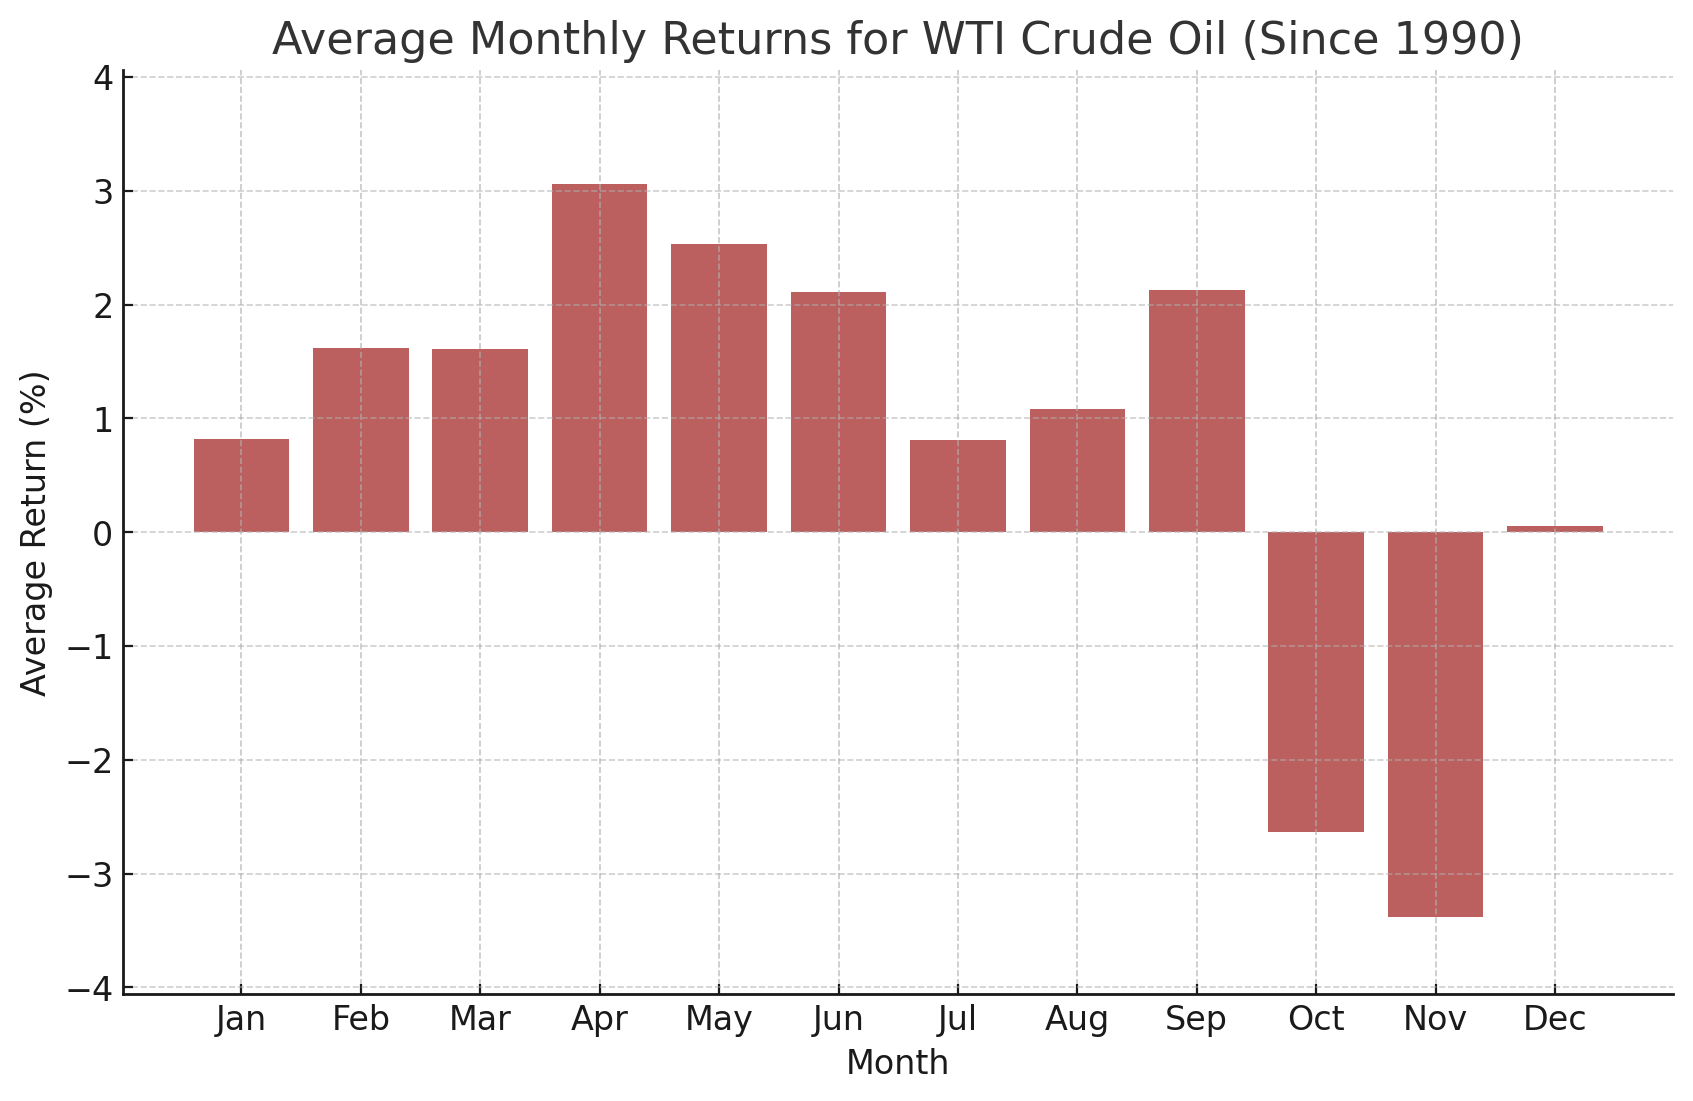
Source: TradingView, StoneX. Please note that past performance is not necessarily indicative of future results.
Last but not least, WTI Crude Oil has historically seen its best performance in April, with an average gain of 3.1% over the last 35 years. WTI generally tracked higher through the month of March, matching its long-term tendency, so bulls will be optimistic that it will be able to extend its nascent bounce above $70 in the coming month. As always, we want to close this article by reminding readers that seasonal tendencies are not gospel so it’s important to complement this analysis with an examination of the current fundamental and technical backdrops for the major markets and the global economy.
-- Written by: Matt Weller, Global Head of Research