StoneX logo

September 2025 Market Seasonality – S&P 500, Nasdaq 100 Vulnerable to Seasonal Dip

By: Matt Weller, Head of Market Research

September 2025 Market Seasonality – S&P 500, Nasdaq 100 Vulnerable to Seasonal Dip

September Seasonality Key Talking Points:


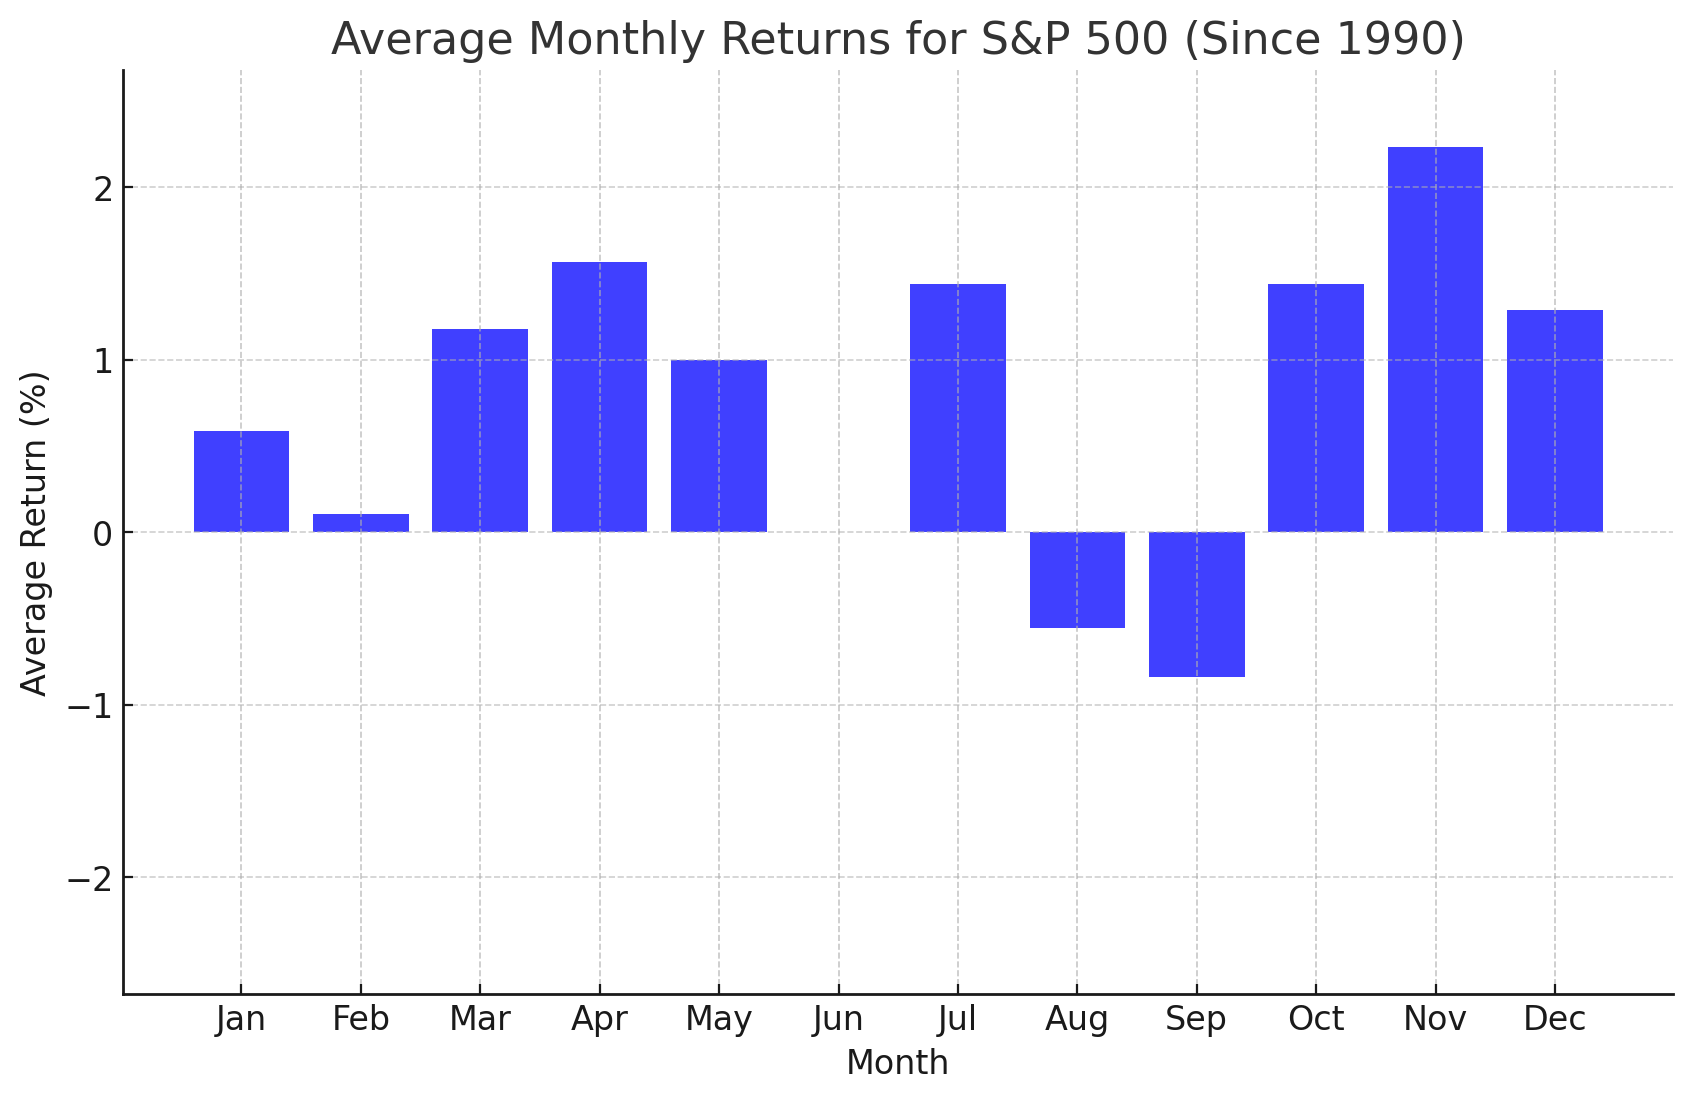
  • Historically, September has been the weakest month for US stocks, with the broad S&P 500 index sporting an average (price-only) return of -0.8% over the last 35 years.
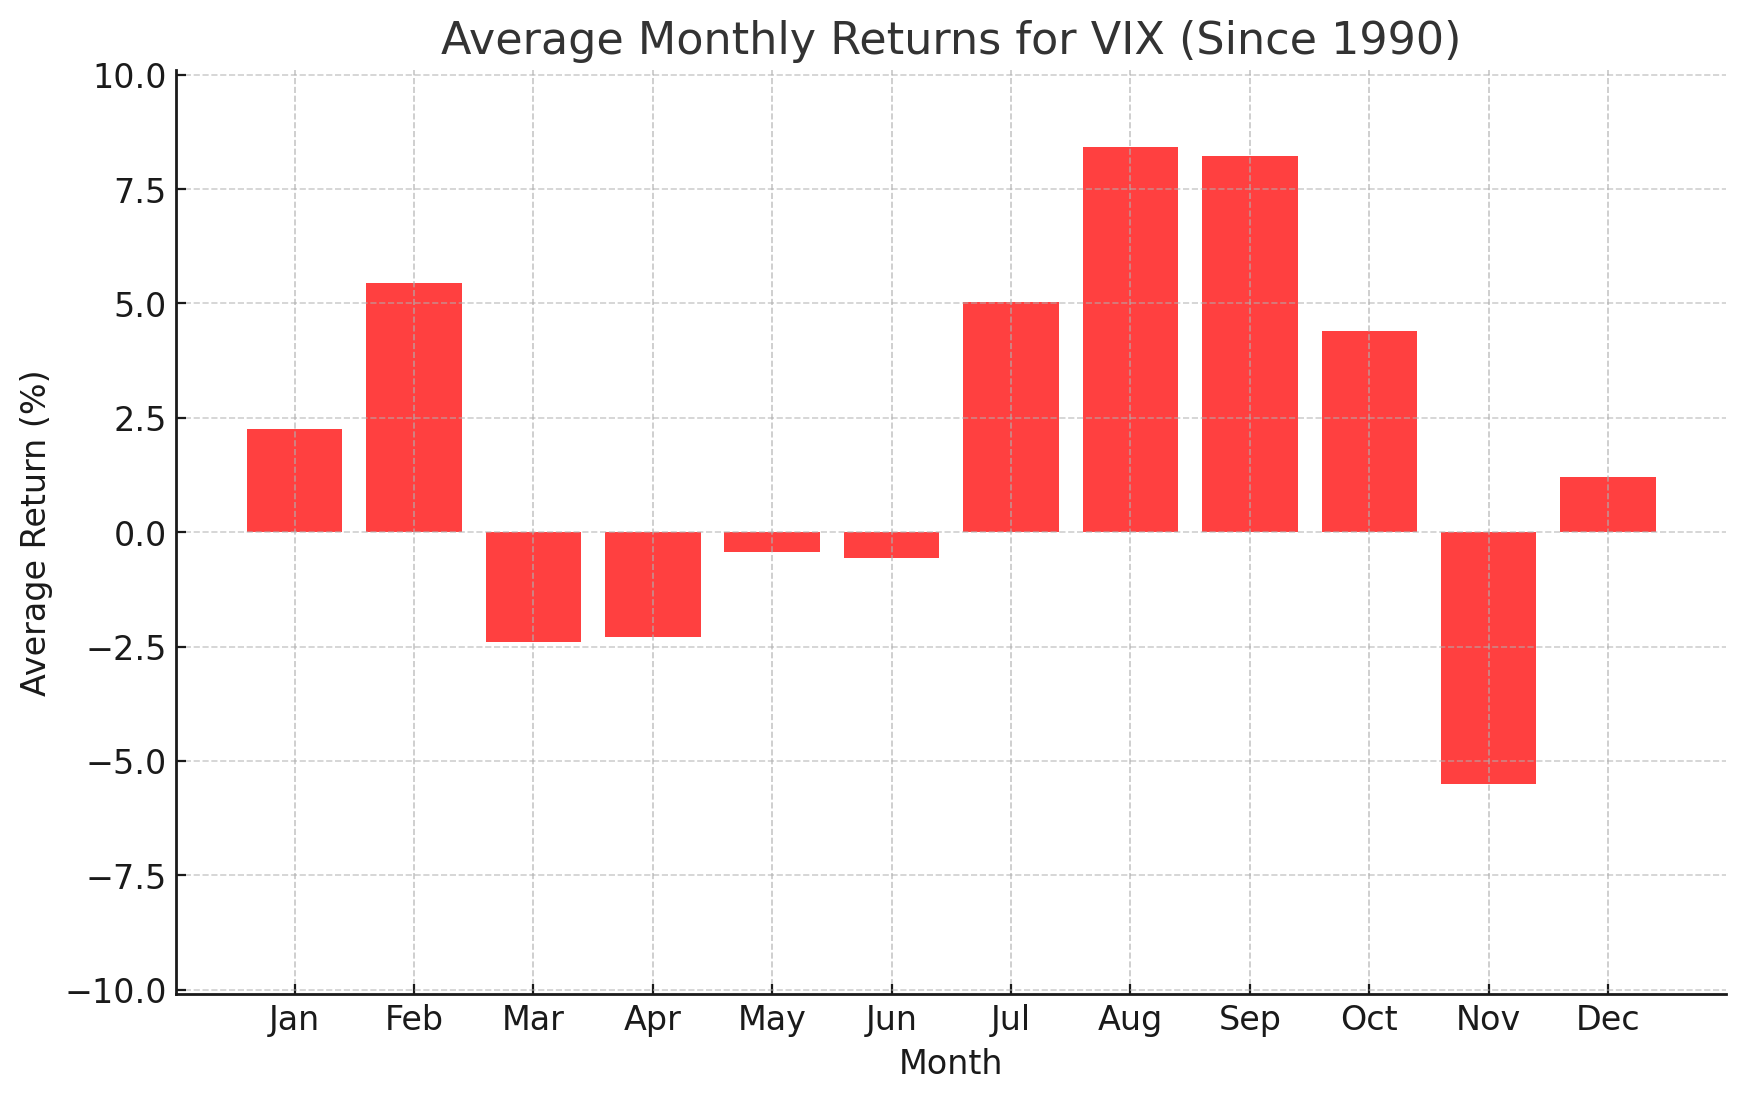
  • September has historically been the month where stock market volatility rises the most, with the VIX index rising by an average of 8.2% since 1990.
  • Gold and WTI Crude Oil have also shown bullish seasonal tendencies in September.

The beginning of a new month marks a good opportunity to review the seasonal patterns that have influenced the markets since 1990.

As always, these seasonal tendencies are just historical averages, and any individual month or year may vary from the historic average, so it’s important to complement these seasonal leans with alternative forms of analysis to create a long-term successful trading strategy. In other words, past performance is not necessarily indicative of future results.


S&P 500 Seasonality – S&P 500 (Price-Only)
 Top Global Macro Seasonality SPX 05 02 2025

Chart Source: TradingView, StoneX.Please note that past performance is not necessarily indicative of future results.

Historically, September has been the WEAKEST month for US stocks, with the broad S&P 500 index sporting an average (price-only) return of -0.8% over the last 35 years. As of writing, the index has gotten off to a rough start, falling sharply on the first trading day of the month amidst fears of rising yields, though hopes of imminent rate cuts from the Federal Reserve could limit the downside somewhat as we move through September. The S&P 500 did buck the weak seasonal trend in August, but after four straight “up” months, some give back in an historically weak month would not be surprising.

Nasdaq 100 Seasonality – NDX (Price-Only)
 Top Global Macro Seasonality NDX 05 02 2025

Chart Source: TradingView, StoneX. Please note that past performance is not necessarily indicative of future results.

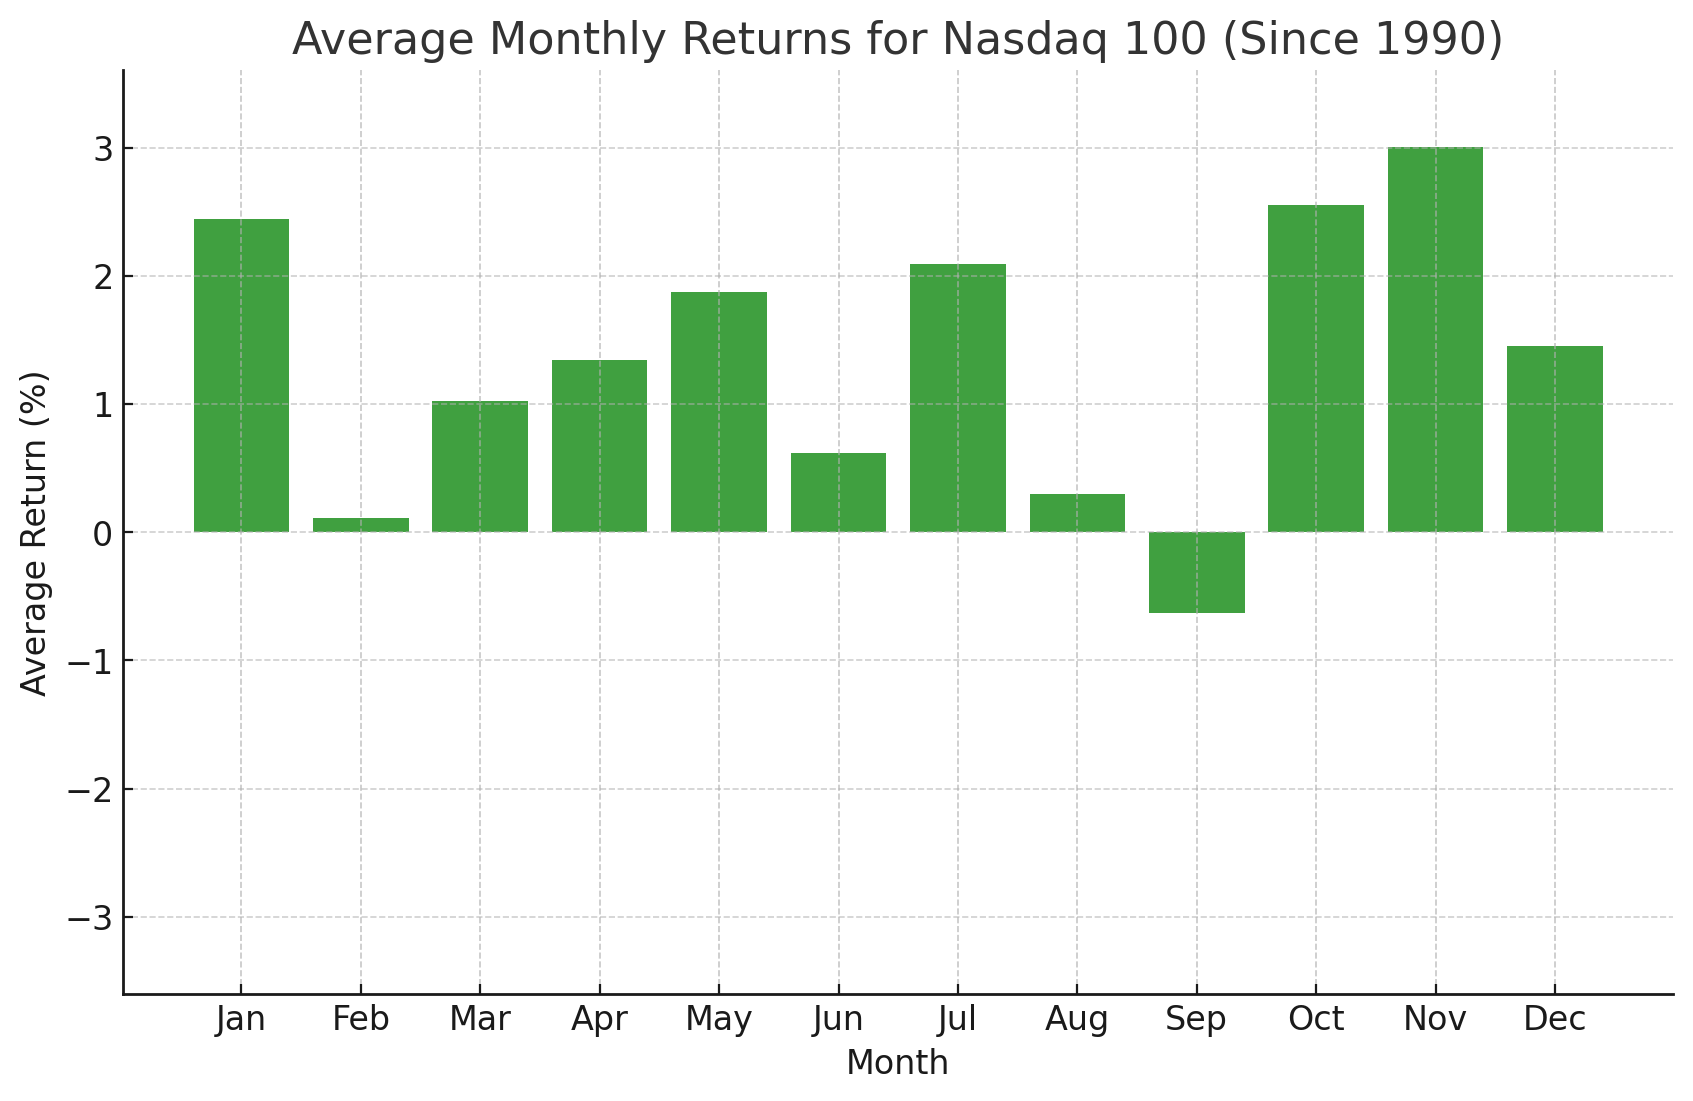
Looking at the above chart, the Nasdaq 100 has historically seen its weakest performance in September as well, to the tune of -0.6% since 1990. Like the S&P 500, the Nasdaq 100 rallied to record highs in August before pulling back in the latter half of the month and threatening to break its 4-month bullish channel as we go to press. Traders should keep a close eye on Nvidia’s performance in particular, with the AI behemoth falling to 5-week lows after a mixed earnings report in late August.


Volatility Index Seasonality – VIX
 Top Global Macro Seasonality VIX 05 02 2025

Chart Source: TradingView, StoneX. Please note that past performance is not necessarily indicative of future results.

September has historically been a month where stock market volatility rises, with the VIX index rising by an average of 8.2% since 1990, essentially tying its biggest up month. The VIX bucked its seasonal trend in August, edging down to close near 15 after spiking above 20 earlier in the month. For volatility traders (or any readers trading markets in general), the coming month should be particularly interesting, as traditional volatility catalysts from earlier in the year (US fiscal stimulus, trade policies, and geopolitical tensions) have simmered down, but the seasonal trend nonetheless points to potential upside.


Gold Seasonality – XAU/USD
 Top Global Macro Seasonality Gold 05 02 2025

Chart Source: TradingView, StoneX. Please note that past performance is not necessarily indicative of future results.

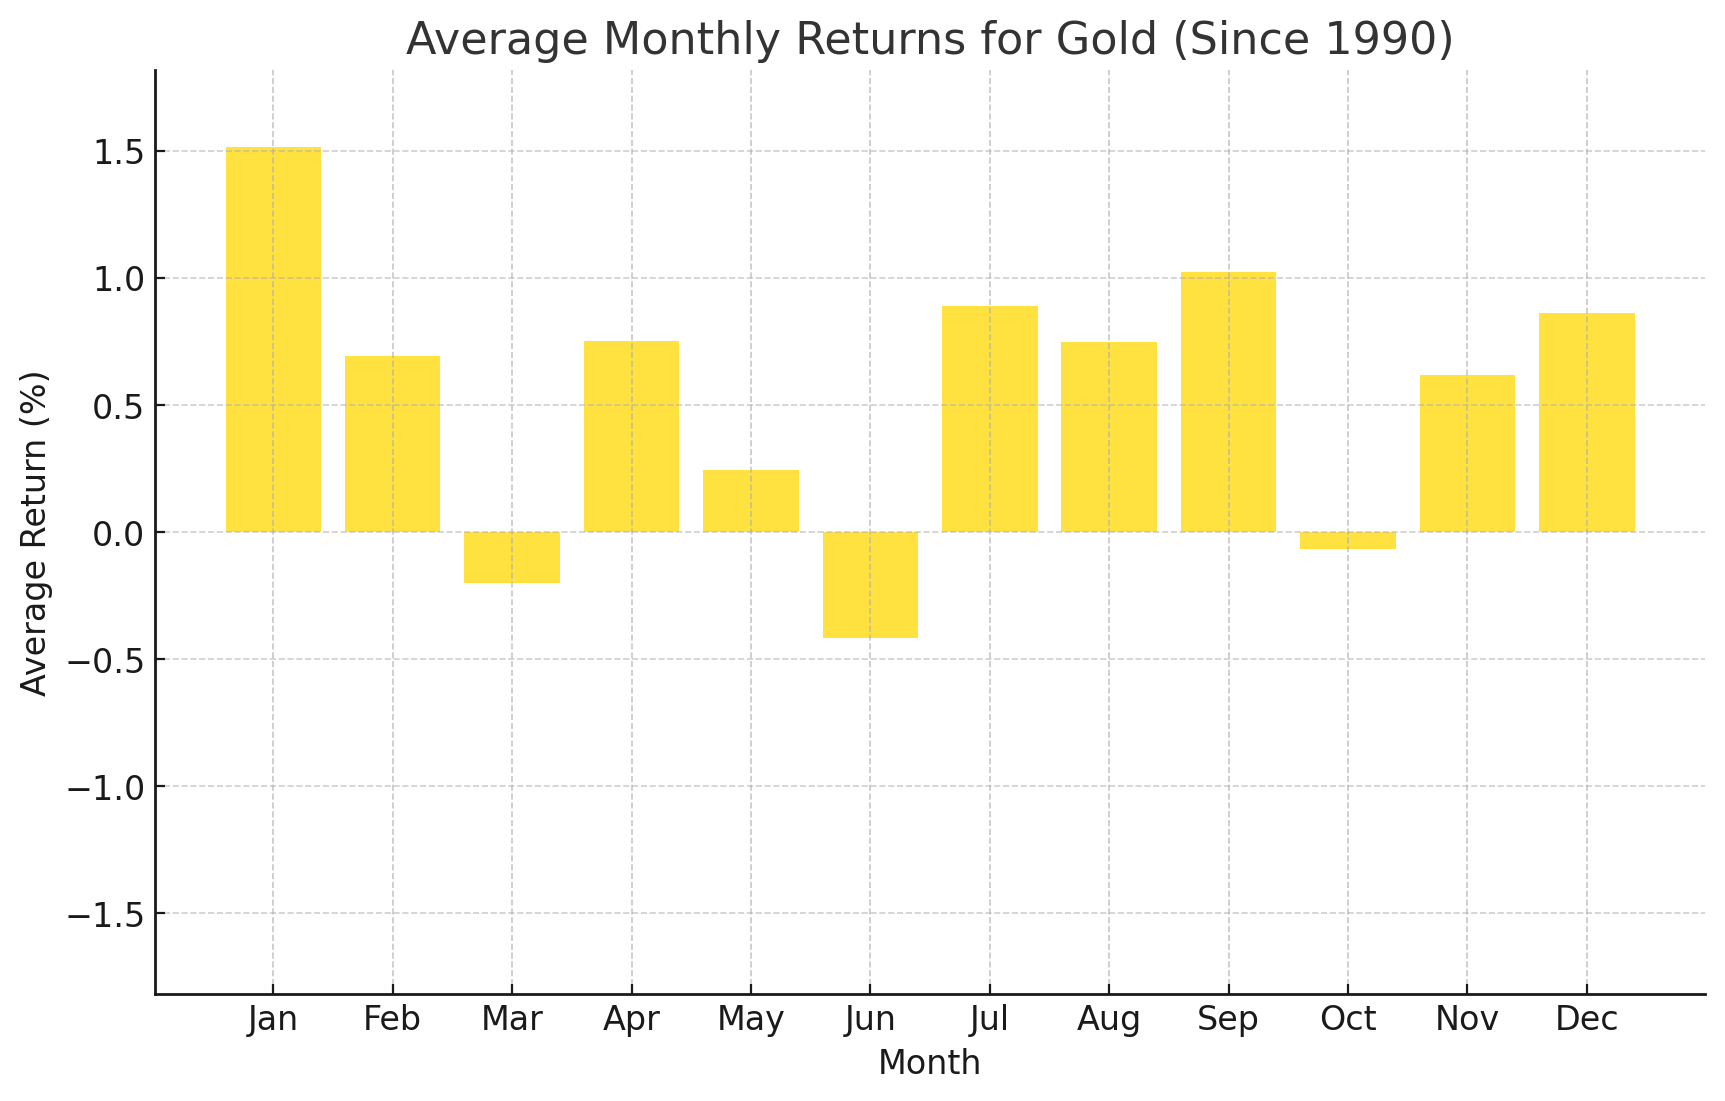
Turning our attention to commodities, September has historically been a bullish month for gold performance, with an average rise of 1.0% going back to 1990, the precious metal’s second-strongest month of the year. After consolidating for the last five months, gold is breaking out to record highs above $3500 to start September, setting the stage to extend its historic rally amidst still-falling interest rates globally, trade uncertainty, and a well-established uptrend going back to late 2022, and the seasonal trend aligns with those bullish fundamental factors, along with the technical breakout.


WTI Crude Oil Seasonality – WTI Chart
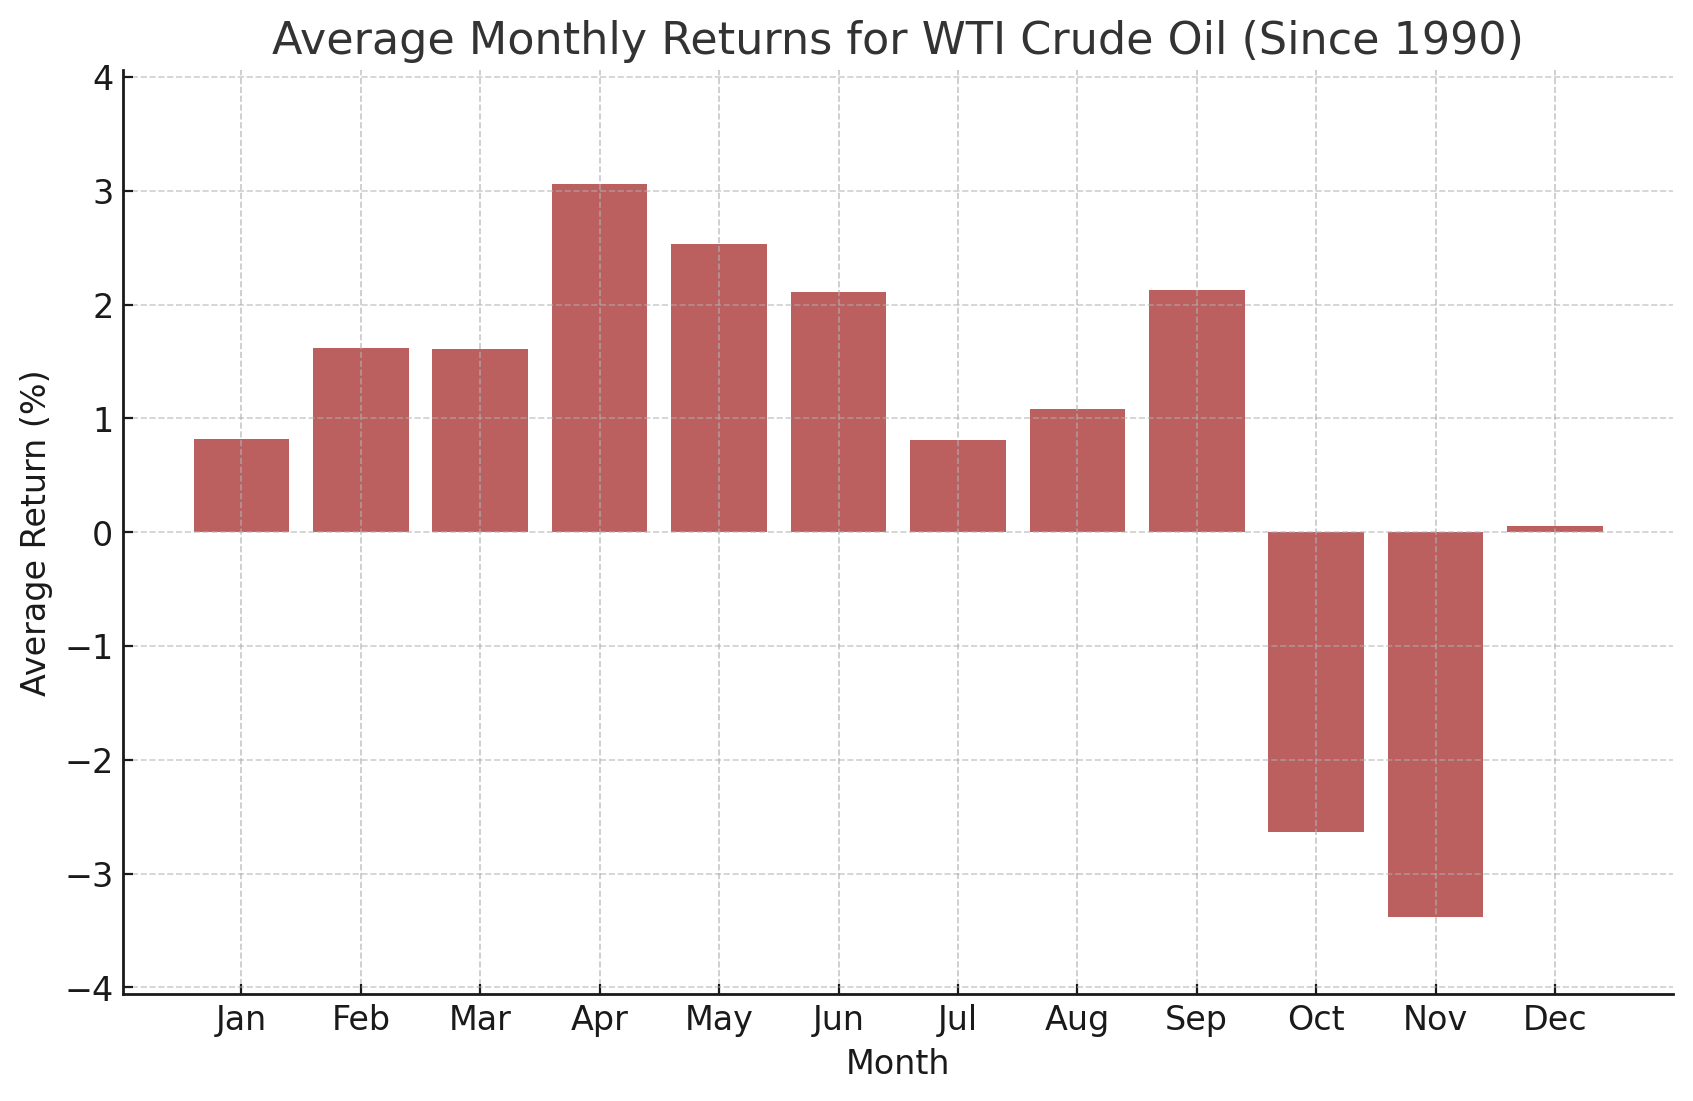
 Top Global Macro Seasonality WTI 05 02 2025

Source: TradingView, StoneX. Please note that past performance is not necessarily indicative of future results.

Last but not least, WTI Crude Oil has historically gained ground in September, with an average gain of +2.1% over the last 35 years. WTI rose in fell in August, remaining below a nearly 2-year bearish trend line. That said, the trend line sits up above $70, leaving room for a meaningful monthly rally if the seasonality holds before encountering resistance. A confirmed break above that barrier in the $73 area would be needed to shift the longer-term trend back in favor of the bulls, while the downside level to watch is near last month’s low in the $62 range.

As always, we want to close this article by reminding readers that seasonal tendencies are not gospel so it’s important to complement this analysis with an examination of the current fundamental and technical backdrops for the major markets and the global economy.

Follow the Global Macro Calendar

What are the major events and indicators on tap for the global economy that could charge volatility in markets and reshape deeper fundamental themes? Sign up for the updated Global Macro Calendar updated each week with a two week look ahead of the top events!

Sign Up


-- Written by: Matt Weller, Global Head of Research  

 

  • Energy

The subsidiaries of StoneX Group Inc. provide financial products and services, including, but not limited to, physical commodities, securities, clearing, global payments, risk management, asset management, foreign exchange, and exchange-traded and over-the-counter derivatives. These financial products and services are offered in accordance with the applicable laws in the jurisdictions in which they are provided and are subject to specific terms, conditions, and restrictions contained in the terms of business applicable to each such offering. Not all products and services are available in all countries. The products and services offered by the StoneX Group of companies involve risk of loss and may not be suitable for all investors. Full Disclaimer. This content is not intended for residents of any particular country, and the information herein is not advice nor a recommendation to trade nor does it constitute an offer or solicitation to buy or sell any financial product or service, by any person or entity in any jurisdiction or country where such distribution or use would be contrary to local law or regulation. Please refer to the Regulatory Disclosure section for entity-specific disclosures. No part of this material may be copied, photocopied or duplicated in any form by any means or redistributed without the prior written consent of StoneX Group Inc. The information herein is provided for informational purposes only. This information is provided on an ‘as-is’ basis and may contain statements and opinions of the StoneX Group of companies as well as excerpts and/or information from public sources and third parties and no warranty, whether express or implied, is given as to its completeness or accuracy. Each company within the StoneX Group of companies (on its own behalf and on behalf of its directors, employees and agents) disclaims any and all liability as well as any third-party claim that may arise from the accuracy and/or completeness of the information detailed herein, as well as the use of or reliance on this information by the recipient, any member of its group or any third party.


© 2026 StoneX Group Inc. all rights reserved.

Satellite view of Earth at night showing illuminated cities across Asia and the Middle East

Discover more insights

Our subscribers have access to comprehensive market analysis from StoneX spanning commodities, equities, currencies and more.

Related articles for Energy

Perspective: Morning Commentary for August 13

August 13 – The major stock indices traded quietly mixed overnight ahead of this morning’s weekly job numbers and producer price index data. Like Wednesday, this morning’s data was considered good as well, providing support for stocks while generally allowing Treasury yields to slip a bit lower. The VIX is trading near 14.4, which is just above yesterday’s new low for the year. The dollar index is trading near 99.8. Yields on 10-year Treasuries are trading near 4.64%, while yields on 2-year Treasuries are trading near 4.15%. WTI crude oil is trading near $81 per barrel, while Brent trades near $87 per barrel. Wheat prices again firmed overnight on geopolitical risks in the Black Sea Region, while corn and soybean prices pulled back modestly from yesterday’s big gains.

Arlan Suderman
Arlan Suderman
  • Grains & Oilseeds
  • Energy
  • Dairy
  • Renewable Fuels
  • Cocoa
  • Coffee
  • Cotton
  • Sugar
  • Meats & Livestock
  • Forest Products

Perspective: Morning Commentary for August 12

August 12 – Today’s focus is on inflation, with the July consumer price index data out this morning. We have this, and one more month of data, ahead of the next Federal Reserve meeting. Of course, headlines from the Middle East and the Black Sea wars also have an ongoing influence on the markets. Stock futures posted gains this morning, while the VIX traded just below 15. The dollar index traded near 99.7. Yields on 10-year Treasuries are trading near 4.66%, while yields on 2-year Treasuries are trading near 4.18%. WTI crude oil is trading near $83, while Brent trades near $88 per barrel. The grain and oilseed markets rebounded from yesterday’s losses ahead of today’s highly anticipated WASDE crop report that is due out at Noon Eastern Time.

Arlan Suderman
Arlan Suderman
  • Grains & Oilseeds
  • Energy
  • Dairy
  • Renewable Fuels
  • Cocoa
  • Coffee
  • Cotton
  • Sugar
  • Meats & Livestock
  • Forest Products

U.S. Dollar Index Cycles Turn on Levels Drawn Nearly Two Decades Ago

The levels that decide the U.S. dollar index cycle were drawn long before 2026, in channels dating back to 2008 and 2022. Razan Hilal walks through the monthly structure and what separates a pullback inside the trend from a genuine turn.

Editorial Team
Editorial Team
  • Energy
StoneX: We open markets

Our market expertise, advanced platforms, global reach, culture of full transparency and commitment to our clients’ success all set us apart in the financial marketplace.

Reach

With access to 40+ derivatives exchanges, 180+ foreign exchange markets, nearly every global securities marketplace and numerous bi-lateral liquidity venues, StoneX’s digital network and deep relationships can take clients anywhere they want to go.

Transparency

As a publicly traded company meeting the highest standards of regulatory compliance in the markets we serve, our financials and record of accomplishment are matters of public record. StoneX’s commitment to “doing the right thing over the easy thing” sets us apart in the industry and helps us build respect, client trust and new partnerships.

Expertise

From our proprietary Market Intelligence platform, to “boots on the ground” expertise from award-winning traders and professionals, we connect our clients directly to actionable insights they can use to make more informed decisions and achieve their goals in the global markets.