FOMC Subtle Hints as Bond Yields Rise, but Will the Fed Shift?
FOMC Talking Points:
- US inflation readings have started to level out in their retreat from 2022 peaks, which could complicate the macro picture moving forward
- Post-FOMC decision, the outlook for rates is more complicated as President-Elect Donald Trump potentially brings back policies that are difficult for the central bank to balance
If there’s one thing that’s stood out to investors this year around monetary policy, it’s been the Fed’s persistence towards rate cuts even considering seemingly positive data. There’ve been a few notable way points along the way, such as the February 13th US CPI print when data for both headline and core came out above expectation. The immediate response was equity weakness and US Dollar strength as markets priced-in the possibility that the Fed may not cut this year.
But, a day later Chicago Fed President Austan Goolsbee said in an interview that investors should avoid getting ‘flipped out’ about a single inflation print. The reality was it wasn’t a single print, as US CPI had been above expectation for more than a few months at that point. But that mattered little, as the US Dollar started to sell-off and US equities pushed-higher, driven by the confidence that the Fed would eventually cut in 2024.
To be sure there have been markings of possible weakness of late, like last month’s NFP report which showed the weakest headline print since December of 2020. But, from other vantage points, more questions remain, and these are items that could carry consequence down-the-road. Inflation, for instance, has been stubbornly above target all year from both year-over-year Core CPI and Core PCE. Last month showed another above-expected Core PCE print, and this is often considered as the Fed’s ‘preferred inflation gauge.’ Given that it takes time for monetary policy to transmit through markets which will then show through the data, it’s logical to assume that the September and November rate cuts aren’t showing here yet.
But – as the Fed said in 2023 as it was winding down rate hikes, the risk was that inflation could become entrenched at a high level and given how stable that above-target Core PCE reading has been this year, at least on a year-over-year basis, it seems that something of that nature could be taking place.
US Core PCE YoY

Chart prepared by James Stanley
Fed Forecasts
When the Fed cut by 50 bps in September, they also published updated forecasts and that’s what really helped to push macro markets. They were looking for Fed Funds to drop to between 3.1% and 3.6% by the end of 2025, and with the rate cut already largely priced-in, it was that expectation for many more cuts that drove equities to fresh all-time-highs.
At yesterday’s cut, no updated projections were provided and for that, we have to wait until December where we can see how the Fed has shifted their expectations.
Fed Summary of Economic Projections from September
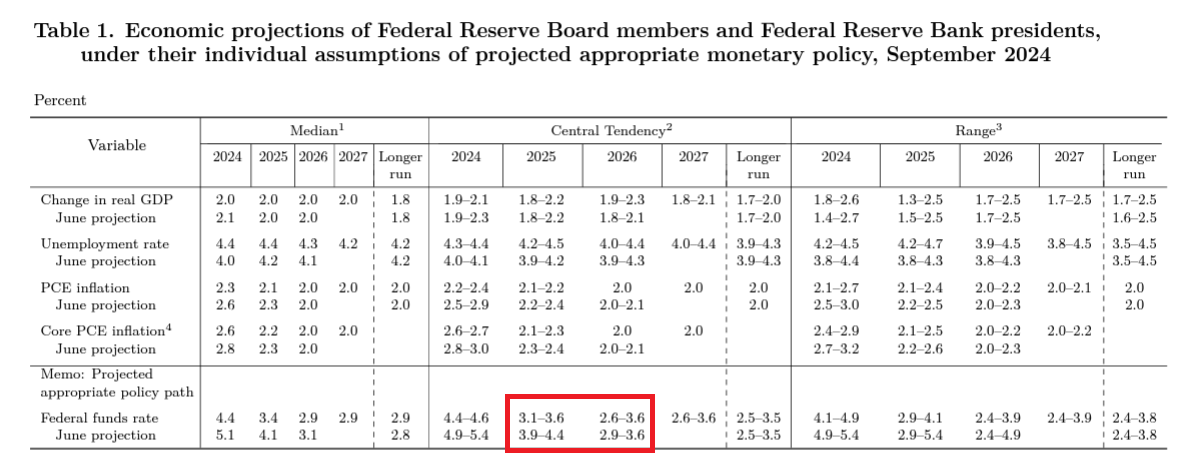
Image prepared by James Stanley; data derived from Federal Reserve, September Projections
Perhaps the unexpected response at the Fed was what happened at the long end of the curve, as US Treasury rates for 10- and 30-year maturities shot-higher; the opposite of what they probably expected.
It’s important to remember that the Fed only controls overnight rates and longer-term rates are very much at the mercy of market dynamics (and the US Treasury department which controls supply at various maturities along the curve). But longer-term rates going up are what carry consequence to actual consumers, as it also comes along with higher mortgage rates and as we’ve seen over the past 15 years, housing plays a massive role in the performance of the macro-economy. It’s also something that stock investors are keenly aware of for a number of reasons: Higher borrowing costs for companies issuing debt, opportunity cost for investors allocating capital between stocks and bonds, and the potential for what those higher rates might be saying about future expectations.
When Powell was asked about this at yesterday’s press conference accompanying the rate cut, he seemed to shrug it off, referring to last year’s episode when the 10-year briefly traded at 5% before softening considerably. It was that softening in long-term rates that helped to drive equity prices into the end of 2023 and through the 2024 open, coupled with that continued expectation for the Fed to eventually start cutting rates.
But since the Fed cut rates in September, long term rates have started to shoot-higher and the big question here is whether that’s signal or noise. If it’s signal, well then that’s the market pricing in higher inflation expectations under the presumption that the Fed hasn’t finished the job on inflation. It’s also something that could, eventually, take a toll on stock prices.
Over the past couple years there’s a relationship there, where softening yields have helped to boost equity prices, and rising yields have become a wet blanket to stock gains. That hasn’t played out in the most recent episode, however, as both stocks and bond yields are up since the Fed started cutting rates in September.
US 10 Year Yields (Red) v/s S&P 500 Futures (Blue)
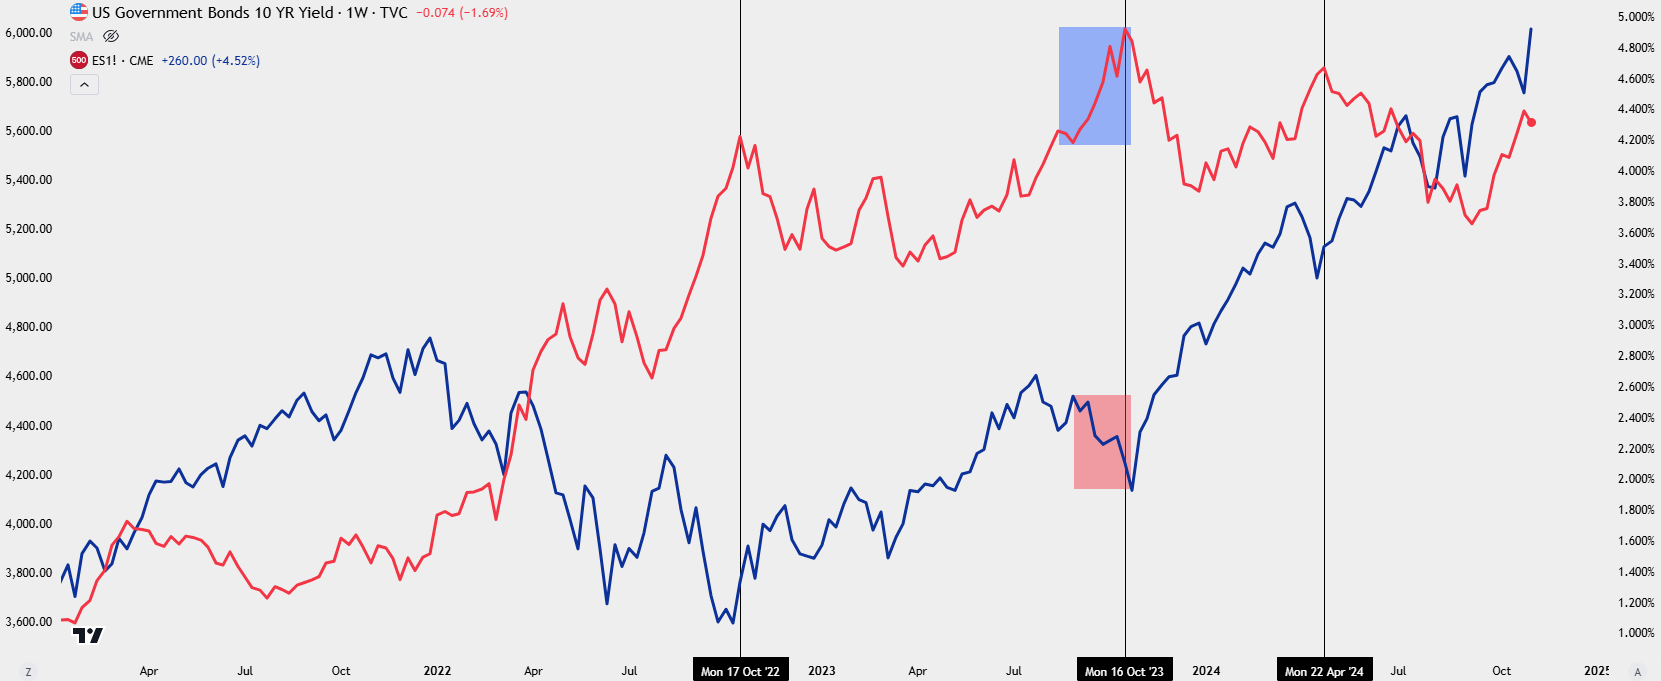
Chart prepared by James Stanley; data derived from Tradingview
Subtle Hints
In yesterday’s statement accompanying the rate cut announcement, the Fed removed an important line referring to the bank having confidence that inflation was under control. The immediate response was clear, S&P 500 futures pulled back from the 6k level of resistance and the US Dollar jumped-higher. During the press conference Powell downplayed this though, and from the market reaction, he did so quite well. He said that the bank wanted to avoid giving any forward guidance and that was reason for removing the phrase, even though their actual action indicates confidence given that they did actually cut rates. But there’s another storyline here and it’s something that harkens back to 2016 when the Fed was at a different important pivot.
Trump and a Supermajority
In 2016 the Fed had hiked only once since the financial collapse, and that was in December of 2015. But when Trump won in November of 2016 the Fed started to suddenly sound more hawkish. Janet Yellen, current Treasury Secretary, was the Fed chair at the time and she hinted at the fact that a Republican supermajority would likely face little resistance to pushing fiscal stimulus, and that risked over-heating the economy if rates weren’t adjusted higher.
In December of 2016 just a month after the election, the Fed hiked for only the second time since the 2008 collapse. And then in 2017, the Fed hiked three times for 25 bps each. And then in 2018, there were four rate hikes at 25 bps each.
Amazingly, equity markets continued to shoot-higher throughout, and despite an early flare of strength in the US Dollar in the wake of the election, the US Dollar sold off for most of 2017 as the long equity theme played out aggressively.
It was in the middle of that rate hike cycle that Trump replaced Janet Yellen with Jerome Powell. And that relationship didn’t seem to get off on the right foot as Trump wanted softer rates and a more-friendly monetary backdrop and Powell did not seem to want to comply. When the Fed was hiking in 2018 the big question began to bubble to the surface: ‘Where’s the neutral rate,’ or, more simply, for how long the Fed was planning to hike until they finally stopped.
Powell had a mis-step in October of that year when asked that question, and he responded with ‘a long way off,’ read by investors to mean that the Fed would continue to hike until something broke. Well, it didn’t take long but equity markets turned over quickly and continued to do so into the December FOMC meeting, when the Fed hiked again (their 4th hike that year). The sell-off seemed to gain speed into the holidays when, eventually, the Vice-chair at the time, Richard Clarida, remarked in an interview that the Fed wasn’t committed to more hikes in 2019.
That helped some support to show and, eventually, buyers jumped back on the bid. The Fed ended up cutting three times in 2019 and US equities were back to a fresh all-time-high by summer of that year.
S&P 500 with FOMC Rate Moves Since the GFC

Chart prepared by James Stanley; data derived from TradingView
Trump and a Supermajority Part II
The US economy has held up well so far this year, all factors considered. There was of course some question around the Fed’s persistent push into a dovish posture with the 50 bp cut in September, which helps to explain the reaction in long bonds. But at yesterday’s rate cut Powell was noticeably evasive on topics around politics. And given the prior confrontation between Powell and Trump, the Fed chair was directly asked if he would resign from the post if Trump asked. His response was a terse one word of, ‘no.’
When later asked why or whether it would even be possible, he again had a terse response saying, ‘not permitted by law.’
Also, during that press conference Powell had a dovish overall sound and the immediate response was USD weakness returning, along with higher stock prices and S&P 500 futures testing above the 6k psychological level.
In the coming weeks, the focus will be on Fed-speak from other Fed members as markets try to gauge just how dovish they remain to be with the new political backdrop. Hints of a shift away from the rate cuts that have been widely-expected for next year could take some wind out of equities, although that’s not something that I’m expecting to show just yet.
Perhaps a more proactive point of emphasis is the bond market. In the aftermath of Trump’s win, the 10-year tested above a major level at 4.34%. This was the high in 2022, which came in right around the time that equities set their current cycle low.
When the 10-year ramped above that level in 2023, that’s when equities really began to sell-off with speed until, eventually, the 10-year began to back down from the 50% marker.
And at the Q2 open of this year, 10-year notes again traded above a 4.34% yield and equities showed a decisive pullback, but that only lasted for a few weeks and lower yields came along with recovering stock prices that soon hit another fresh all-time-high.
For this week, the 10-year tested above that level but is now pushing below it, which can be seen as another sign of support for stocks. But if we do see the adverse scenario where long bonds trade at higher rates, under the presumption that the Fed hasn’t finished the fight with inflation, whether that’s driven by a shift from the FOMC or not, then stock prices could be vulnerable into next year.
US Treasuries – 10 Year Note Yield, Weekly Chart
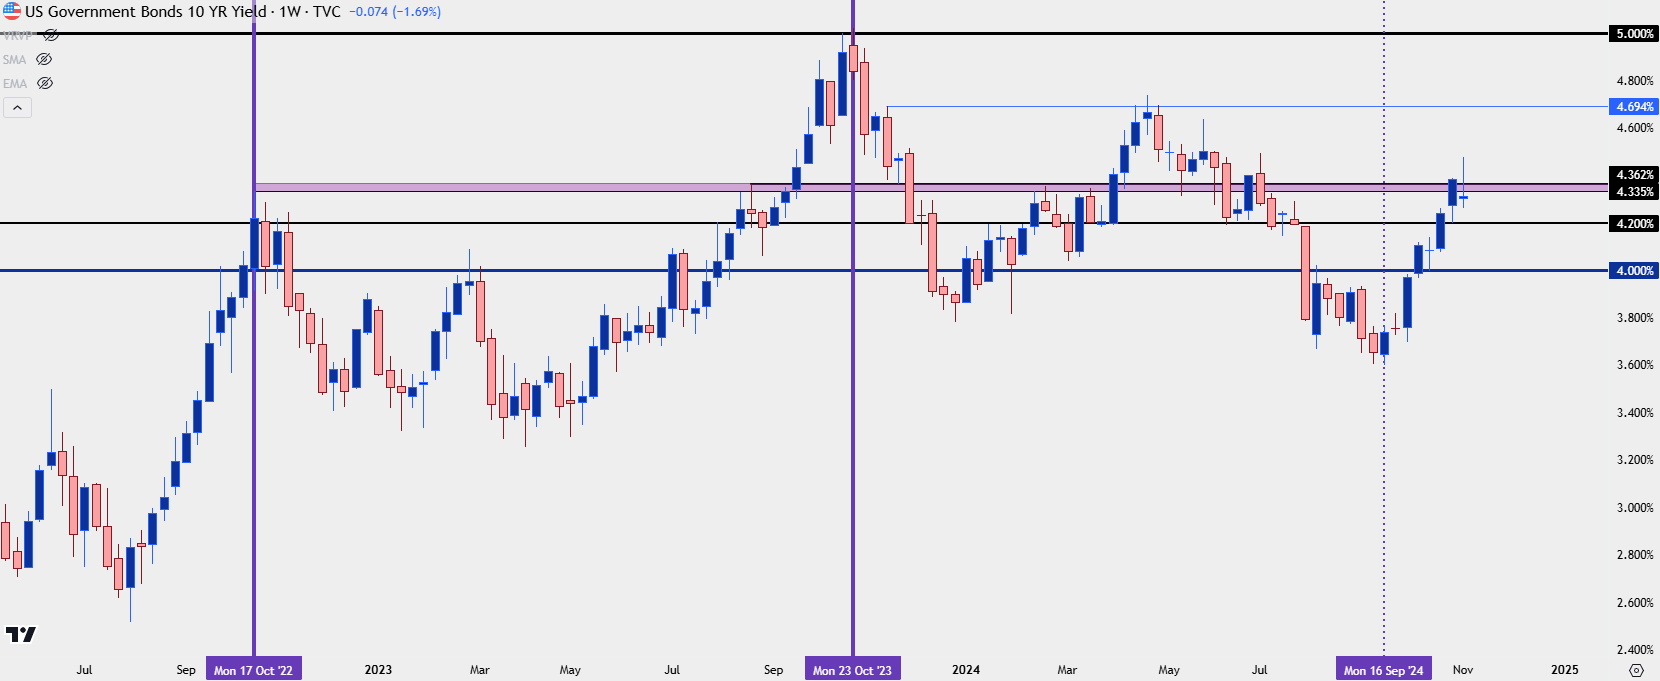
Chart prepared by James Stanley; data derived from TradingView
--- written by James Stanley, Senior Strategist