StoneX logo

April '25 Farmer Fertilizer Focus - Urea

By: Josh Linville, Vice President- Fertilizer

April '25 UREA
 
Josh Linville
Fertilizer - Vice President
StoneX Financial Inc. - FCM Division
Major Global Urea Export Location Price Graphs

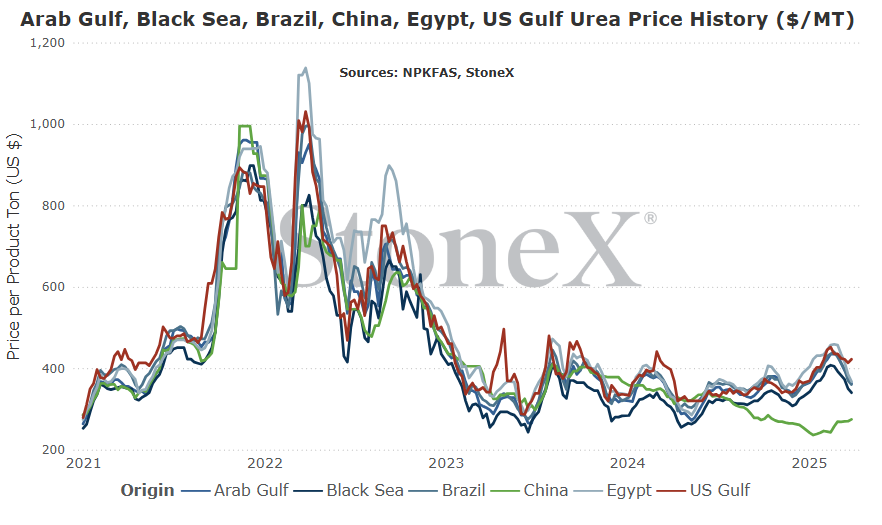
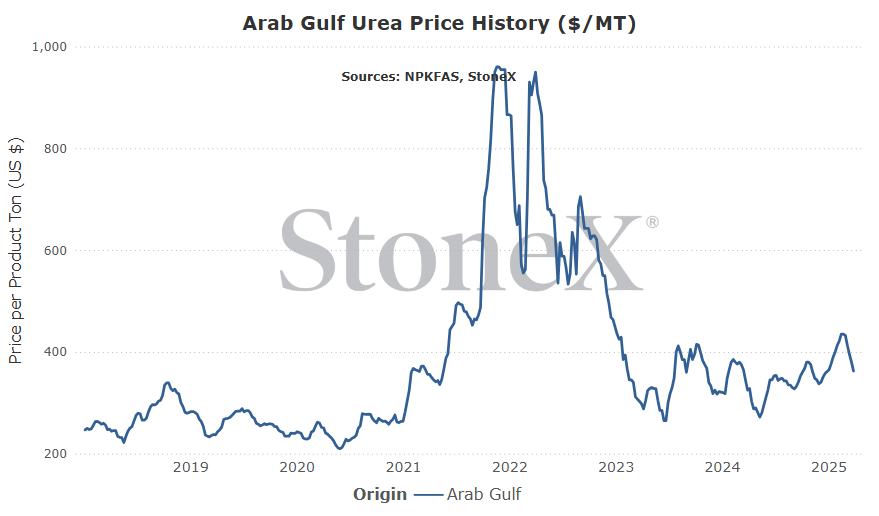
The intention of the below graphs are not to use to say "my price should be X based on this graph".  These prices are derived from an FOB price point average.  The intent is to show major global price movement trends.  Your values will likely have significant basis difference (similar to your local grain price being different than the traded market price).

This graph is labeled as MT in USD currency.

image-20250331115748-7

What everyone wants to know first, what do we think will happen going forward
GLOBAL
Global values have been weak since the March edition.  Could they push higher in April?  Absolutely...but it would take a lot of things coming together to make that happen.  Much like every parley bet I have taken, it never works out!!!
India has shocked the market in delaying their purchase tender.  After failing as hard as they did in December and January, it was nearly a guarantee that they would make an announcement in February...until they didn't.  The rest of the global buyers picked up on their approach and delayed their own purchases.  The result has been a market largely void of demand which has sent values sliding.
While there is a path to higher prices from where we sit today, there are many more paths pointing lower.  Buyers have made their will known and supplies have grown as a result.  More importantly is the calendar.  We are already nearing what would be considered typical summer reset months.  That is going to weigh more and more on sellers minds.
If we see a situation where India announces their purchase tender and as a result, we see a lot of other major buyers step in, we could see a competition for tons that leads prices higher...but that is not our expectation.  We are watching for prices to slide a bit as we look to May.
NORTH AMERICA
NOLA/N.A. values have not been immune to global urea price weakness in the last month.  The surprising bearishness in global markets have helped NOLA values to weaken as well.
But we also have to consider our own situation with where we are today.
This is the April edition, which means that our calendar is quickly severing ties to the global market.
Fortunately, official import data for January has looked solid (higher than our forecast) and market liquidity points to solid February/March imports as well.  This has been a much needed surprise given the N.A. discount to the world.  However, time to line up more imports is growing thin.  When you think of the distance between the Middle East (N.A. largest provider of urea tonnage), it takes nearly a month for a vessel to arrive.  So a vessel purchased on April 1 likely doesn't arrive until May 1...and then it is sitting at a port.  It takes a few more weeks for that material to arrive at the retailer/farmer storage.  That quickly becomes June.
This is the weird part of the year where NOLA/N.A. values may not mirror global price moves.  Fortunately, the last month has seen prices slide a bit which does help sidedress pricing outlooks.  But also, we need to realize that demand has been rising quickly with corn acre forecasts continuing higher.  It creates a predicament.
With global values having fallen in the last month and likely looking weak for April, that will pressure price ideas along the coastlines...but the further to the interior you get, the harder it will be for these cheaper tons to arrive in time.
I would expect to see price ideas in places like NOLA continue weaker thru April, but those lower prices may take more time to arrive further inland.  Might be a sidedress relief.
 
General Global Urea Information
image 97976
image 97977
image 97978
image 97979
What has happened in the last 30 days?
Chinese urea exports remain very low...will it every improve?
For those in the market that had been holding out hope that Chinese urea exports would return to start 2025 have been left disappointed.
China plays a major role in the global urea marketplace.  Typically speaking, the global export marketplace ranges from 50 - 55M tons per year.  To put China into context, their recent history had them around 10% of that total or around 5 - 5.5M tons per year.  Their participation, or lack of participation, went a long way in determining the market.  When they were exporting heavily, it was widely seen as a bearish signal as the market feared competing against a Chinese ton. When China scaled back on exports, it was widely seen as a bullish event.
The lack of Chinese exports has played a big part in global urea prices staying higher.
In late 2021/early 2022, global urea supplies were extremely tight and prices were skyrocketing.  This caught the attention of the Chinese government.  Rather than allow free market forces to dictate what was to happen, the Chinese government stepped in with two goals:
1. Ensure adequate supplies for Chinese farmers.
2. Lower domestic prices vs the world for domestic farmers
Fortunately for Chinese farmers, this strategy worked like a charm.
Unfortunately for the rest of the world, this strategy worked like a charm.  
This story really came to a head last year (2024) when Chinese exports dipped to historically low ranges.  Only around 266K tons TOTAL were shipped from Chinese ports.  The result is that Chinese farmers have been enjoying some of the cheapest urea values in the world.  We also continue to see and hear reports that point to extremely high inventory levels.  This was seen by some as a sign of export hope as we began 2025.
January and February Chinese trade data sure disappointed that crowd.
Only 4,000 tons between the 2 months were exported.  A country that normally exports north of 400K tons per month was unable to even reach 5 figures.  Needless to say that this has disappointed those hoping for lower prices in the near term.
Now, there is still some hope that things will improve in 2025.  We continue to see and hear that urea operating rates within China remain very high which basically means they are producing a lot of product every day.  We also continue to see and hear that urea stockpiles in China remain at record high levels.  So if inventories are at high levels and they are still producing a lot every day, the hope is that exports will have to resume.  If that plays out, then global urea markets will trend lower for fear of the competition, giving global farmers a chance to lock in lower prices.
One word of caution, never expect China to do what you think it will do.
Most of the world looks at fertilizer from a free market perspective.  We think that timing, pricing, etc. determine what will happen.  That isn't always the case with China.  They see things from a communist POV.  One of the biggest dangers to communism is not outside forces.  Rather, it is an uprising by its people.  Who is one of the largest blocks of people in China?  Farmers.  By taking steps to keep domestic fertilizer prices low, that is seen as a win by the largest block of people.  In recent months, the mere rumor that exports were going to start being allowed caused domestic Chinese values to rise.  No doubt this was seen by government officials who will use this information going forward.
Hopefully as we move past the Chinese spring season, we will start to see exports resume and give global farmers some much needed relief.  Until that time, the world continues to operate without one of its largest suppliers.
image-20250331080739-1
What does this mean for farmers?
Long story short:  higher prices.
Now this does not mean that prices will do nothing but move higher.  Absolutely not.  Global and domestic markets will continue to ebb and flow.
However, it does mean that the market has a higher floor than normal.  Very few markets in the world can lose 10% of its supply and not have its price floor rise.  
Unfortunately, I think the Chinese government is going to continue to play a larger part in determining its export programs in terms of urea.  They have learned an important lesson the last few years.  However, they also need to appease their manufacturers as well.  I think what we will see in the future is a more strategic approach.  Rather than allow exports whenever/wherever, they will tell the market when they can export (no doubt not in spring season) and how much they can export.  This approach would allow manufacturers to get rid of some excess length while capping domestic price increases.
Sorry to say, China is going to continue to be a big part of global urea price movements.
 
Iranian urea production back to 100%...but damage already done
Many in the urea global market looks at Iranian production/exports and thinks "they do not matter because I cannot do business with them".
I am here to tell you that is a VERY dangerous approach to the market.
Much of the free world looks at Iran as inconsequential due to long-term heavy sanctions.  These sanctions means an inability to do business with their urea manufacturers.  That ultimately means it is very easy to effectively write them off when looking at the overall market.
However, even though one cannot do business directly does not mean those tons do not matter to the overall global S&D.
The world spends a lot of time discussing Chinese export approaches due to their size.  What I think many miss is Iran's typical size.  In 2024, 4.8M tons left Iran for the world...nearly the same size that China would historically ship.  So if we spend so much time and effort trying to figure out what China will or will not do, we should do the same for Iran.
So, back to these long term sanctions.
These have made it very hard for companies in Iran to do business.   Not only is it hard to find global experts willing to come and work on facilities, it is also hard to secure parts needed to repair/replace old machinery.  We believe 2025 started with this being an issue for their natural gas markets.
Very early in the year, we started to hear reports that Iranian urea production was slowing/stopping due to a lack of gas supplies.  Some quickly decided that it was largely a short-term event that was tied to larger winter domestic demand.  However, it lasted much longer than that.  It wasn't until a couple weeks earlier that we finally heard production returning to normal rates.  As is typical, firm details can be hard to find but we believe nearly two months of production was lost.  That equates to around 750K tons.
In this current market, that loss hurts.
The global urea market is already dealing with a lack of Chinese exports and European production remains around 75% of normal.  Those two events have removed most, if not all, of the excess product around the world.  That means it is either very hard or impossible to lose more production like Iran.  Having this happen in the lead up to the Northern Hemisphere spring season also doesn't help.
Fortunately, their production has returned which means worst case scenarios are now taken off the table but damage has been done...

What does this mean for farmers?

Long story short:  more price support in the leadup to spring.

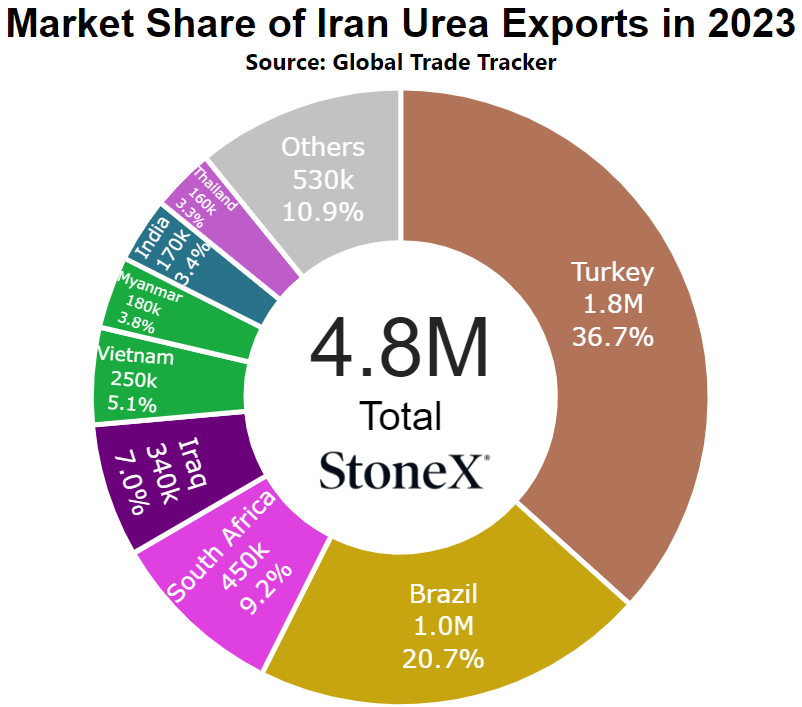
This was the hit that the global urea market didn't need.  China feel 5M tons short on exports last year and started 2025 even lower.  Europe continues to produce at 75% of normal which is around 3 - 3.5M tons per year that is missing.  Losing another 750K tons of Iranian production isn't the help we needed to see prices lower.

Again, this does not mean prices cannot drop or be volatile (as has been the case).  It does, however, raise the price floor a little more.

The global urea market does not have a lot of excess length due to all these issues so anytime something like Iran happens, it gets felt.

U.S. January trade data surprisingly high
We spend a lot of time watching the price relationship between NOLA and other global points as it can go a long way in determining what imports will look like.  When NOLA is a discount, it makes sense that tons ship elsewhere (assuming there is somewhere else to ship) rather than take the lower price.  When NOLA moves to a premium vs the world, that is North America's way of "calling" on imports.  These discounts/premiums can help determine was import flows will look like and give a better look at what will be needed ahead.
For much of this fertilizer year (starting July 1, 2024), NOLA has been a discount to the world.  My biggest watch point is Middle East pricing given that nearly half of U.S. imports come from that region.  The graph below shows that price relationship over years.  It shows the weekly price comparison of NOLA urea vs Middle East urea replacement values differential.  It might be a little hard to see so I added the 2nd graph which only shows 2024 and 2025 thus far.  That graph should more easily show NOLA's discount.
However, this price relationship is only one part of the equation.  If global supplies are big, then manufacturers might not care about a discount.  If they look to North America, see a discount but also see a chance to offload heavy inventories, that may still be the right call.  But the world has not been operating on heavy inventories.  China continues to be extremely slow on exports.  Iran has had production issues.  Europe also has production issues with no short-term change expected.  The world has been very tight so we believed that NOLA being a discount would lead to disappointing flows.
January was anything but.
We had been forecasting around 450K tons to arrive in January and honestly, that felt like too high a number given the circumstances.  When we saw the data reflecting 570K tons arriving, that was a big relief!
There is still work to be done.  We continue to use 5.1 - 5.2M ton imports for total fertilizer year 2025 imports of urea.  January brought the cumulative total to 1.9M tons.  That leaves 3.25M tons that need to arrive February thru June.  That is a very doable amount of tons, presuming there are no further hiccups to global supplies/production or demand. 
All is well for North American urea...for now. 
 
image 110337
image 110338
What does this mean for farmers?
Long story short:  bigger than expected January imports helps to build supplies to meet spring demand.
If the January import data had been very low/disappointing, it would have been cause for concern.  That would have put an immense amount of pressure on NOLA urea values to push higher than the world in order to basically beg for more tons.  That higher cost would eventually work its way to the farm gate.
Fortunately, with imports decent (and assuming it continues for February/March), there is less concern of needing to call those tons in.  That means less of a need for NOLA/N.A. values to skyrocket in a desperate attempt to buy any available ton in the global market.
Hopefully the import flows continue healthy.
 
If the global S&D is so tight, why are prices falling?
One of the big surprises of the last month is how bearish urea values have been.  Global supplies are incredibly tight with Chinese exports extremely low, Europe still struggling with high nat gas prices, and Iranian production going offline for the better part of 2 months.  Global production has struggled to keep up with global urea demand and the difference between the two today is relatively narrow.  
Even with that situation, if you look below, you will see that a lot of price points went down over the last 30-days.  What gives?
A lot of it goes to India who drug their feet on their hotly anticipated purchase tender.
For those new, India has been trying to buy a big block of tons since December.  They announced mid-December their intention to buy 1.5M tons but only secured around 200K (going off memory on these numbers).  After falling so short, they announced a fresh tender in January for 1.5M tons.  They did better, but still well short with just under 600K tons secured.
Many in the industry, myself included, thought that we would see them return mid-February for a third try.  The global urea market heated up on price with buyers scurrying to lock up prices before they went higher.  Mid-February came and went...no tender.  Late-February came and went...still no tender.  Once the calendar turned to March, many started to ponder just how long they could wait to buy.  Other global buyers started to see some price pressure and opted to hold back in hopes of further price deterioration.  
As fertilizer does, when demand goes quiet, prices tend to slide and slide they have.
However, last week saw India announce their tender.  They are looking for...you guessed it, 1.5M tons!!  800K for west coast ports and 700K for east coast ports.  The return of India has helped the urea market find its footing and prices have been on the rebound.  As I write this, many of the global values are even closer to where they were before the slide.  
This is just the fertilizer market.  There was some surprise that India could wait as long as they could, but everyone knew they had to come back.  Regardless, prices slid.  Now, no one is surprised that India did announce the tender...but prices are up anyways.  Sometimes the emotion of a market can dictate price better than the fundamentals.
At the end of the day, global supplies are still very snug so seeing this correction higher isn't a surprise...but we will need to see how long it lasts because the summer months are looming.
What does this mean for farmers?
For those that have been inquiring, there might have been an opportunity for some lower priced sidedress tonnages.  No doubt many will hope that nearby ship tons will come down substantially but as in most things around the world,  prices are fast to go up but slow to drop.
As I write this, the market is back in bullish swing which makes sense given how tight the global S&D is.  
 
Where are current values in relation to the past

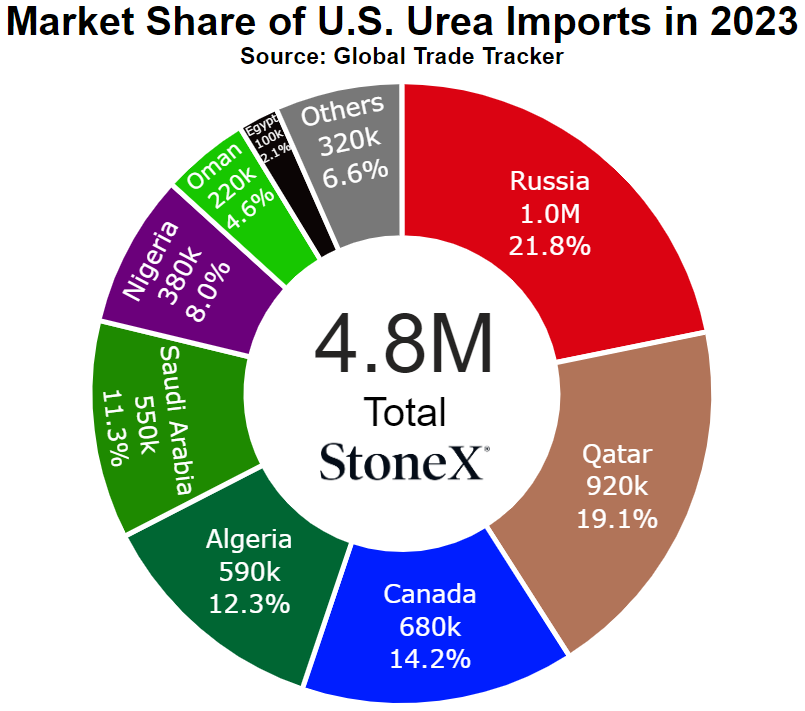
NOLA/New Orleans, Louisiana 

Number 3 global importer in 2022
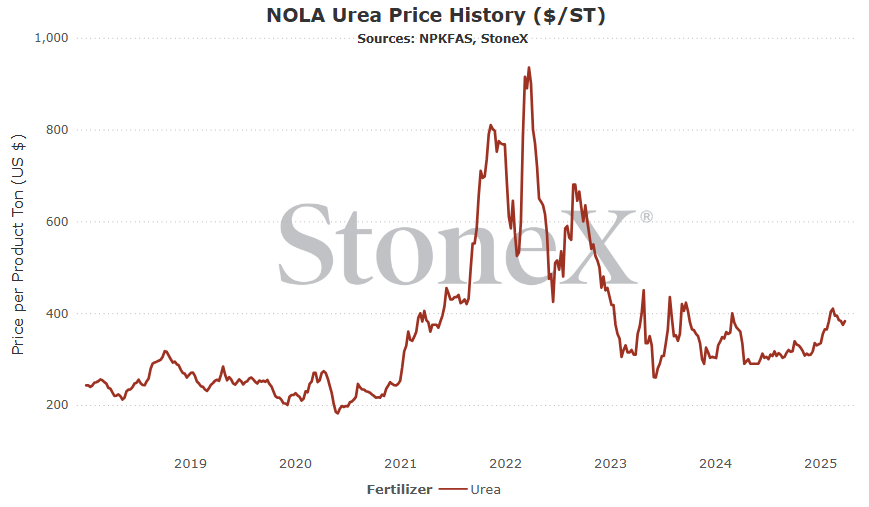
image-20240826091327-1

Price comparisons

Vs 30 days ago - -3% or approximately $12 lower

Vs 90 days ago - 14% or approximately $48 higher

Vs 6 months ago - 21% or approximately $66 higher

Vs 1 year ago - 6% or approximately $23 higher

image-20250331114955-1

U.S. Midwest Average

Vs 30 days ago - -6% or approximately $31 lower

Vs 90 days ago - 16% or approximately $63 higher

Vs 6 months ago - 24% or approximately $90 higher

Vs 1 year ago - -2% or approximately $9 lower


U.S. Southern Plains Average

Vs 30 days ago - -3% or approximately $13 lower

Vs 90 days ago - 17% or approximately $68 higher

Vs 6 months ago - 24% or approximately $88 higher

Vs 1 year ago - -7% or approximately $35 lower


U.S. Northern Plains Average

Vs 30 days ago - -6% or approximately $31 lower

Vs 90 days ago - 9% or approximately $39 higher

Vs 6 months ago - 24% or approximately $87 higher

Vs 1 year ago - -3% or approximately $14 lower


Middle East

Number 1 exporter (as a region, not as individual nations)

image-20240826091434-3

image-20240826091459-4

image-20240826091529-5

image-20240826091558-6

Vs 30 days ago - -16% or approximately $70 lower

Vs 90 days ago - -1% or approximately $3 lower

Vs 6 months ago - 3% or approximately $10 higher

Vs 1 year ago - 12% or approximately $38 higher
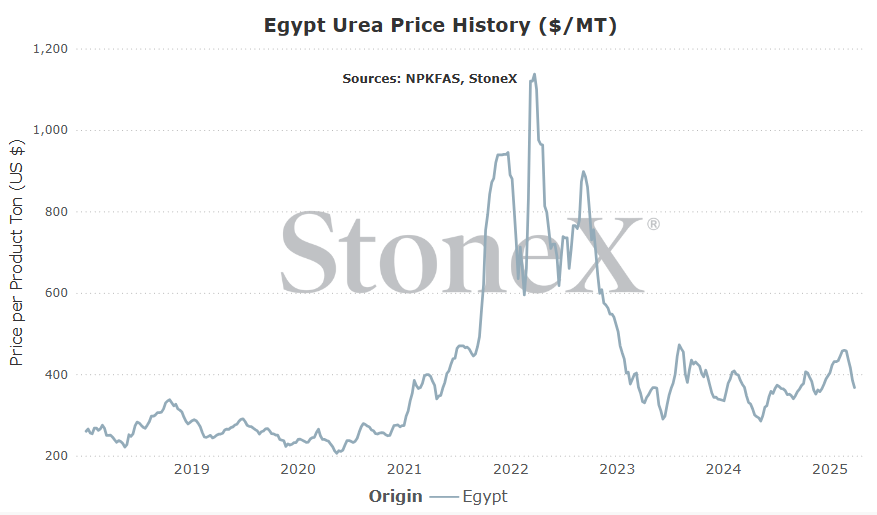
image-20250331115223-2

Egypt

Number 4 global exporter in 2022
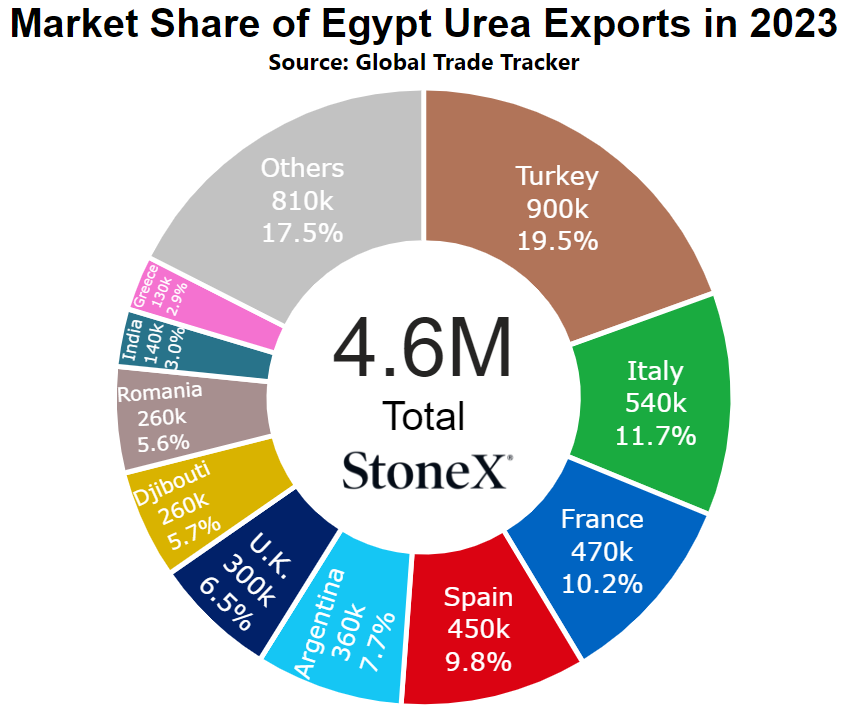
image-20240826091630-7

Price comparisons

Vs 30 days ago - -20% or approximately $90 lower

Vs 90 days ago - -9% or approximately $37 lower

Vs 6 months ago - -1% or approximately $5 lower

Vs 1 year ago - 11% or approximately $37 higher
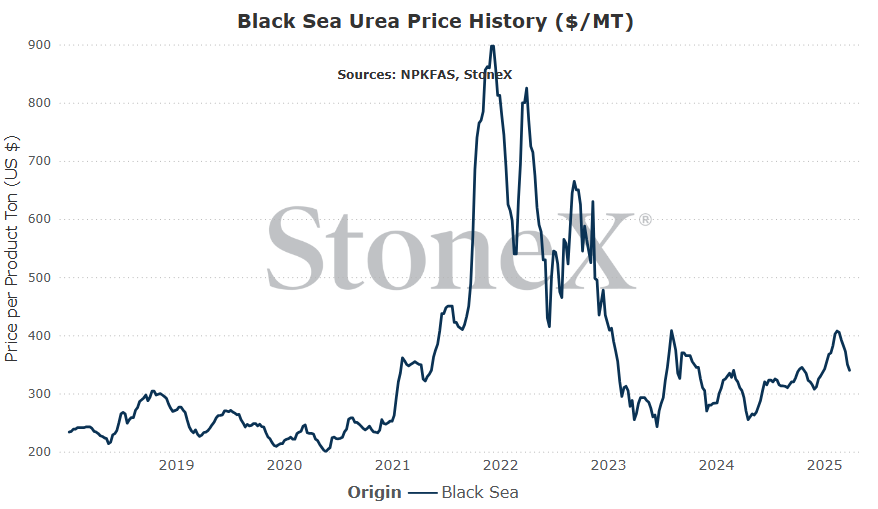
image-20250331115326-3


Black Sea

Number 1 global exporter in 2022

image-20240826091656-8

Price comparisons

Vs 30 days ago - -13% or approximately $53 lower

Vs 90 days ago - -1% or approximately $3 lower

Vs 6 months ago - 4% or approximately $13 higher

Vs 1 year ago - 11% or approximately $35 higher
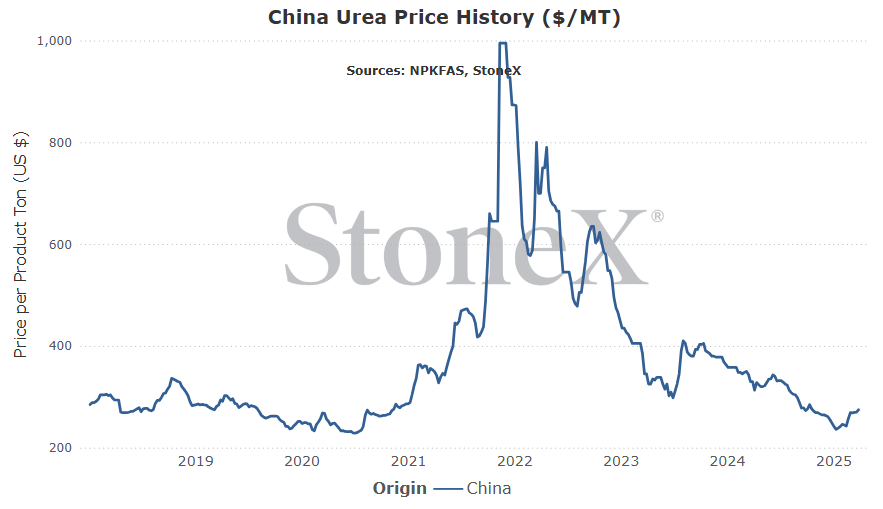
image-20250331115415-4

China

Number 9 global exporter in 2022
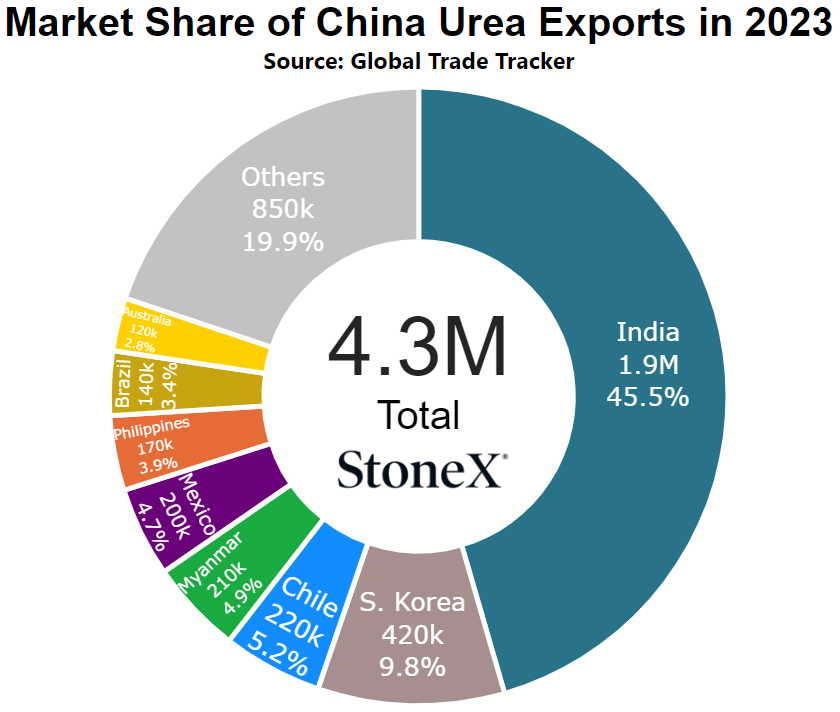
image-20240826091723-9

Price comparisons

Vs 30 days ago - 2% or approximately $6 higher

Vs 90 days ago - 14% or approximately $33 higher

Vs 6 months ago - 1% or approximately $2 higher

Vs 1 year ago - -17% or approximately $56 lower
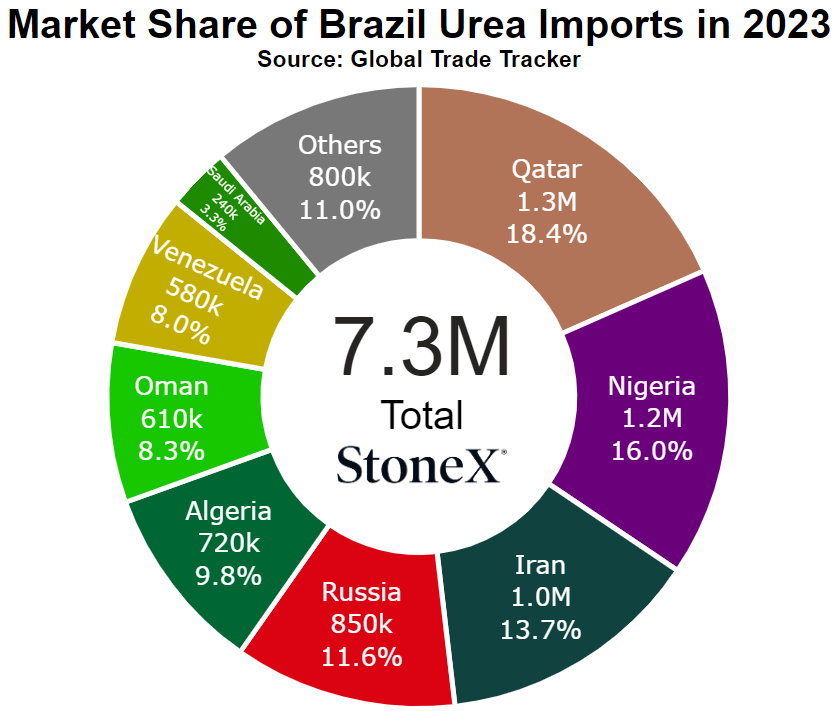
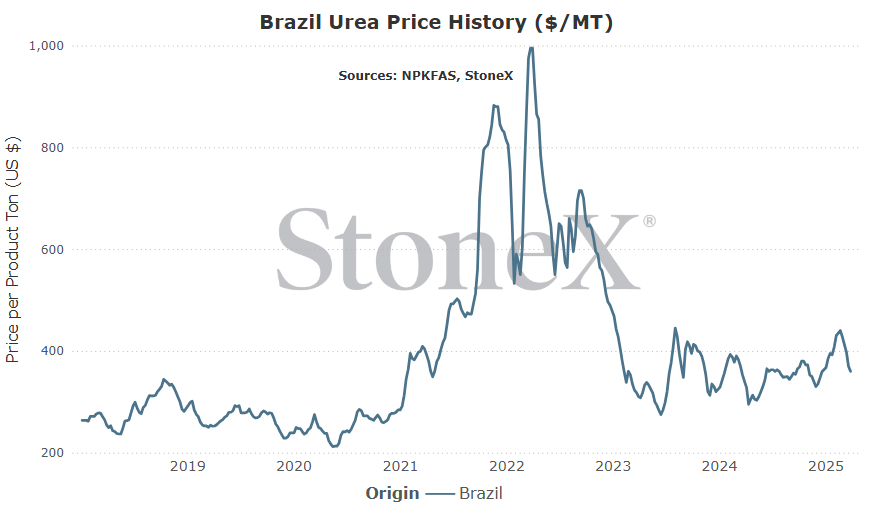
image-20250331115511-5

Brazil

Number 2 global importer in 2022

image-20240826091747-10

Price comparisons

Vs 30 days ago - -16% or approximately $68 lower

Vs 90 days ago - -2% or approximately $8 lower

Vs 6 months ago - -1% or approximately $5 lower

Vs 1 year ago - 6% or approximately $20 higher


image-20250331115629-6
Bull/Bear Factors
Because no market is ever guaranteed to go higher/lower, we try to consider the factors that can sway values so that we are able to act when they occur rather than react.
Bullish Factors
  • India is met with other buyers/proud sellers - India took their sweet time with their purchase tender announcement, but that delay worked to their favor.  Had they announced in mid-February as we previously believed, it would have been more fuel to the bullish fire.  By delaying to now, their shipment window goes well into summer months and removes a lot of bullish potential.  If other global buyers mostly stay away/quiet, it is likely this tender will not push prices higher.  However, if buyers come from the woodwork, different story.  That is one of the bigger things we are watching.  Who follows India, if anyone.
  • N.A. markets struggle with NH3 application/UAN supplies - there is a lot of nitrogen demand for the spring 2025 N.A. season.  This is especially seen with U.S. corn acres continuing to rise.  Now, if all 3 nitrogen products are decently supplied, then the boost to nitrogen demand for each isn't massive.  However, if a larger area struggles with spring NH3 application, that can push a massive amount of nitrogen demand to urea.  We are also watching/worried about UAN supplies with more production issues.  This can also shove a lot of new nitrogen demand to urea which it wasn't expecting.  Either of those happen, do not be surprised to see inventories tight and prices higher.
  • Any further unexpected production outages - the world just got done withstanding almost 2 months of Iranian nitrogen production being offline.  This, in combination with a lack of Chinese exports and continued European production issues, made an already tight global urea S&D that much tighter.  Hopefully, Iran will be the last surprise...but there are no guarantees.  The global S&D is racing on the edge of a razor.  Any little push to further reduce supplies will have an impact.
Bearish Factors
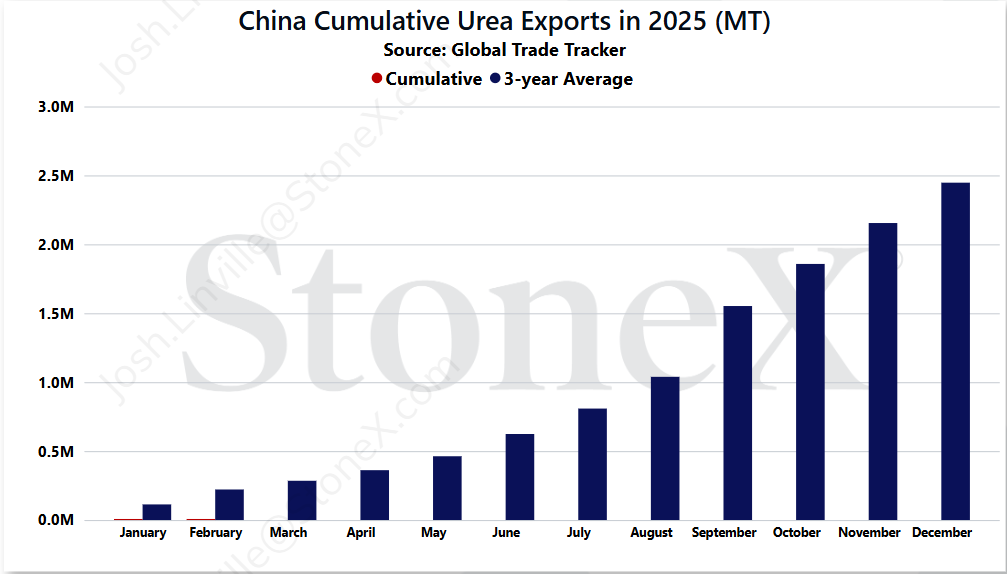
  • Chinese exports return/rumor to return - China continues to be a huge reason why global urea values are as high as they are.  They historically represent 10% of the global export market at 5 to 5.5M tons per year.  In 2024, they only exported 266K tons and 2025 has started WELL below that pace.  However, you can never count China out.  There have been rumors that the government will revisit export programs.  This may be a full return with free market fundamentals driving it (not likely).  This might be a quantity ceiling.  This might be a short timeframe.  Each scenario would play out differently but each would likely cause values to dip on their return...if it happens.
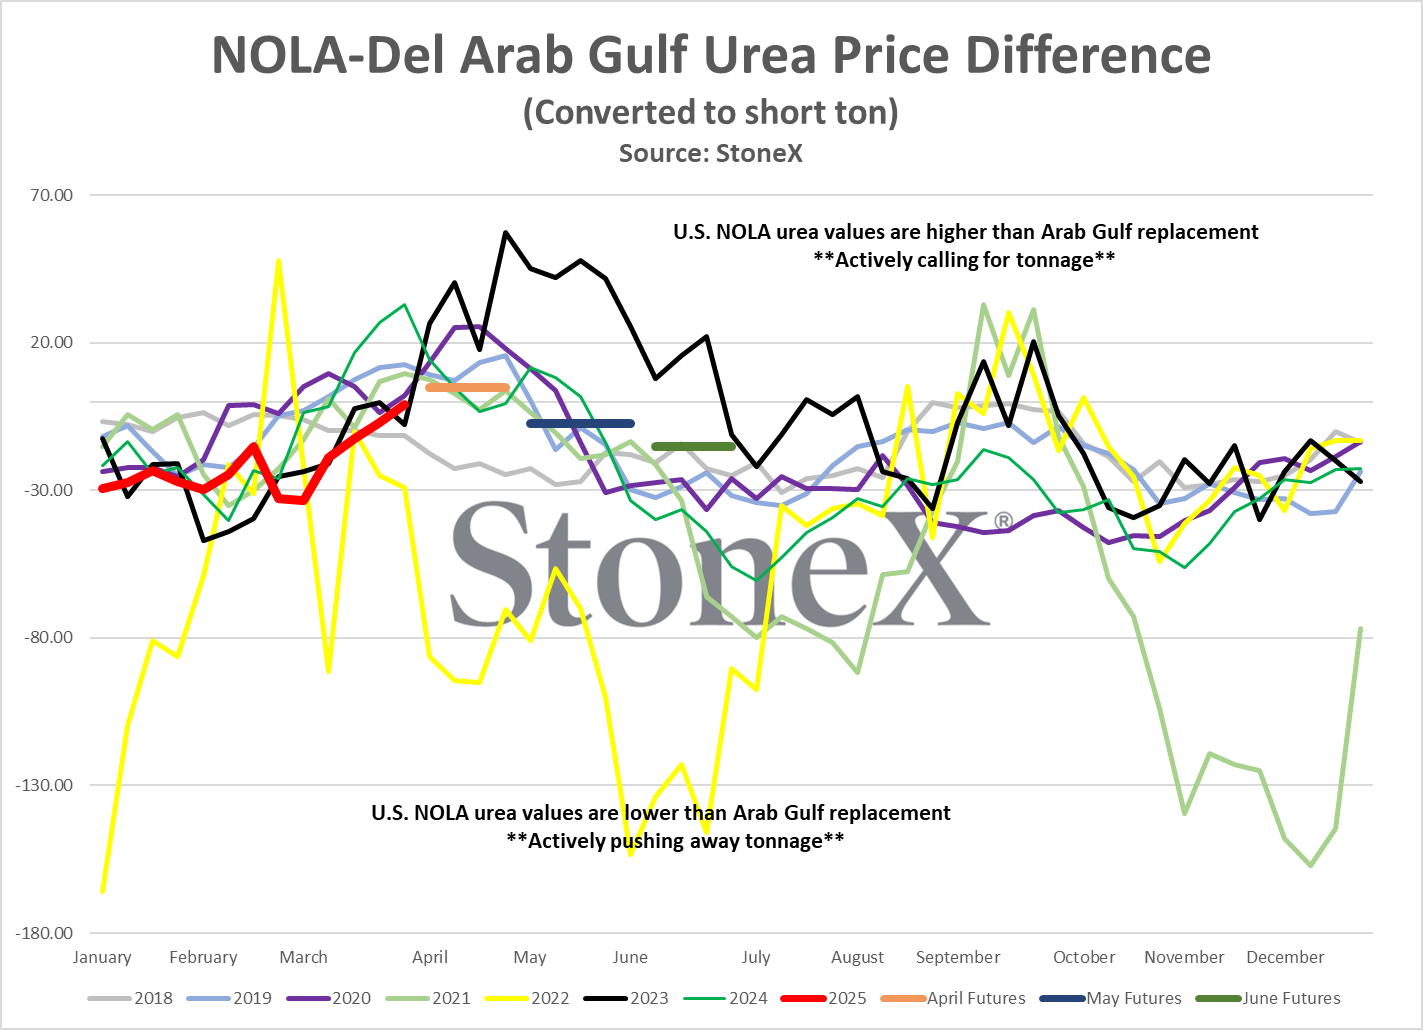
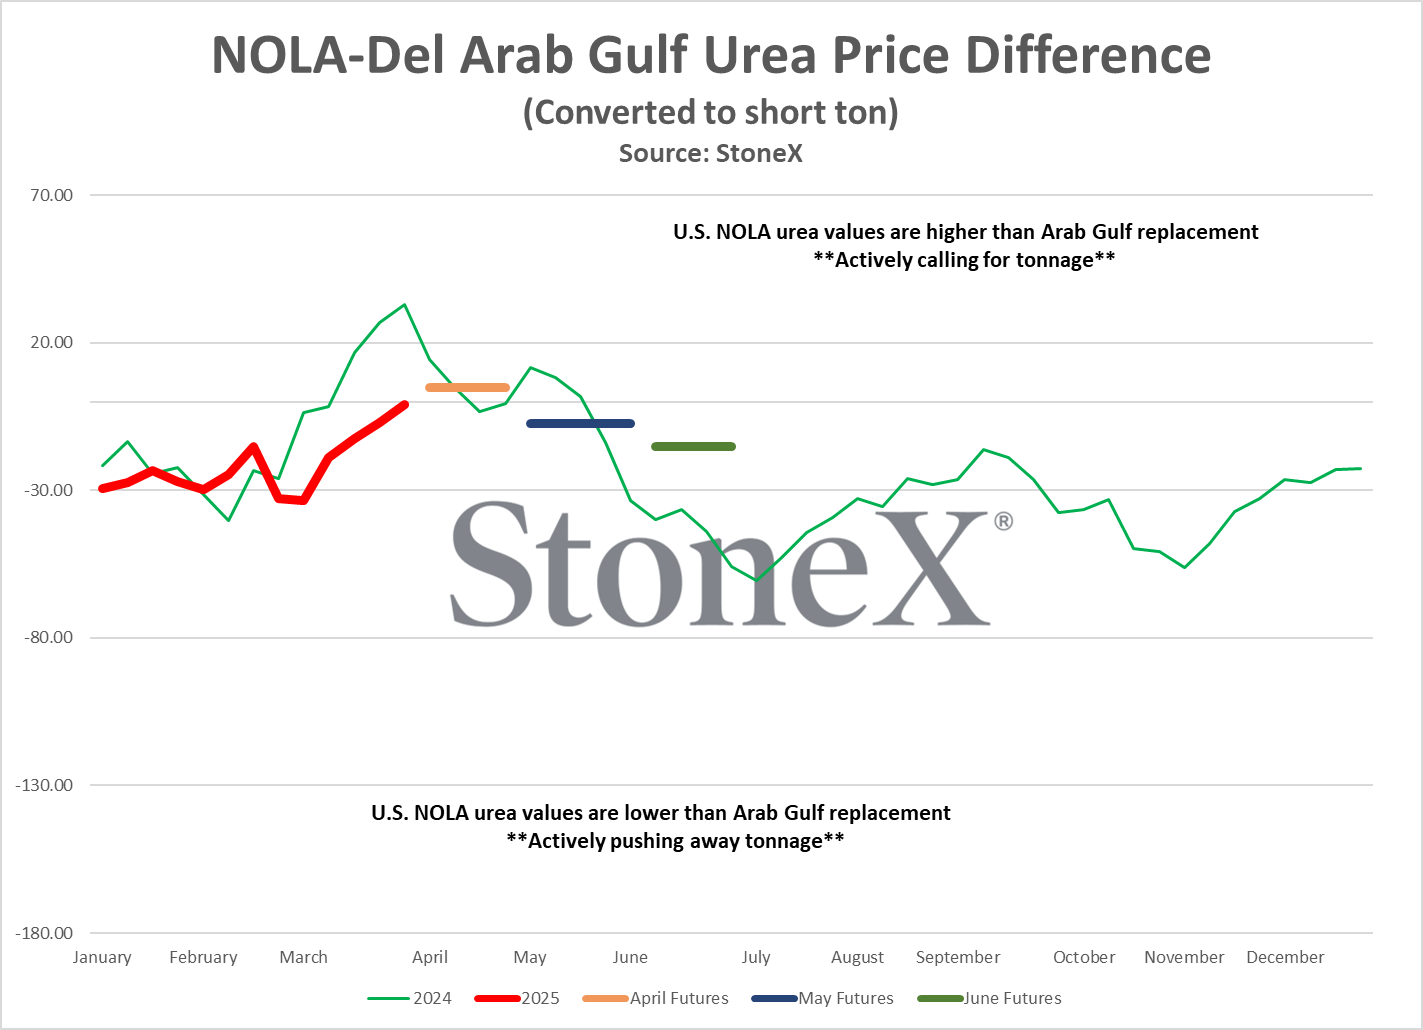
  • N.A. imports continue at a heavy pace - imports of urea to N.A. have been surprisingly high.  NOLA values have been well below global comparisons meaning international producers have been willing to take discounts to send product here.  This is certainly not something we saw coming.  If the import pace continues well above expectations, that keeps a lid on price ideas.  If imports pick up the pace, it could shove price ideas lower.
  • India shocks the world and delays this tender - with the way India delayed their tender and the fact that their next application season is coming quickly, this is not a very high expectation...but we have been surprised before.  IPL, India's importing agency for this tender, announced their desire to secure 1.5M tons.  We could see them get upset with high offers and decide to scale back the number of tons they secure.  We could see them decide to try the tender again.  Any form of this would likely gut the global urea market and send prices lower.
Where are the current urea/grain ratio values today

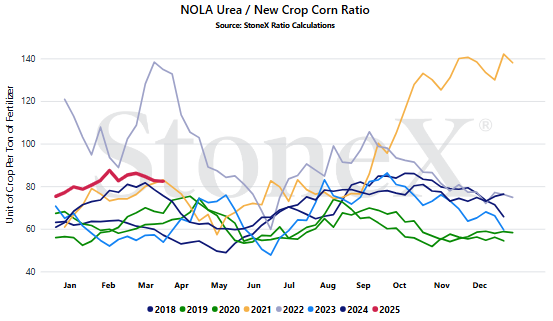
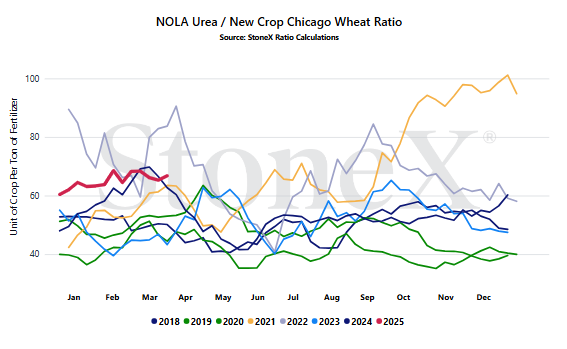
We believe that only looking at the flat price of either grains or fertilizer can be misleading:

  • Only selling grain can hurt you if fertilizer prices rise substantially
  • Only buying fertilizer can hurt you if grain prices fall

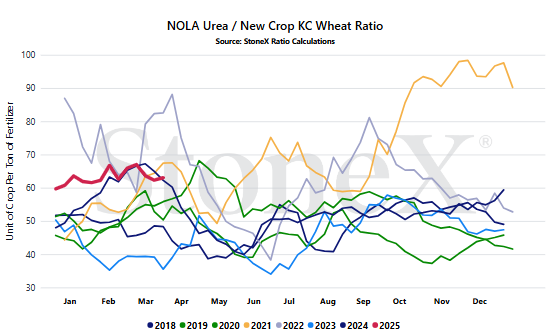
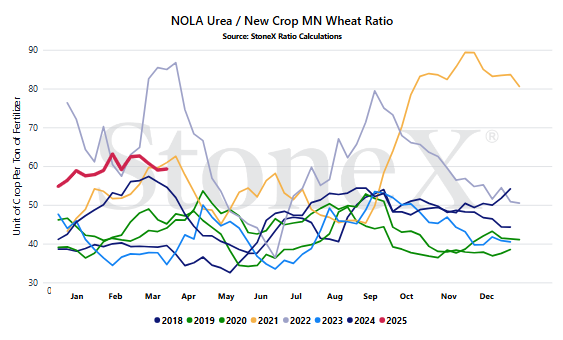
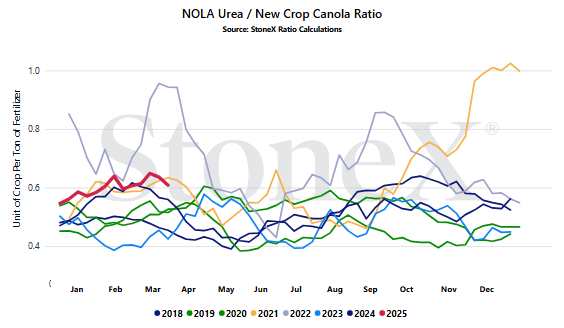
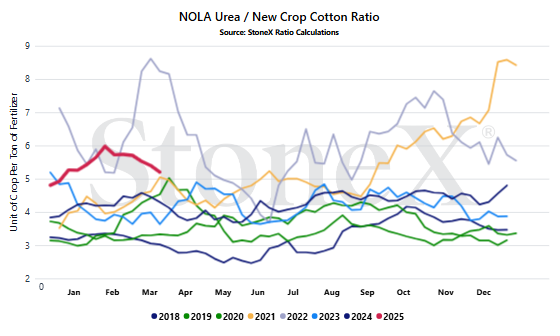
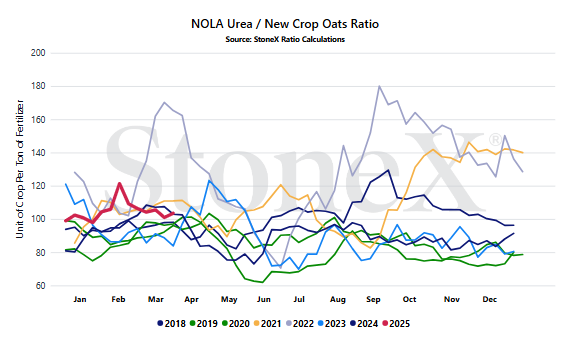
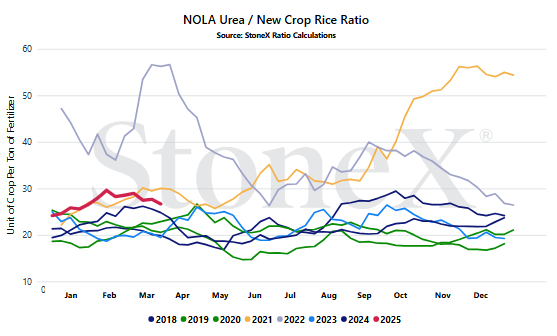
We look at the ratio "value" to get a better indication of where we are or how many bushels of X does it take to pay for 1 ton of fertilizer.

Would you rather:

  • Spend 135 bushels to pay for 1 ton of urea
  • Spend 55 bushels to pay for 1 ton of urea

When we compare the current ratio value against recent years, we start to see if we are high or low.

YOUR VALUES WILL LOOK DIFFERENT

This graph looks at the NOLA urea price vs the flat grain price. There are no logistics on either product. Your location will look different due to fertilizer logistical costs, grain basis, etc.


image-20250331115814-8image-20250331115828-9image-20250331115855-10image-20250331115904-11image-20250331115915-12image-20250331115926-13image-20250331115936-14image-20250331115945-15


Josh Linville’s Focal Points
  • Chinese governments export policies - a large reason why global and domestic prices are as high as they is due to Chinese urea export restrictions.  China typically represents around 10% of the global export marketplace and 2024 saw them reduced to just over 260K tons.  January/February 2025 export data pace makes 2024 look huge in comparison.  More worrisome is that there continues to be rumors that this will become a more permanent strategy where tons, if exported, are done on a defined quantity and a defined period.  As long as China isolates itself, global farmers will pay a higher price.
  • Whether Russia/Ukraine peace leads to lower European gas values - the new U.S. administration continues to push hard for peace between Russia and Ukraine.  There is a lot of hope that if this is successful, it will mean a return to "normal" relations between Europe and Russia.  Now, whether it will or will not remains to be seen but peace certainly wouldn't hurt.  In the best case scenario, peace is found, relations between Europe and Russia return, work starts to repair the Nordstream pipeline which was attacked during the early days, and eventually cheap Russian gas returns to Europe which will allow European based nitrogen production to return to near normal levels.  That sentence was 3+ lines long which should give you an idea of how long this would take to play out.  It is not a short term event, rather a longer term hope.  If European production can return, global prices can mellow out even further.
  • How long can buyers stay out, will it be a windfall when they return - the biggest surprise of 2025 has been how well global buyers have been able to stay out.  This story has really been focused on India who was WIDELY expected to announce a purchase tender in mid-February.  Since then, global buyers have taken India's approach and drug their feet as well...but for how long?  If India steps in, will others take that as a sign of a near term price floor and purchase as well?  Can there be enough demand at this point in the calendar to support values?  I'm losing faith by the day.  I think we are simply too close to summer, but we will see.
  • Weaker global markets vs rising domestic demand - this will be a frustration for many.  Global values and even some along the coastlines have been falling...yet inland prices have been stagnant.  It takes time for those cheaper tons to arrive, but it does paint a more promising picture for sidedress periods.  This is not something I would have expected to see as a possibility a month or two earlier.

StoneX Ratio Calculation

The ratio calculation is derived from Bloomberg historical grains values as well as fertilizer values from StoneX, NPKFAS, and Argus.

The calculation is simply dividing the fertilizer price by each grain price.

All data was sourced from StoneX unless otherwise noted.


  • Fertilizers

This material should be construed as the solicitation of an account, order, and/or services and represents the opinions and viewpoints of the individual authors or presenters. It does not constitute an individualized recommendation or take into account the particular trading objectives, financial situations, or needs of individual customers.


The views are current only through the date stated and are subject to change at any time based upon market or other conditions, and StoneX Group Inc. (“SGI”) disclaims any responsibility to update such views. Actual results, performance, or achievements may differ materially from those expressed or implied. Information is based on data gathered from what we believe are reliable sources. Past performance does not guarantee future results.


The StoneX Group Inc. group of companies provides financial services worldwide through its subsidiaries, including physical commodities, securities, exchange-traded and over-the-counter derivatives, risk management, global payments and foreign exchange products in accordance with applicable law in the jurisdictions where services are provided.


References to certain OTC products or swaps are made on behalf of StoneX Markets, LLC (SXM), a member of the National Futures Association (NFA) and provisionally registered with the U.S. Commodity Futures Trading Commission (CFTC) as a swap dealer. SXM’s products are designed only for individuals or firms who qualify under CFTC rules as an ‘Eligible Contract Participant’ and who have been accepted as customers of SXM.


StoneX Financial Inc. (SFI) is a member of FINRA/NFA/SIPC and registered with the MSRB. SFI is registered with the U.S. Securities and Exchange Commission (SEC) as a Broker-Dealer and with the CFTC as a Futures Commission Merchant and Commodity Trading Advisor. StoneX Financial (Canada) Inc. (SFCI) is registered in Canada and is a member of CIRO and CIPF. References to certain securities trading are made on behalf of the BD Division of SFI and are intended only for an audience of institutional clients as defined by FINRA Rule 4512(c). References to certain exchange-traded futures and options are made on behalf of the FCM Division of SFI. Wealth Management is offered through SA Stone Wealth Management Inc., member FINRA/SIPC, and SA Stone Investment Advisors Inc., an SEC-registered investment advisor, both wholly owned subsidiaries of SGI.

R.J. O’Brien & Associates, LLC (RJO) is registered with the CFTC as a Futures Commission Merchant and is a member of NFA.


StoneX Financial Ltd (SFL) is registered in England and Wales, company no. 5616586. SFL is authorized and regulated by the Financial Conduct Authority (FCA) (registration number FRN:446717) to provide services to professional and eligible customers including: arrangement, execution and, where required, clearing derivative transactions in exchange traded futures and options. SFL is also authorized to engage in the arrangement and execution of transactions in certain OTC products, certain securities trading, precious metals trading and payment services to eligible customers. SFL is authorized and regulated by the FCA under the Payment Services Regulations 2017 for the provision of payment services. SFL is a category 1 ring-dealing member of the London Metal Exchange. In addition SFL also engages in other physically delivered commodities business and other general business activities which are unregulated and not required to be authorized by the FCA.


This communication is issued in the European Economic Area by StoneX Financial Europe GmbH (SFEG). StoneX is the trade name used by STONEX GROUP INC. and all its associated entities and subsidiaries. StoneX Financial Europe GmbH (“SFEG”) is a securities trading firm registered in Germany under Company No. HRB 80844.


StoneX Financial Pte Ltd (Co. Reg. No 201130598R) (“SFP”) is regulated by the Monetary Authority of Singapore and is a Capital Markets Service Licence holder (for dealing in capital market products), an Exempt Financial Adviser (for advising on investment products and issuing or promulgating analyses/ reports on investment products) and a Major Payment Institution (for domestic and cross-border money transfer services).


SFP may distribute analysis/report produced by its respective foreign affiliates within the StoneX Group of companies pursuant to an arrangement under Regulation 32C of the Financial Advisers Regulations Recipients should contact SFP at (65) 6309 1000 for any matters arising from, or in connection with, this webinar.


StoneX APAC Pte. Ltd. (“SAP”) (Co. Reg. No 200616676W) is regulated as a Dealer (PS20190001002) under the Precious Stones and Precious Metals (Prevention of Money Laundering and Terrorism Financing) Act 2019 for purposes of anti-money laundering and countering the financing of terrorism.


StoneX Financial (HK) Limited (CE No.: BCQ152) (“SHK”) is regulated by the Hong Kong Securities and Futures Commission for Dealing in Securities and Dealing in Futures Contracts.


StoneX Financial Pty Ltd (ACN 141 774 727) holds an Australian Financial Service License (AFSL: 345646) for Dealing in Securities, Exchange-Traded Derivatives Contracts, OTC Derivatives Contracts and Foreign Exchange Contracts, and is regulated by the Australian Securities and Investments Commission.


StoneX Securities Co., Ltd. (“SSJ”) (Co. Reg. No 010401047199) is regulated by the Japanese Financial Services Agency as a Type-I Financial Instruments Business Operator (Kanto Local Finance Bureau (FIBO)No.291’), is a member of the Financial Futures Association of Japan for dealing and broking FX and FX Option transactions, and is a member of the Japan Securities Dealers Association for dealing and broking stock indices and option transactions.


Trading swaps and over-the-counter derivatives, exchange-traded derivatives and options and securities involves substantial risk and is not suitable for all investors. Past performance of any futures or option is not indicative of future success. Indicators are not a trading system and are not published as a specific trade recommendation. The information herein is not a recommendation to trade nor investment research or an offer to buy or sell any derivative or security. It does not take into account your particular investment objectives, financial situation or needs and does not create a binding obligation on any of the StoneX group of companies to enter into any transaction with you. You are advised to perform an independent investigation of any transaction to determine whether any transaction is suitable for you. No part of this material may be copied, photocopied or duplicated in any form by any means or redistributed without the prior written consent of StoneX Group Inc.


The report/analysis herein is not directed to, or intended for distribution to or use by, any person or entity who is a citizen or resident of or located in any locality, state, country or other jurisdiction where such distribution, publication, availability or use would be contrary to law or regulation.


© 2026 StoneX Group Inc. All Rights Reserved.

Satellite view of Earth at night showing illuminated cities across Asia and the Middle East

Discover more insights

Our subscribers have access to comprehensive market analysis from StoneX spanning commodities, equities, currencies and more.

StoneX: We open markets

Our market expertise, advanced platforms, global reach, culture of full transparency and commitment to our clients’ success all set us apart in the financial marketplace.

Reach

With access to 40+ derivatives exchanges, 180+ foreign exchange markets, nearly every global securities marketplace and numerous bi-lateral liquidity venues, StoneX’s digital network and deep relationships can take clients anywhere they want to go.

Transparency

As a publicly traded company meeting the highest standards of regulatory compliance in the markets we serve; our financials and record of accomplishment are matters of public record. StoneX’s commitment to “doing the right thing over the easy thing” sets us apart in the industry and helps us build respect, client trust and new partnerships.

Expertise

From our proprietary Market Intelligence platform, to “boots on the ground” expertise from award-winning traders and professionals, we connect our clients directly to actionable insights they can use to make more informed decisions and achieve their goals in the global markets.