

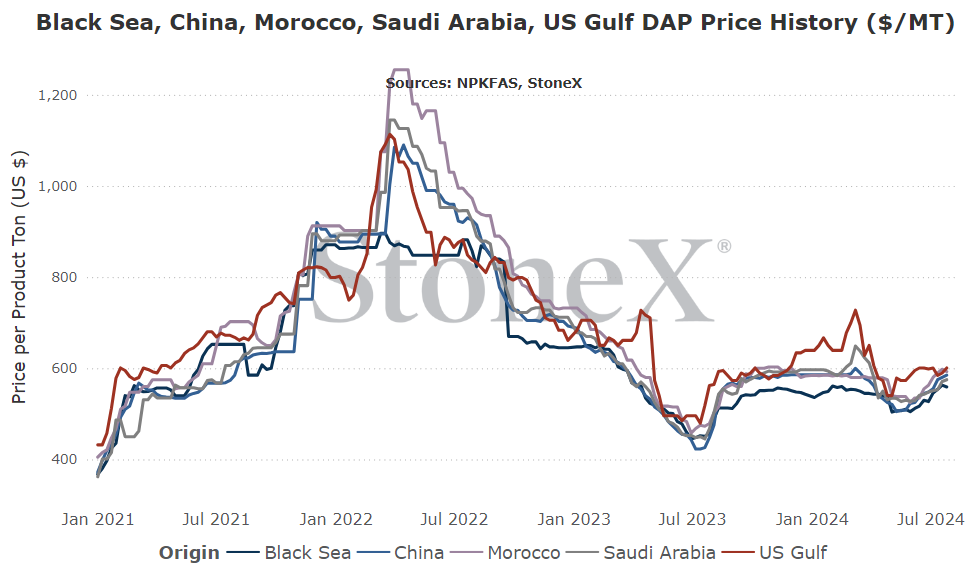
I will say this now and will say it going forward to eternity: these are the flat price graphs for each individual location. Your price where you are is going to be different. There are logistics. There is the cost of storage/interest/insurance/etc. These graphs should not be taken as "it shows the price at $700, why isn't my price $700". These graphs should be used to give an appreciation for price movements.
All values are in metric tons and USD currency.
Global
There are some global phosphate issues, and most of them lie with India.
India is the world's largest buyer of phosphate, and their government subsidy program has not allowed imports to occur as they are needed. As a result, the import pace has slowed and stockpiles are getting very low. The last time they got tight, farmers stood up and took to the streets. No doubt the government will not want this again so "should" change the program which will allow India to play catch up.
Let me say that again, the world's largest buyer will be in "catch up mode". With only 5 major exporters around the world, they will see this and likely take advantage.
From our perspective, once India fixes the subsidy program for phosphate, they will likely go on a buying binge of sorts to catch up stockpiles. The influx of demand should be met with eager manufacturers who should take advantage by stair stepping prices higher.
Hopefully we will not see the Chinese government restrict exports again as that would only make a bad situation worse.
North America
Farmer economics across North America...well, they suck for 2024. They are not much better for 2025.
Current phosphate/grain ratios...well, they suck as well.
Fall applicators will likely consider delaying until spring (which would bring its own logistical issues). Some will consider cutting application rates...or cutting application all-together.
So if we see all this demand destruction coming, we should be bearish on values right? I wish...
Unfortunately, I am afraid that the global price situation will outweigh the domestic situation and drag values higher. A poor fall will be good in that domestic supplies can catch up. Unfortunately, if global values start going higher and N.A. values remain stagnant, we then run the risk of exports picking up once again.
Now, next spring is a long way away. We could certainly see a lot of things change in the 7 months before March gets here. Just keep in mind that if you are typically a fall applier and you suddenly decide to wait for spring in hopes of better days, have that conversation with your retailer/supplier. If enough of the market does that, we will have logistical issues. The market is not set up for it.
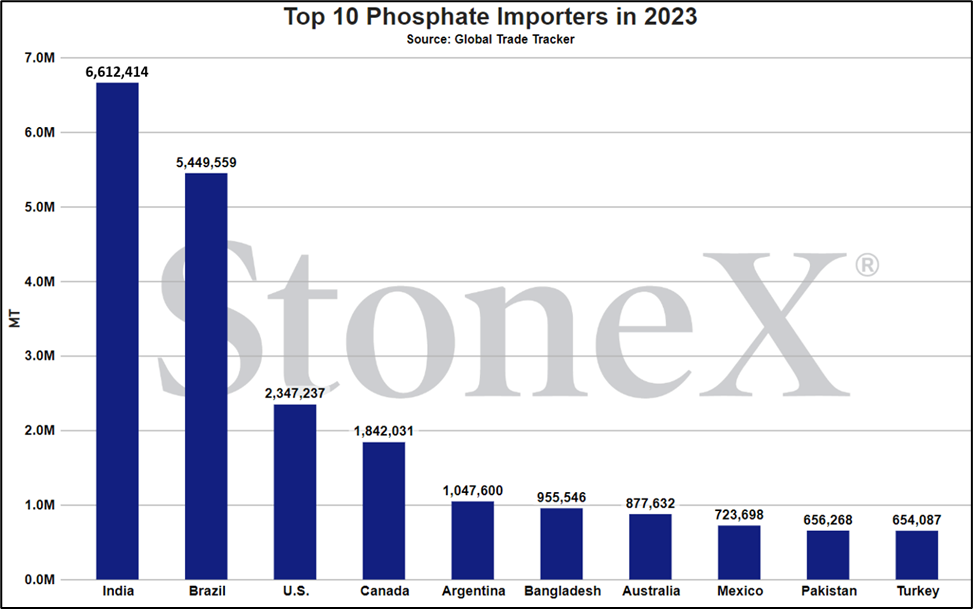
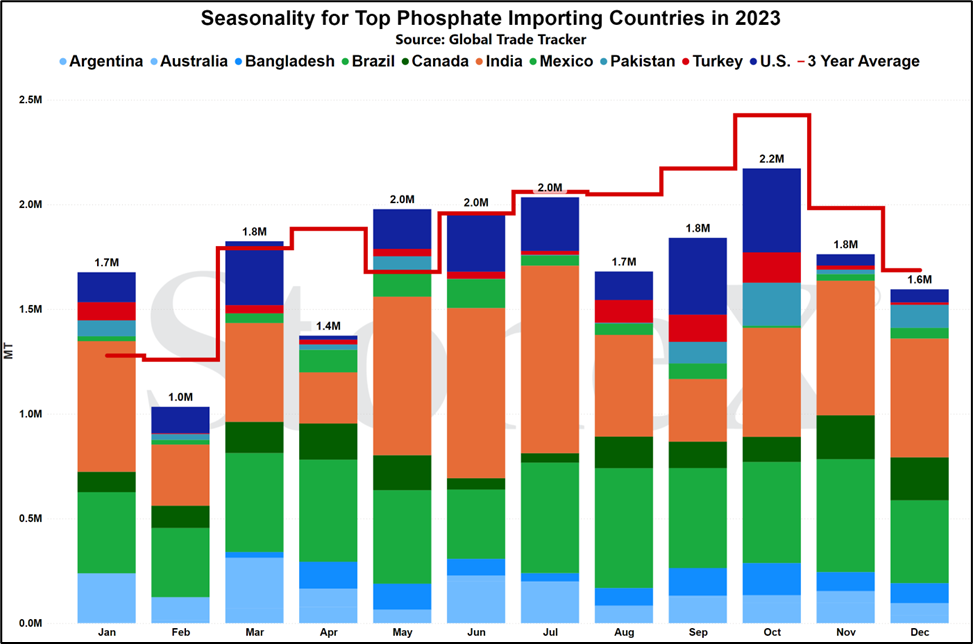
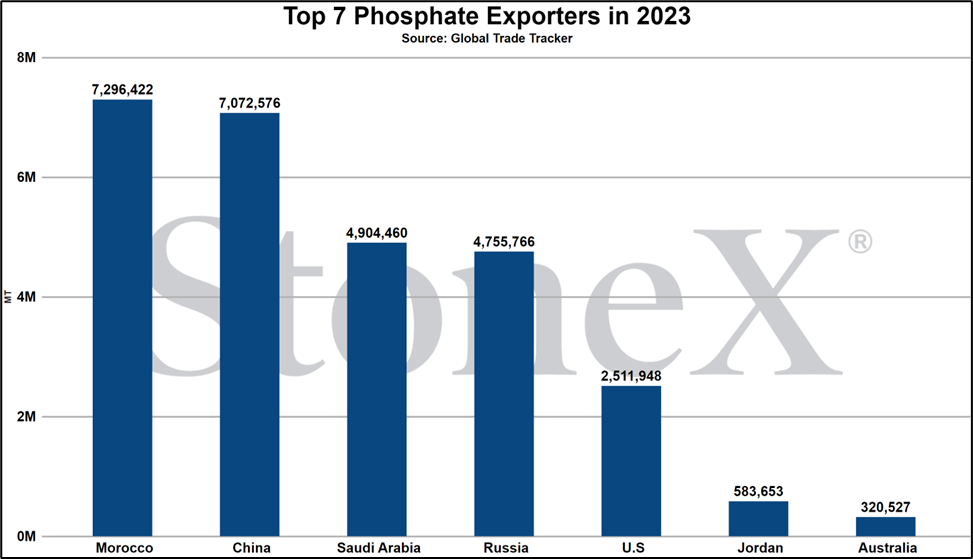
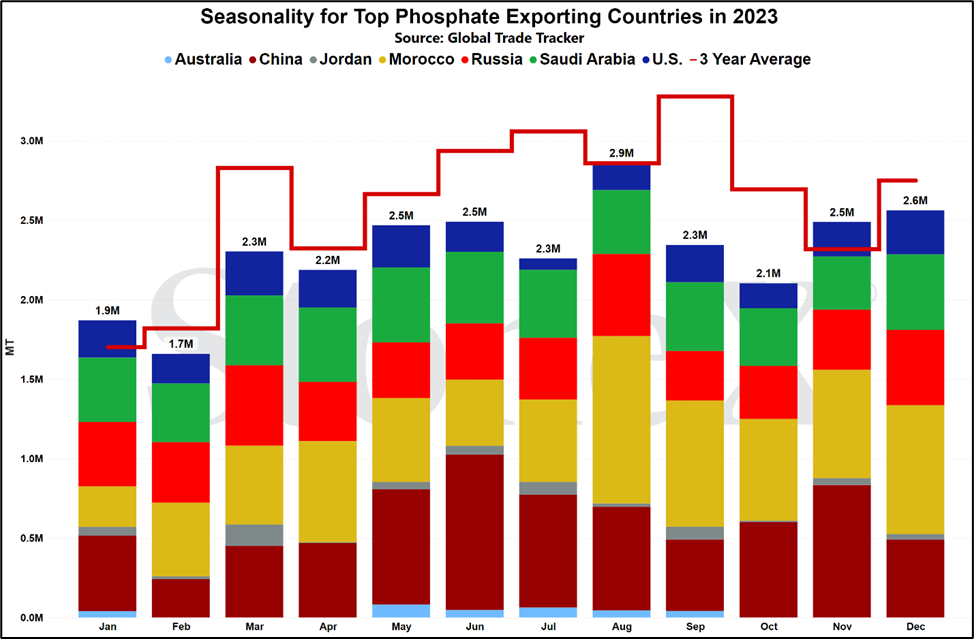
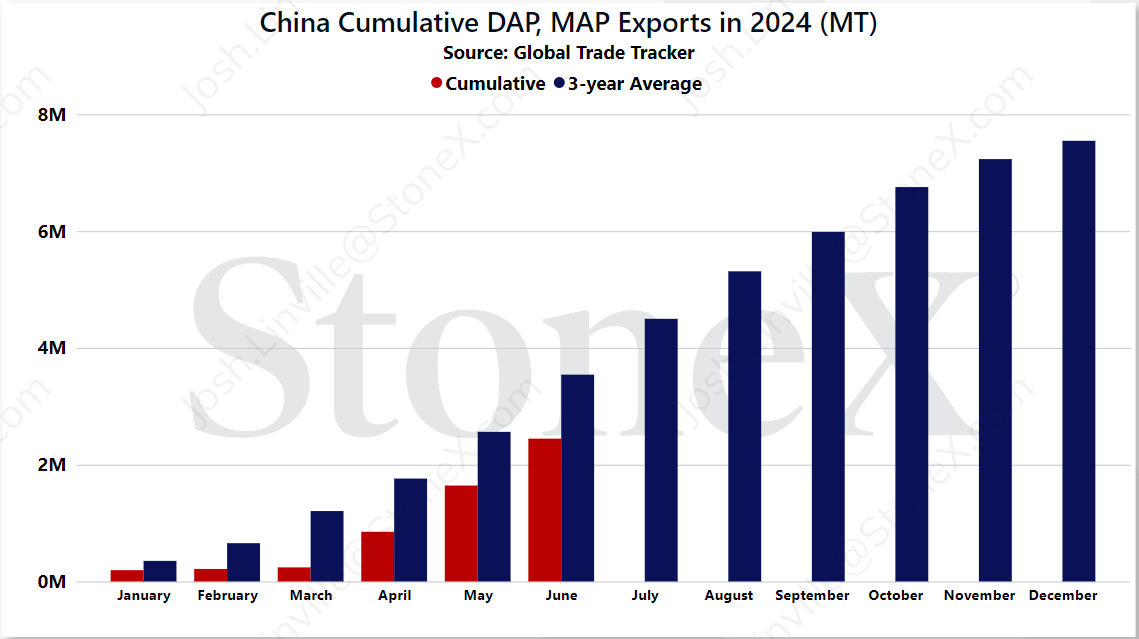
Chinese exports continue slow June/July, further tightening global S&D
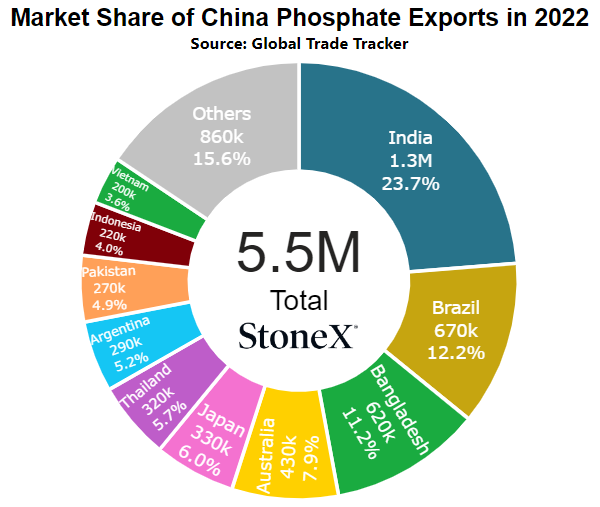
With only 5 major phosphate exporting countries in the world, when one slows down, it impacts the world market. When it is China, who has historically been the largest of the 5, its impact is that much bigger.
One of the bigger 2024 phosphate storylines has continued to be Chinese exports being slow vs their 3-year average which is ALREADY lower than normal due to recent year restrictions. We had hoped that 2024 would be a return to normal for them. Global values, which are still high, have come off tremendously from their early 2022 high's. Global supplies have vastly improved from the same period outlook. Essentially, all the pieces had fallen into place for the Chinese government to no longer play a role in export programs.
Unfortunately, that does not seem to be the case.
The government has seen where restricting exports of things like fertilizer helps to reduce the domestic price to their farmers. Even when every single fundamental is saying export, from their perspective, it is better to keep restrictions in place. Doing so keeps their domestic pricing lower than the rest of the world and helps put their farmers on more firm footing than the global competition.
We always have to remember that China can turn on a dime. Today, we are discussing how far behind their exports are and how the remaining 2024 outlook does not look great...but by September we could be discussing how China is flooding the world market with product and frankly I wouldn't be surprised in the slightest.
So the world phosphate market continues to churn along as one of its biggest suppliers continues to remain an enigma.
India, world's largest buyer, needs to catch up in a big way
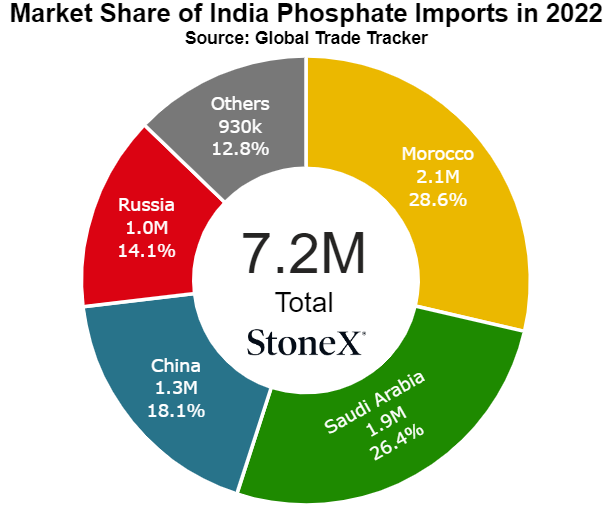
If China is the biggest story on the supply side of the global phosphate market, India is currently the biggest story from the demand side.
India is the world's largest buyer (not consumer, but buyer) of DAP/MAP in the world...and they are getting low on stockpiles due to a government subsidy program that is not allowing importers to purchase product.
A bit of insight on how India works.
Indian farmers do not operate with global fertilizer pricing. The government subsidizes their fertilizer to keep their value steady. That subsidy goes to importers who have to purchase high priced global values and then sell at a government mandated farmer value. The subsidy fill in the gap and allows them to proceed with imports without taking a huge loss.
The issue in recent months has been that the government subsidy has not been large enough to cover that gap. Importers will lose money with each vessel that they purchase. That is not a very good strategy if you want to stay in business. The government dropped the subsidy rate as they saw global values declining and had hoped that lowering the rate would cause global prices to fall which would save them money.
Then China started to restrict exports even further and the tide changed. Rather than forcing values lower, prices started to rise and India was left in the cold.
During this same time, domestic Indian production levels have fallen unexpectedly.
The result is that Indian DAP stockpiles have fallen to 2M tons in June. That is certainly a lot of tons but in comparison, June 2023 levels were 4 million and the 5-year average sits at 4 million. To make matters worse, most believe that July and August imports will be poor (again, due to a subsidy program that does not work) and could see stockpiles falling into the mid 1 million ton range.
So what does this mean for the world?
This means that the largest phosphate buyer in the world needs to play catch up. Rumors/reports are that the government are working to change the phosphate subsidy to allow imports to resume. When that happens, they will need literally millions of tons to catch back up to "normal" stockpile levels. At the same time, we are still operating in a market that has Chinese export levels lower.
So one of the largest exporters in the world is slowing flows while the largest buyer in the world appears to just be starting a game of catch up...dangerous equation.
I doubt that we will see markets pushing back to the high's seen in early 2022, but it certainly would certainly provide a lot of price support to long positions/manufacturers...

Grain/phosphate ratios horrible: can they get worse/what opportunity was missed?
Current phosphate values would not be so bad if grain values had not been tanking recently.
...I know that is an incredibly stupid sentence to start this section, but press on. I promise there is a reason for it.
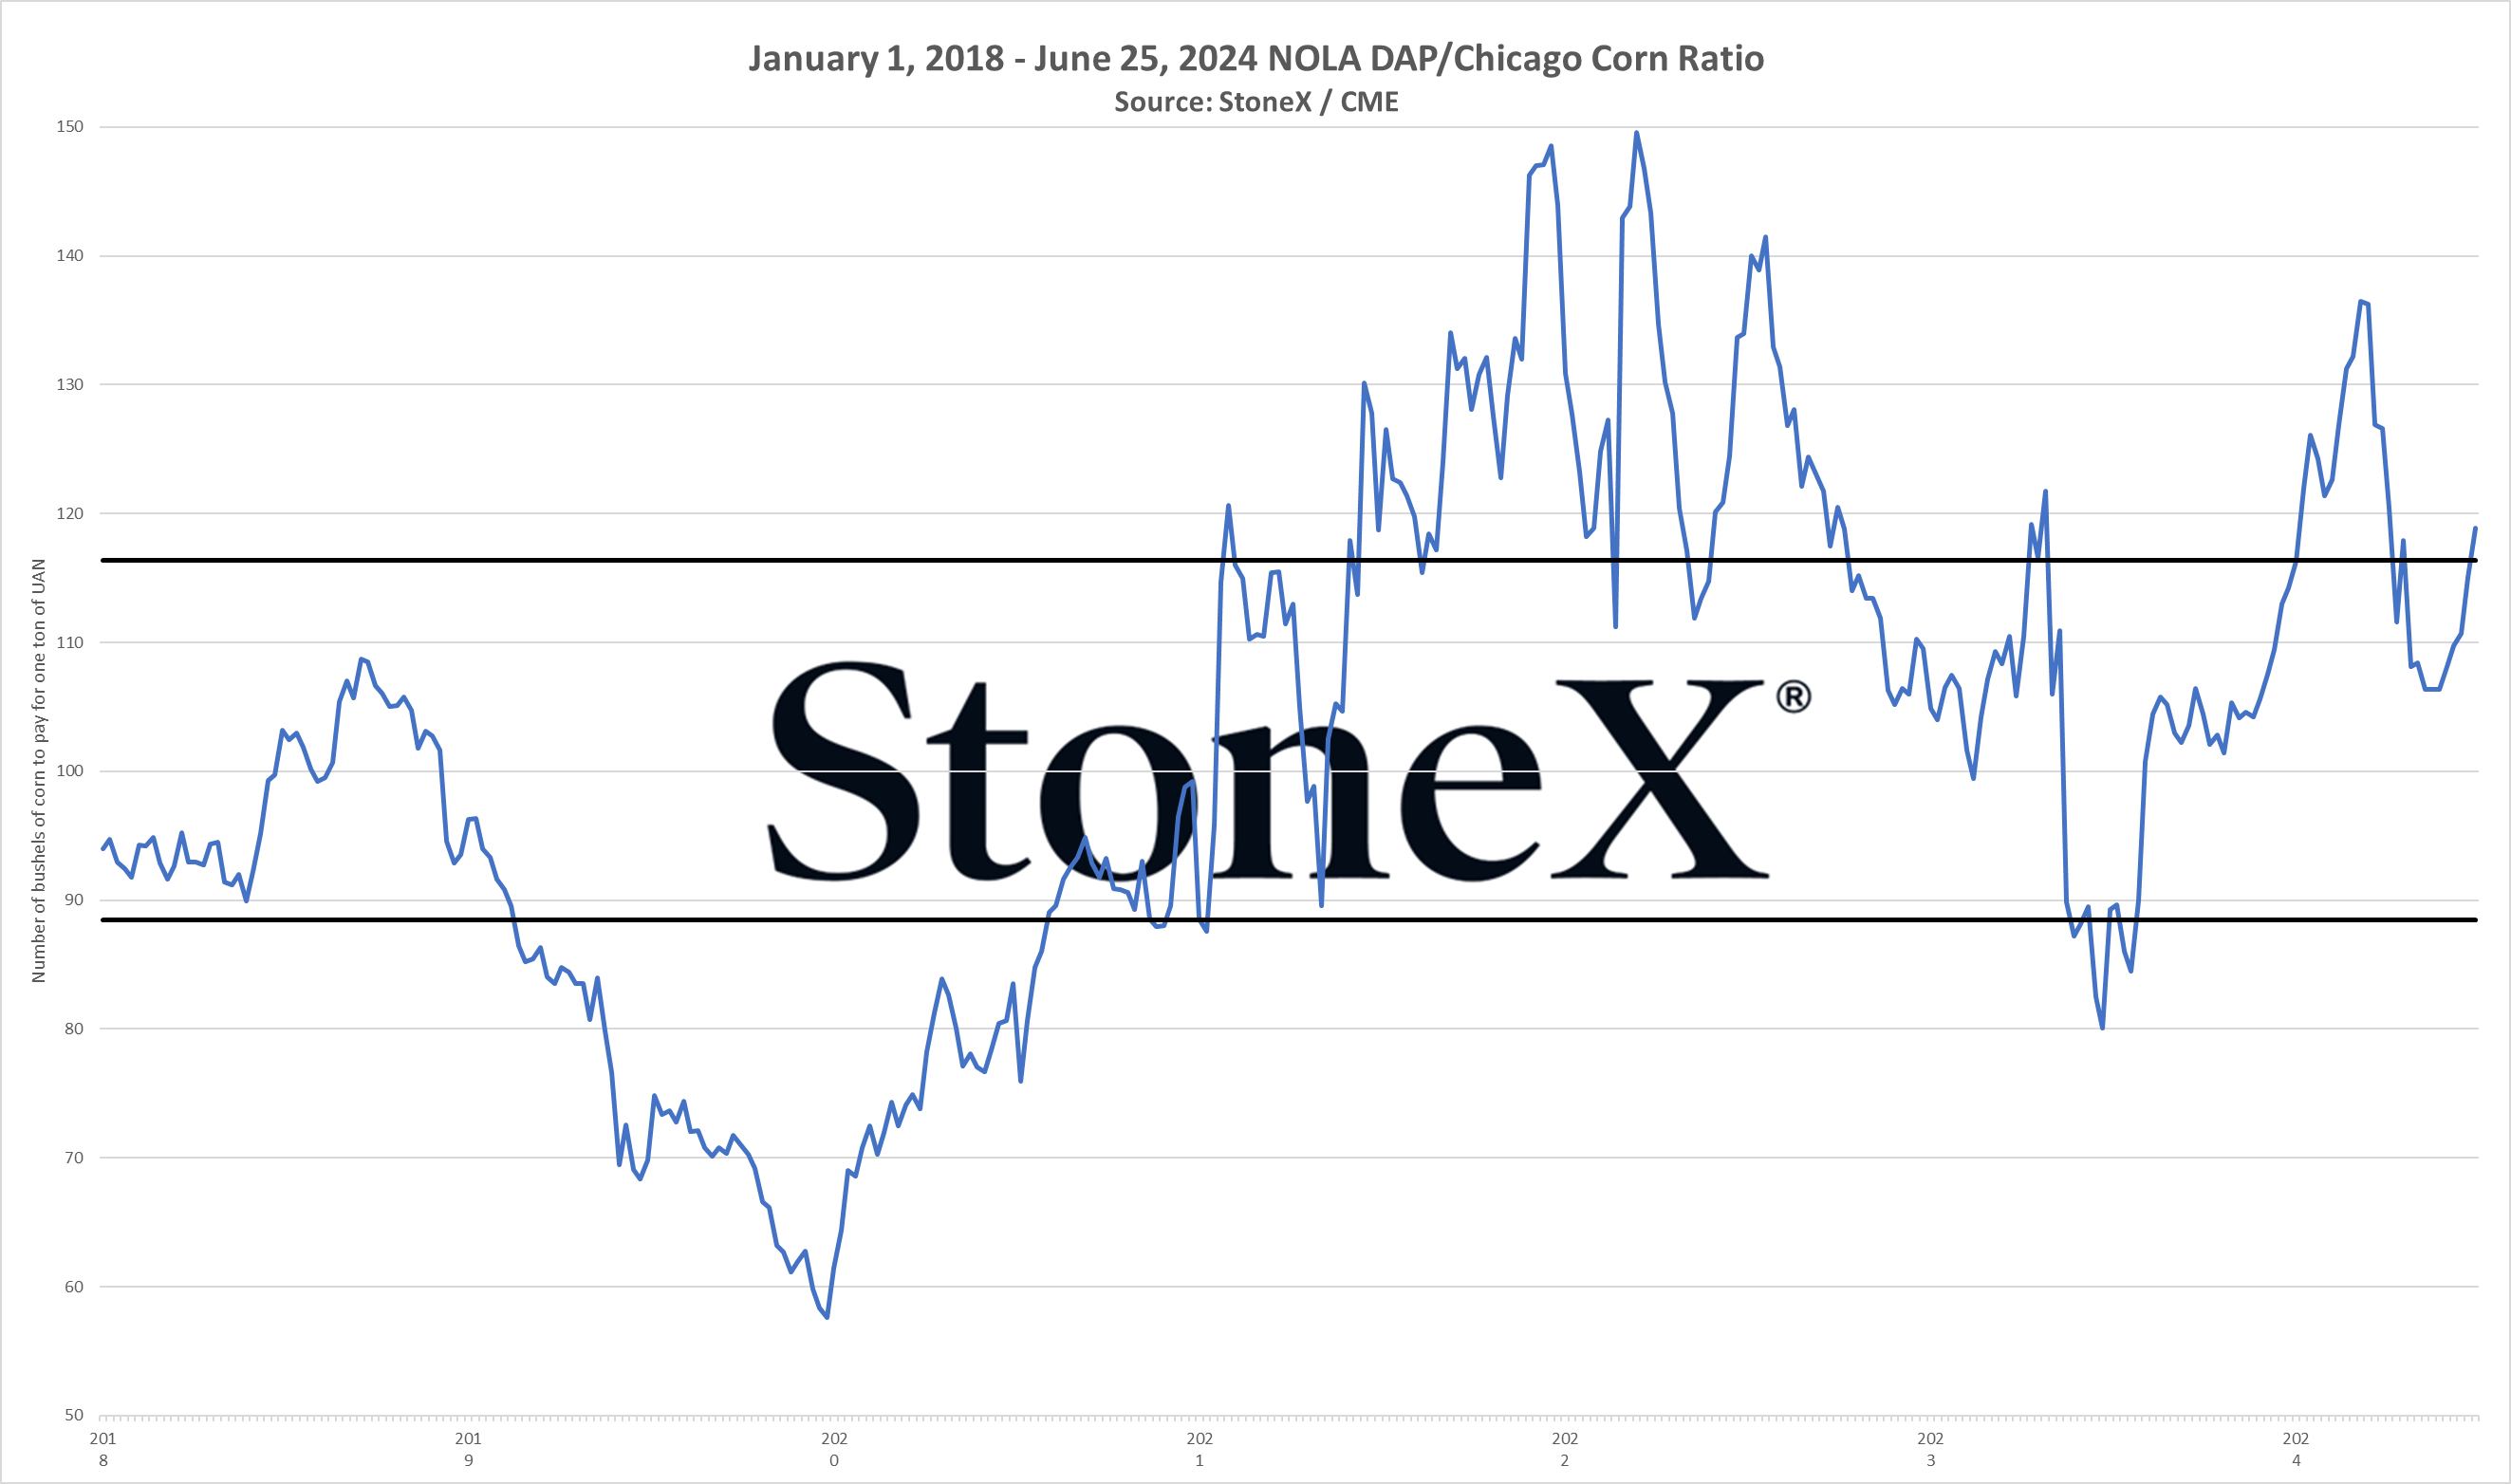
Phosphate values are not significantly higher than where they were a year ago. Most of the issue that we are dealing with today is the fact that grain values continue to bleed and it is making everything look significantly better. This is EXACTLY why I spend so much time talking about fertilizers and grains together rather than separate decisions/markets/etc.
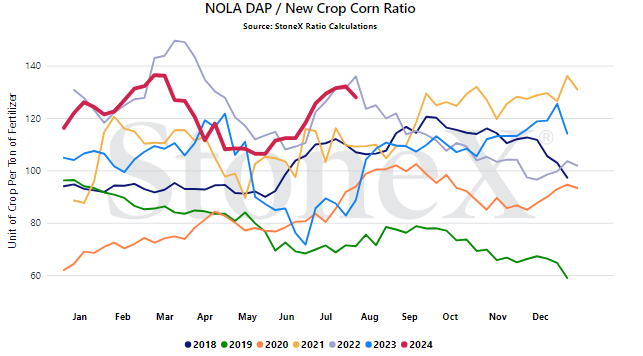
When looking at corn, the lowest ratio last year was:
- NOLA DAP @ $445
- December corn @ $5.56 (looking at Dec '24)
- Ratio sat around 80
Today
- NOLA DAP @ $540
- December 2025 corn @ $4.46
- Ratio sits at 121
So DAP is around $100 higher than the best seen last year, but the thing that hurts is that corn has fallen over a dollar.
Question 1 - can it get worse?
Long answer short - absolutely.
I've seen a lot of folks make a strong case that corn values are not done falling. I also see a couple big reasons (China and India) why phosphates could hold or even push higher. We have seen worse situations and we could get there before it gets better.
Question 2 - do we just reduce/skip phosphate this year?
Long answer short - it depends.
Yeah, I know. Way to really stick my neck out there!!
It does depend. How are phosphate levels in your soil? Is there enough there that you can reduce or skip your phosphate application without impacting 2025 yield potential? Do you have soil that doesn't hold anything so you have to apply? I wish there was an easy answer that covered everyone but I think this is a farmer by farmer and field by field decision. Wouldn't hurt to have a chat with your agronomist.
Question 3 - what does a $100 phosphate move mean on a per acre basis?
Let's do some math. I'll assume we are applying 150lbs/acre.
$700/ton DAP @ 150lbs/acre = $52.50/acre cost
$600/ton DAP @ 150lbs/acre = $45/acre cost
That is a big price difference...but at what risk? $7.50/acre equates to roughly 2 bushels of corn today.
If you reduce your application rate and hurt your yield potential by 5 bushels, that leaves 3 bushels of corn on the table. If you wait until spring and wet weather, tough logistics, or tight inventories causes you to delay planting and it hurts yield potential, have you gained?
Question 4 - can I wait it out and see if spring improves?
Long answer short - maybe, but better chat with your supplier/retailer.
The system is designed for a normal fall/spring application demand split. There are only so many barges, railcars, trucks, storage, applicators, etc. to go around. If too much of the system opts to skip fall and wait for spring, we could be right and see values fall. However, if the impact is large enough, logistical costs could skyrocket and you could see your cost rise.
This is going to depend a lot on where you farm and how that area is serviced.
Hence the need for the conversation before making that decision.
Last point - I missed a huge opportunity to push to build soil levels last summer
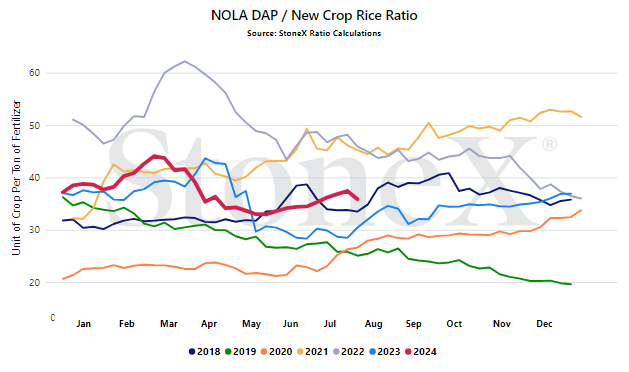
Last summer, phosphate values were falling while grain (corn) values were rising. The ratio dipped down to sub 80 for a very short time. At that point, I thought phosphate could fall a little bit further and I was hoping that corn would continue to rally. However, I KNEW the ratio was solid and I should have pushed hard.
At the end of the day, the ratio was in the best 25% of values going back to 2018. If I ran the below graph further back in history, that value would have still held up as extremely attractive.
This is why we push this program. We didn't know the phosphate direction. We didn't know the grain direction. We knew the value between the two was good. Crystal ball:
- Should have built soil levels (assuming they can) at 80 bushels of corn per ton of DAP
- Could have reduced our need today with the ratio at 120+ bushels of corn per ton of DAP
It is easy to look back and say "should have" but these are the lessons we need to learn so that next time the opportunity pops up, we are ready.
N.A. demand expected to take a hit, but may not matter on world stage
I'm guessing that I do not have to dive too far into the story of how high priced phosphate is vs grain values and what that could mean for demand. In fact, I'm guessing you are reading this and thinking "I'll just cut/remove my phosphate application this year and really show those SOB's"!!
I fully expect to see phosphate demand destruction across North America this fall/spring cycle. Farmer economics are taking too hard a hit with grain prices low and almost all inputs refusing to budge. Makes for a very bad situation that forces the farmer to reconsider their spending habits.
If North America gets thru the fall season, looks back and realizes that demand was decently lower and that carryover inventory is higher than expected, then values should be soft. Supplies higher. Demand lower. I wasn't great in school but I remember that meant prices should fall.
...should...
Unfortunately, this is one of those situations where we have to consider world patterns as well as our own. Just because we have a bad season does not mean prices have to go lower. In fact, and I really hope this doesn't hold true, we could see values higher.
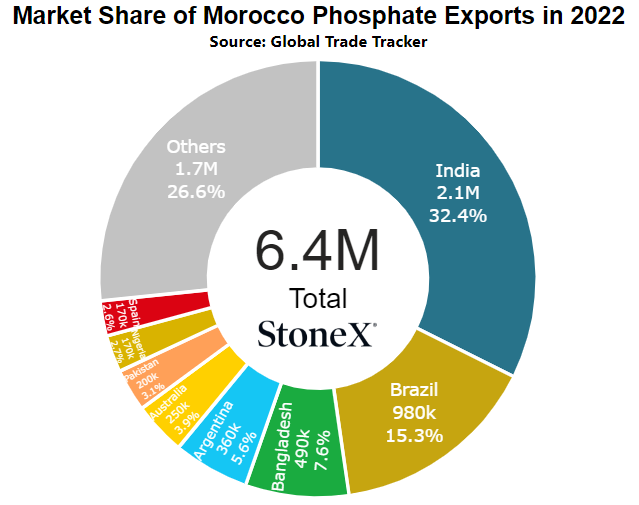
The global outlook is getting more and more supported with Chinese exports being a big question and India, the world's largest buyer, currently in a supply hole that they will have to fight out of. Just before sending these articles out, I heard that India is currently in talks with Morocco to secure 500K tons of DAP to help get resupply efforts started. If they continue on this path and give global exporters a solid enough sales book to get to late Q3/Q4, then the number of reasons for them to drop their price fall drastically.
Basically what I am trying to say is that I fully believe we will have a lackluster fall application demand period but it may not have the effect that we usually think should happen. If the world market decides prices need to be higher, our market should move with it.
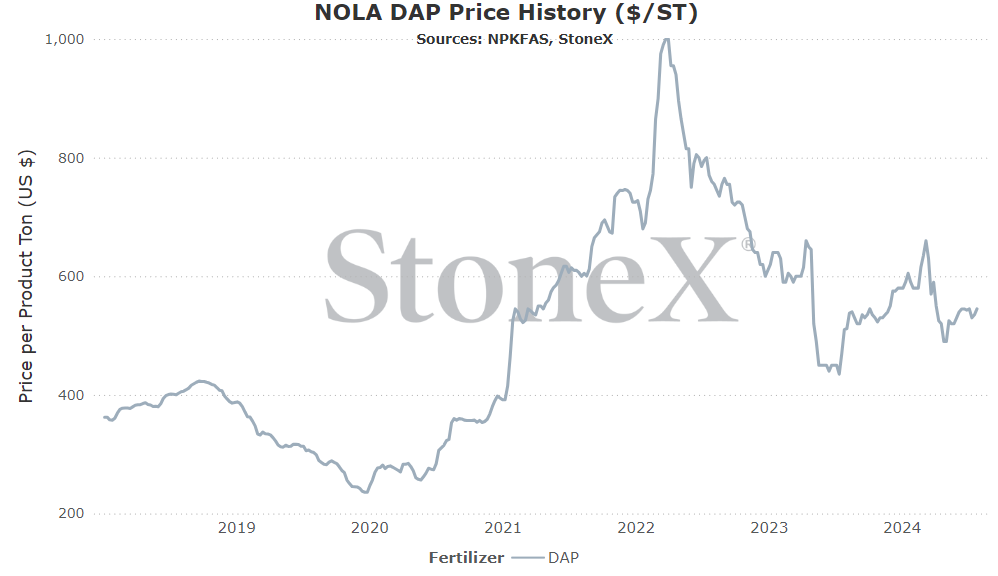
NOLA/New Orleans, Louisiana DAP price comparison
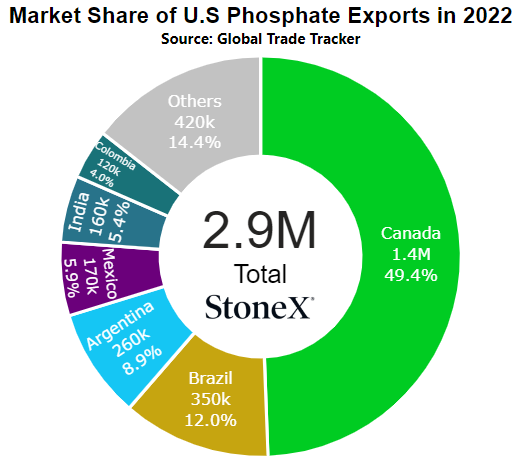
Number 5 global exporter in 2022
Price comparisons
Vs 30 days ago - 0% or approximately 2% higher
Vs 90 days ago - 11% or approximately $55 higher
Vs 6 months ago - -6% or approximately $35 lower
Vs 1 year ago - 7% or approximately $35 higher
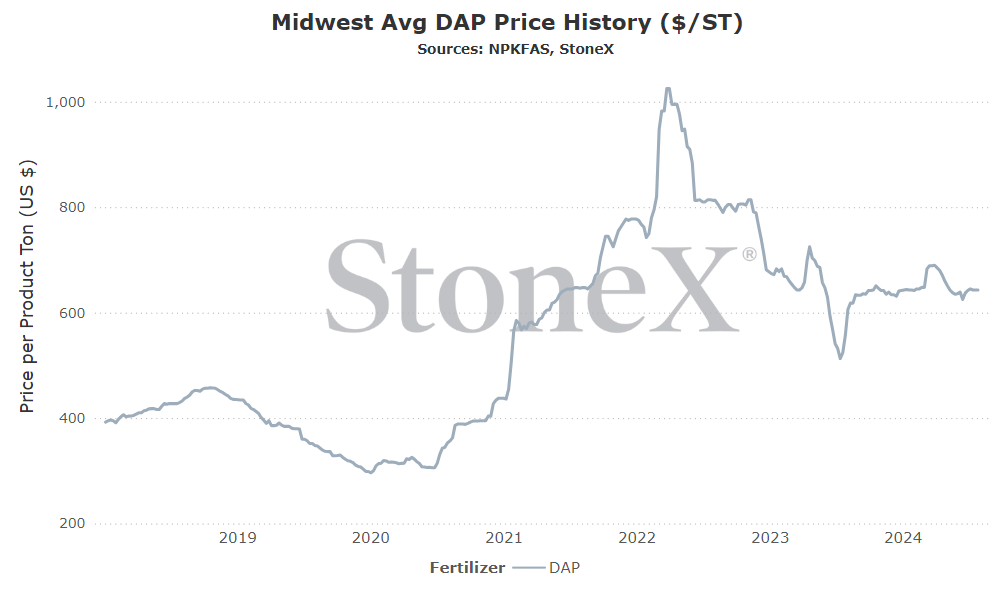
U.S. Midwest Average (using multiple points across Midwest) price comparison
Vs 30 days ago - 0% or approximately $1 higher
Vs 90 days ago - -3% or approximately $17 lower
Vs 6 months ago - 0% or approximately $1 higher
Vs 1 year ago - 13% or approximately $72 higher
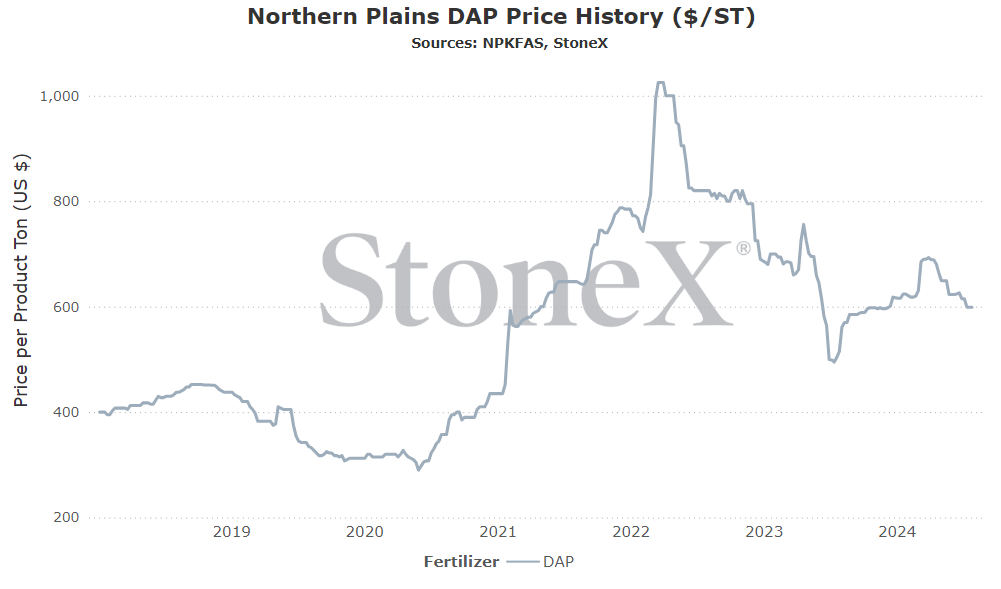
U.S. Northern Plains Average price comparison
Vs 30 days ago - -3% or approximately $16 lower
Vs 90 days ago - -10% or approximately $65 lower
Vs 6 months ago - -4% or approximately $23 lower
Vs 1 year ago - 16% or approximately $84 higher
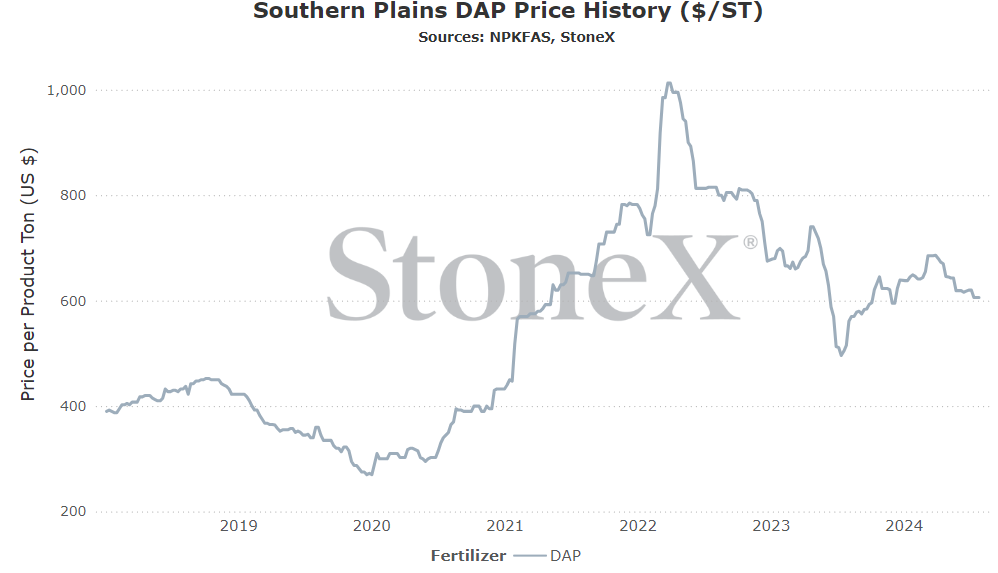
U.S. Southern Plains Average price comparison
Vs 30 days ago - -2% or approximately $14 lower
Vs 90 days ago - -6% or approximately $40 lower
Vs 6 months ago - -6% or approximately $40 lower
Vs 1 year ago - 18% or approximately $91 higher
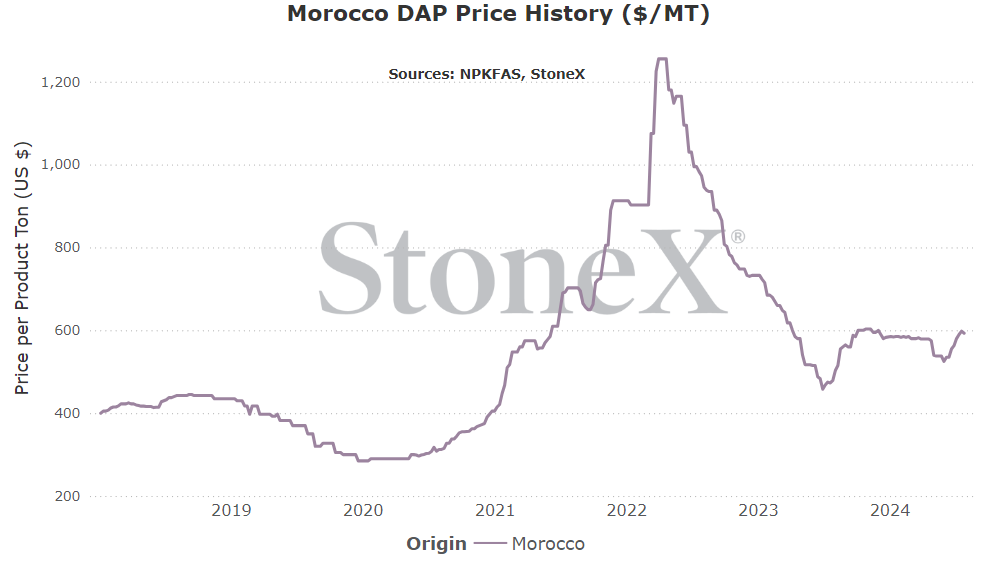
Morocco DAP price comparison
Number 1 global exporter in 2022
Price comparisons:
Vs 30 days ago - 5% or approximately $30 higher
Vs 90 days ago - 3% or approximately $18 higher
Vs 6 months ago - 2% or approximately $10 higher
Vs 1 year ago - 24% or approximately $114 higher
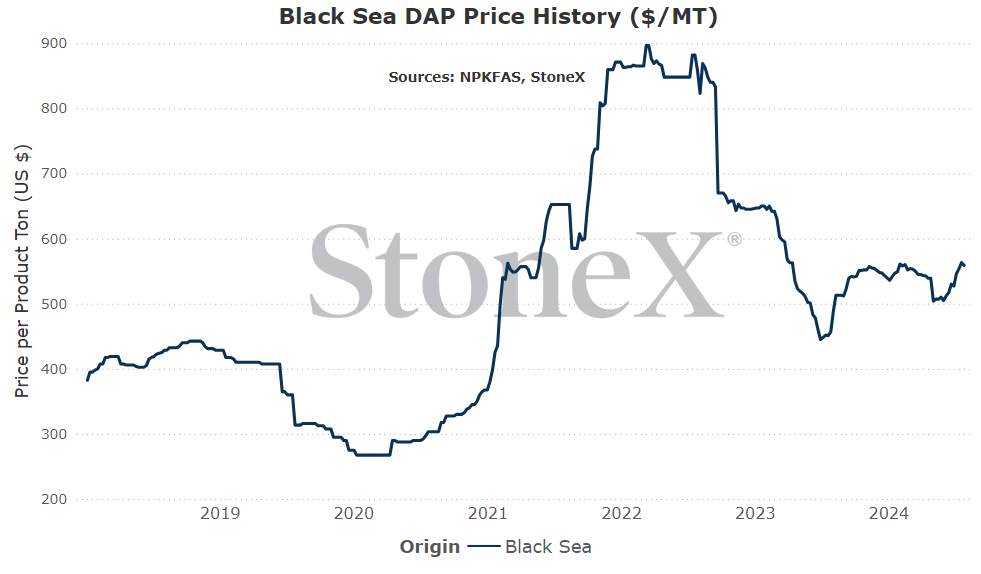
Black Sea DAP price comparison
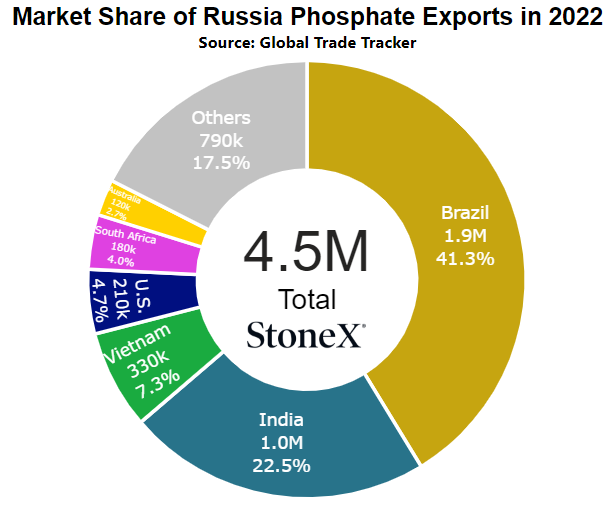
Number 3 exporter of DAP/MAP in 2022
Price comparisons:
Vs 30 days ago - 6% or approximately $33 higher
Vs 90 days ago - 4% or approximately $20 higher
Vs 6 months ago - 0% or approximately $2 lower
Vs 1 year ago - 22% or approximately $102 higher
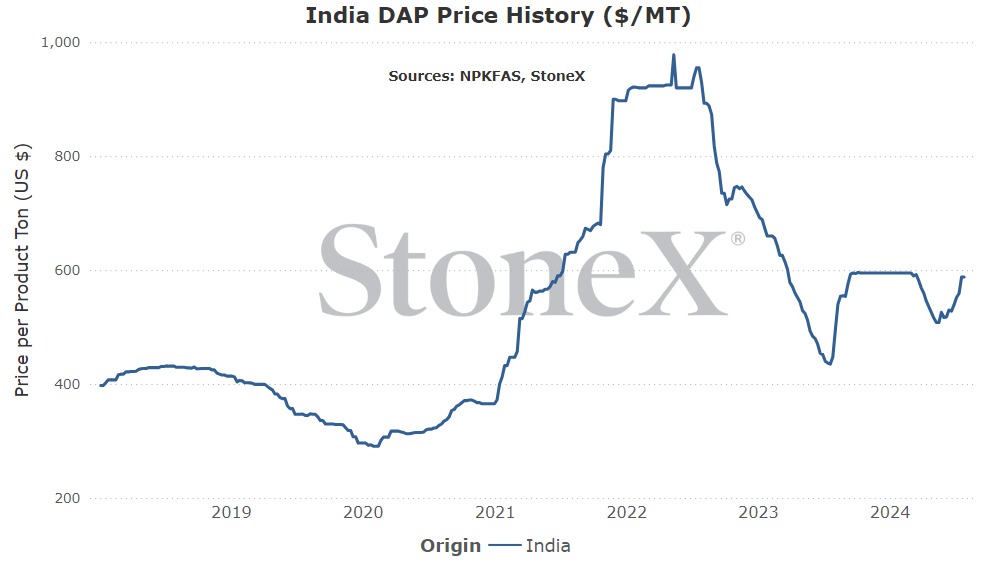
India DAP price comparison
Number 1 global importer in 2022
Price comparisons:
Vs 30 days ago - 9% or approximately $49 higher
Vs 90 days ago - 12% or approximately $62 higher
Vs 6 months ago - -1% or approximately $8 lower
Vs 1 year ago - 31% or approximately $140 higher
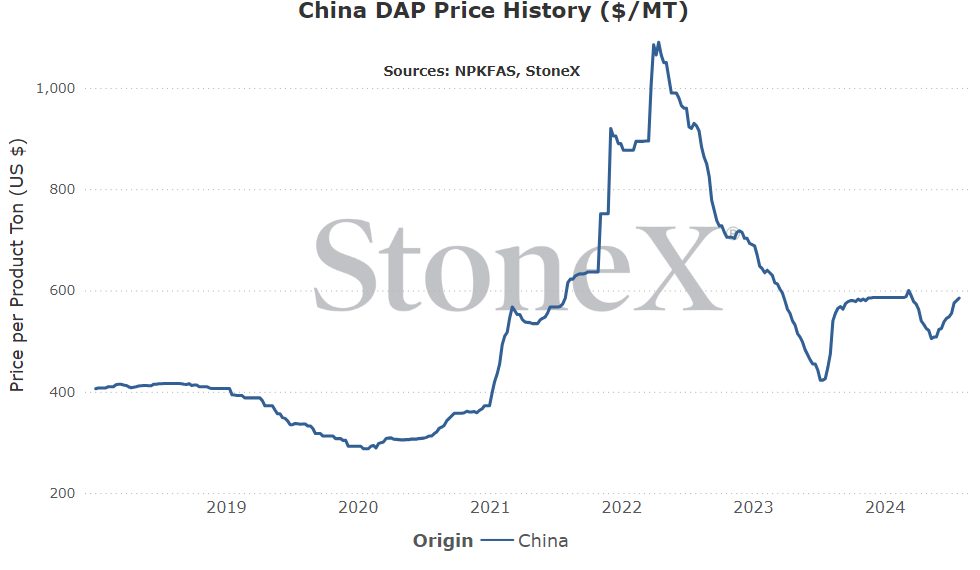
China DAP price comparison
Number 2 global exporter in 2022
Price comparisons:
Vs 30 days ago - 7% or approximately $38 higher
Vs 90 days ago - 11% or approximately $60 higher
Vs 6 months ago - 0% or approximately $1 lower
Vs 1 year ago - 31% or approximately $138 higher
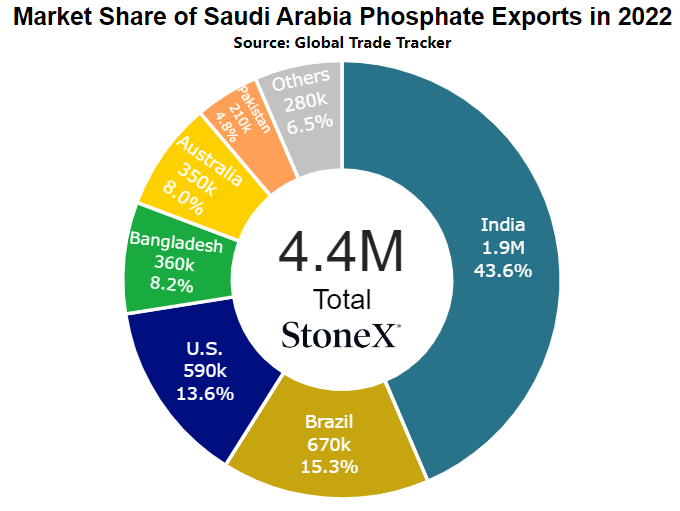
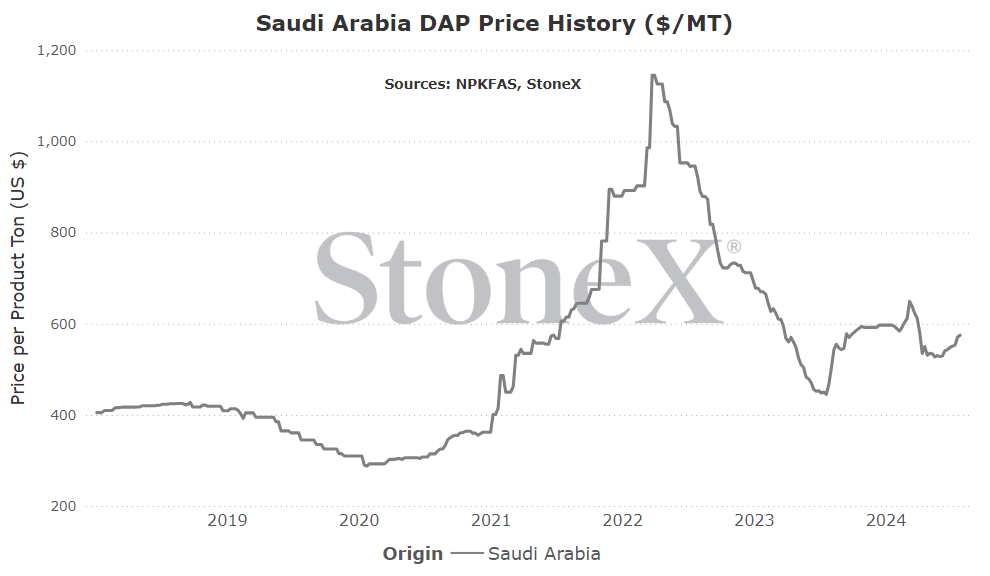
Saudi Arabia DAP price comparison
Number 4 global exporter in 2022
Price comparisons:
Vs 30 days ago - 5% or approximately $27 higher
Vs 90 days ago - 8% or approximately $44 higher
Vs 6 months ago - -2% or approximately $15 lower
Vs 1 year ago - 23% or approximately $108 higher
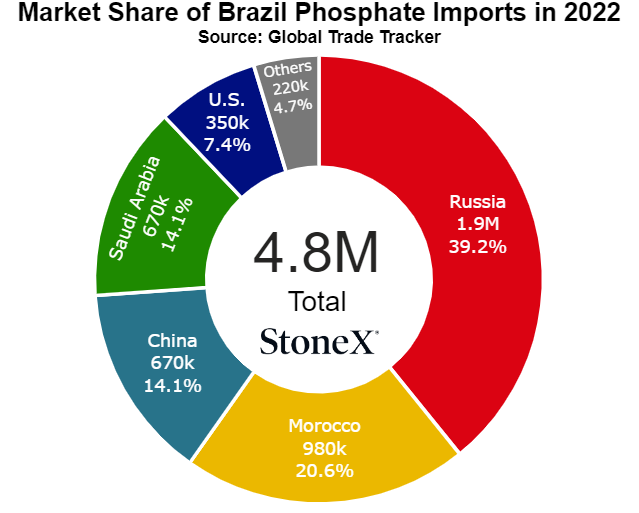
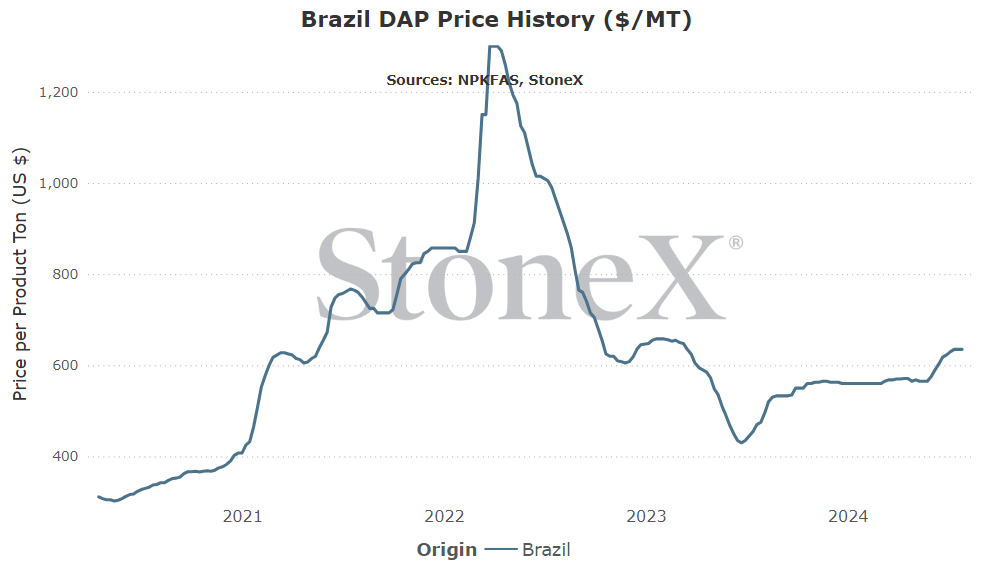
Brazil DAP price comparison
Number 2 global importer in 2022
Price comparisons
Vs 30 days ago - 2% or approximately $13 higher
Vs 90 days ago - 12% or approximately $70 higher
Vs 6 months ago - 13% or approximately $75 higher
Vs 1 year ago - 34% or approximately $160 higher
- India plays catch up – India is the world's largest buyer of phosphate, and their stockpiles are getting low. When the government fixes their subsidy program, thereby allowing imports to resume, then that largest global buyer is going to be a force. Big competition for everyone else. This is the single biggest reason I think prices get higher before anything corrects lower.
- China backs out of the export market...again – the Chinese government has played a much bigger role in what happens in the their fertilizer market...and what doesn't happen. If India starts driving prices higher, it is not out of line to expect the Chinese to slow/stop exports to ensure adequate supplies and lower values for their domestic marketplace.
- Demand doesn't get hit as the market fears – I have a big fear that fall demand is going to be poor. Why wouldn't it be. These are some of the worst values ever seen. Farmer economics are crap. It doesn't exactly help me exude confidence in demand...but what if I am wrong. On an acre basis, what is a $100 move? At 150lbs/acre, it is the equivalent of 2 bushels of corn. I'm not saying those bushels are not important, but on the ground level it isn't as huge a move as we believe it to be. If enough of the market says heck with it and proceeds as normal, values likely see even more support.
- China starts to export more with global values high – this is pretty low on my probability list. The government seems to care more about keeping domestic values low than on taking advantage of solid profitability. However, if the government felt that supplies were adequate and allowed manufacturers to do as they wish, we could see exports rise as they take advantage of solid returns on exports.
- Fall demand sees large cuts, scares suppliers – this is much higher on my probability list. I have a sneaking suspicion that farmers are going to tell phosphate where to go. For many, it is cost prohibitive to go full phosphate this year. Enough of that occurs, supplies will catch up.
- All global demand delays due to high prices/big interest costs/etc. – this isn't to say that demand is going to be lower as stated above for North America. This is more that global values just dig in and wait. They cannot wait forever but sometimes, when enough of the market disappears, manufacturers are forced to lower their price to move inventories. Doesn't look likely today but worth watching.
We believe that only looking at the flat price of either grains or fertilizer can be misleading:
-
Only selling grain can hurt you if fertilizer prices rise substantially
-
Only buying fertilizer can hurt you if grain prices fall
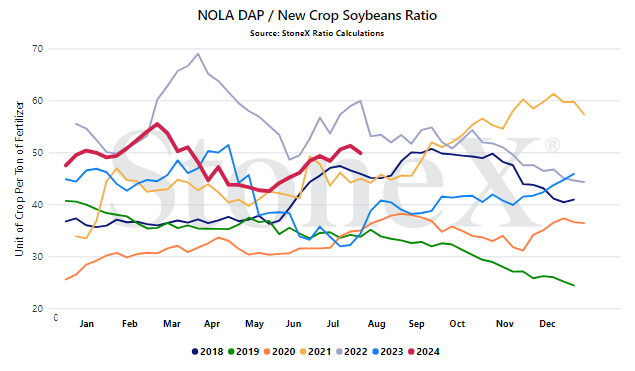
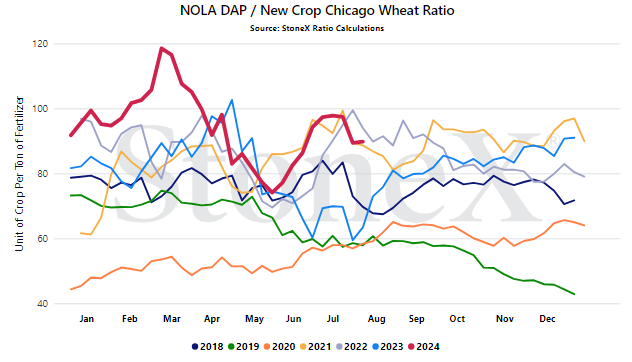
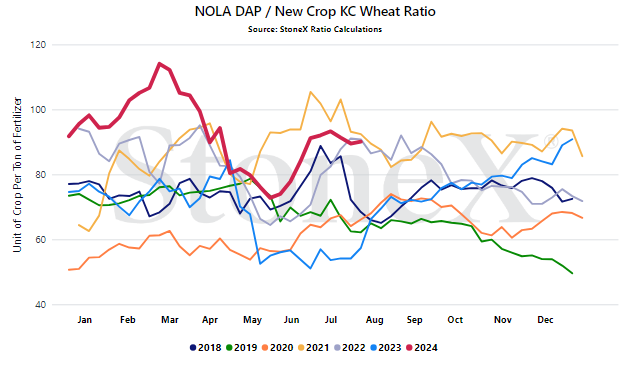
We look at the ratio "value" to get a better indication of where we are or how many bushels of X does it take to pay for 1 ton of fertilizer.
Would you rather:
-
Spend 150 bushels to pay for 1 ton of DAP
-
Spend 80 bushels to pay for 1 ton of DAP
When we compare the current ratio value against recent years, we start to see if we are high or low.
YOUR VALUES MAY LOOK DIFFERENT
This graph looks at the NOLA DAP price vs the flat grain price. There are no logistics on either product. Your location will look different due to fertilizer logistical costs, grain basis, etc.
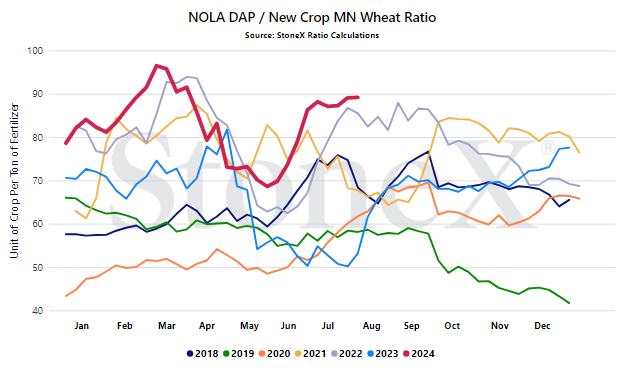
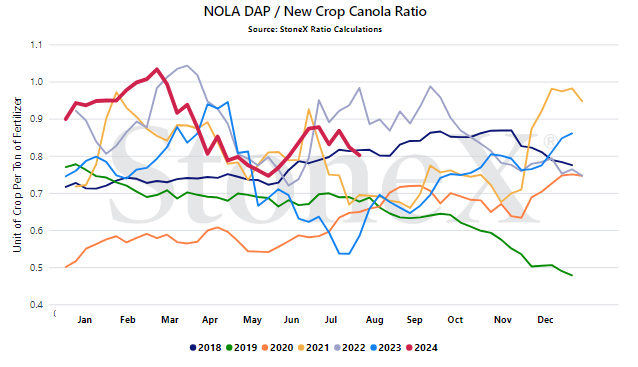
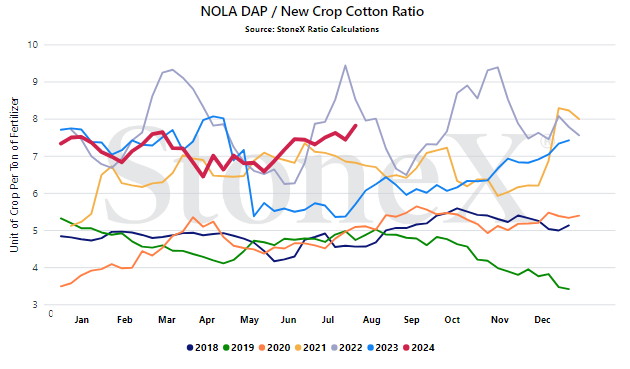
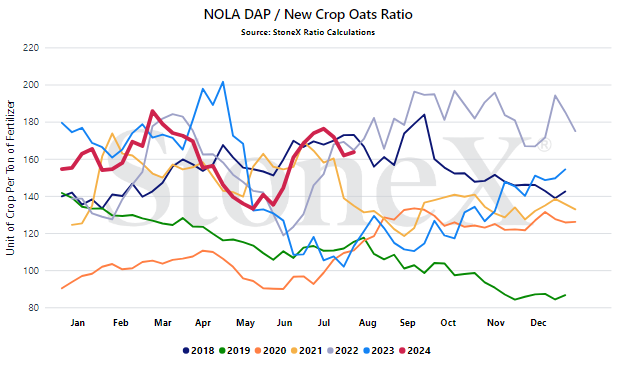
- India, plain and simple - this is easily my biggest focal point for global phosphate. Stockpiles in India are low vs recent years and the current subsidy rate is only going to make that bad situation worse. Eventually, I think the government will need to cave to higher global values. If/when they do, the world's largest buyer will be in catch up mode...and that should spook the market.
- Chinese exports (i.e. what will the government allow?) - global phosphate prices had been sliding...until Chinese exports were slowed. Then things turned around quickly. That is the power a country like China holds over the world phosphate market. If India fixes their subsidy program and starts buying heavily at the same time that global fall markets start stepping in, we could see demand jump substantially. If the Chinese government sees this and interprets it as world inventories are getting very tight, it is not insane to think that they could close their borders...again.
- Fall demand destruction - so my global outlook is one of higher prices and tighter supplies. No, I do not like that outlook but for right now, it is reality. However, we also need to look closer to home. Here in N.A., I think we will see demand destruction in the fall. Some farmers will delay fall application to spring in hopes of lower prices. Some farmers will cut back their application rate, hoping it does not impact overall yield potential. Some may have adequate soil levels and skip totally. We may have a situation where here, demand is down and supplies get much better...but do not lose sight of the world. We could finish fall season on poor demand but still see prices higher.
StoneX Ratio Calculation
The ratio calculation is derived from Bloomberg historical grains values as well as fertilizer values from StoneX, NPKFAS, and Argus.
The calculation is simply dividing the fertilizer price by each grain price.
All data was sourced from StoneX unless otherwise noted.




