The Base Metal Suite Ends H1 2025 Highly Divided, Given This, What Can We Expect Ahead?
A Recap of the Macro Landscape in H1: Building Headwinds Limit Price Gains in Q2
The base metal index closed Q2 almost unchanged (+0.8%), marking a notable shift in the outlook for the suite after a robust 7.5% gain in Q1 underpinned by a weak U.S. dollar, optimism over Chinese stimulus and tariff-independent supply risks.
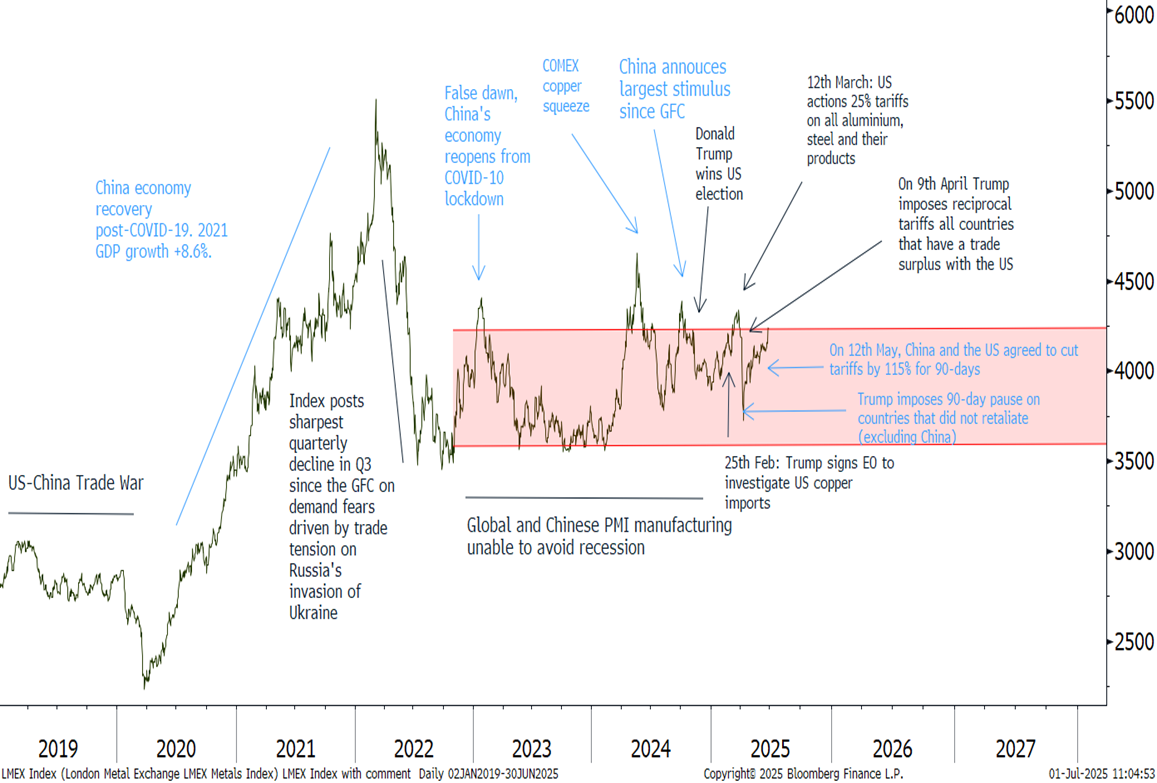
As it stands, the key driver behind price weakness has arisen from uncertainty attributed to US tariffs, which remain blanked at 10% with major trading partners, at 25% on Canada and Mexico, 30% on China, 50% on alumnium and steel & their derivatives and 25% on automotive and parts. Alongside this, under Section 232 of the Trade Expansion Act of 1962, investigations are ongoing within various markets including semiconductors, pharmaceuticals, critical minerals, commercial aircraft, lumber, timber and importantly copper, contributing to a bearish leaning macro-economic landscape, with a potential shock to global growth leading to lower investment, lower demand prospects and ultimately lower prices.
With much of the impact from current tariffs yet to be reflected in macroeconomic readings, we expect that the US Federal Reserve will likely be on hold well into H2 when it comes to rate cutting, further delaying a recovery in cyclical demand, while the outlook for Chinese growth in Q2 is growing increasingly clouded. Indeed here, with no signs of stabilization in within property investment, consumer confidence remains near record low levels, while key growth areas in Q1 such as solar installations and exports are likely to have peaked given changing policy and tariff front-loadings respectively.
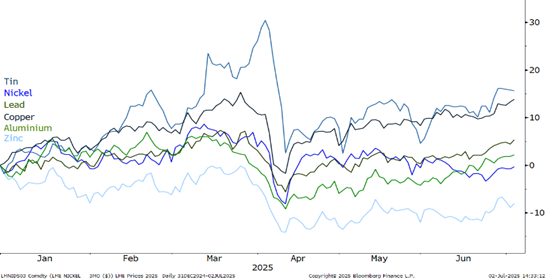
At the time of writing the LMEX index has only just returned to the levels posted pre-2nd April or ‘liberation day’, with the base metals remaining the third worst performing commodity sector behind precious metals and livestock.
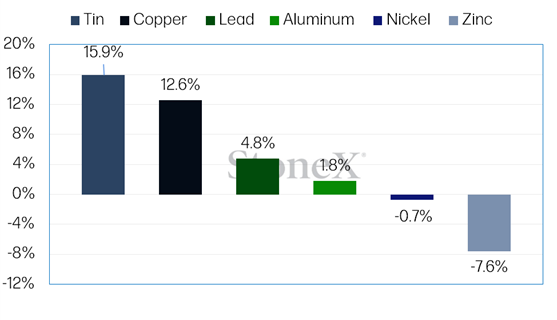
LME 3M Base Metal Price Performance H1 2025
Source: Bloomberg
LME 3M Base Metal Price Performance H1 2025
Source: Bloomberg
LME 3M Base Metal Price Performance Versus Key Macro Drivers
Source: Bloomberg
Tin – Ongoing Supply Risks Maintain a Low Stock Environment
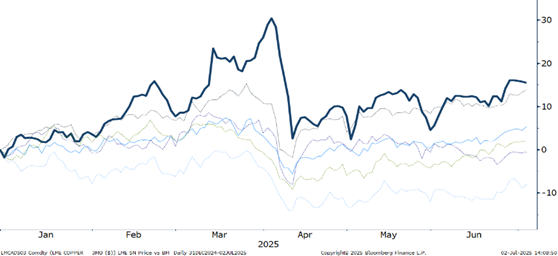
LME 3M Tin Price Performance Versus Rest of the Suite
Source: Bloomberg
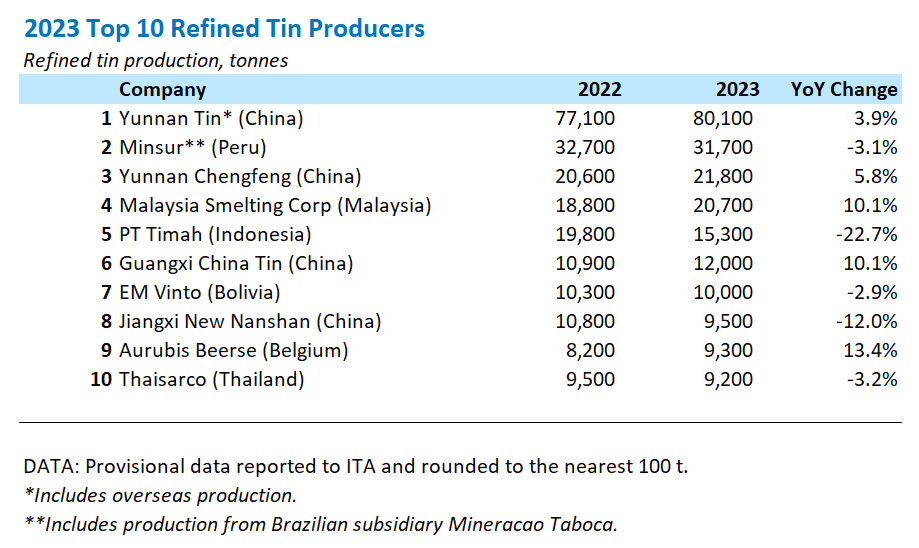
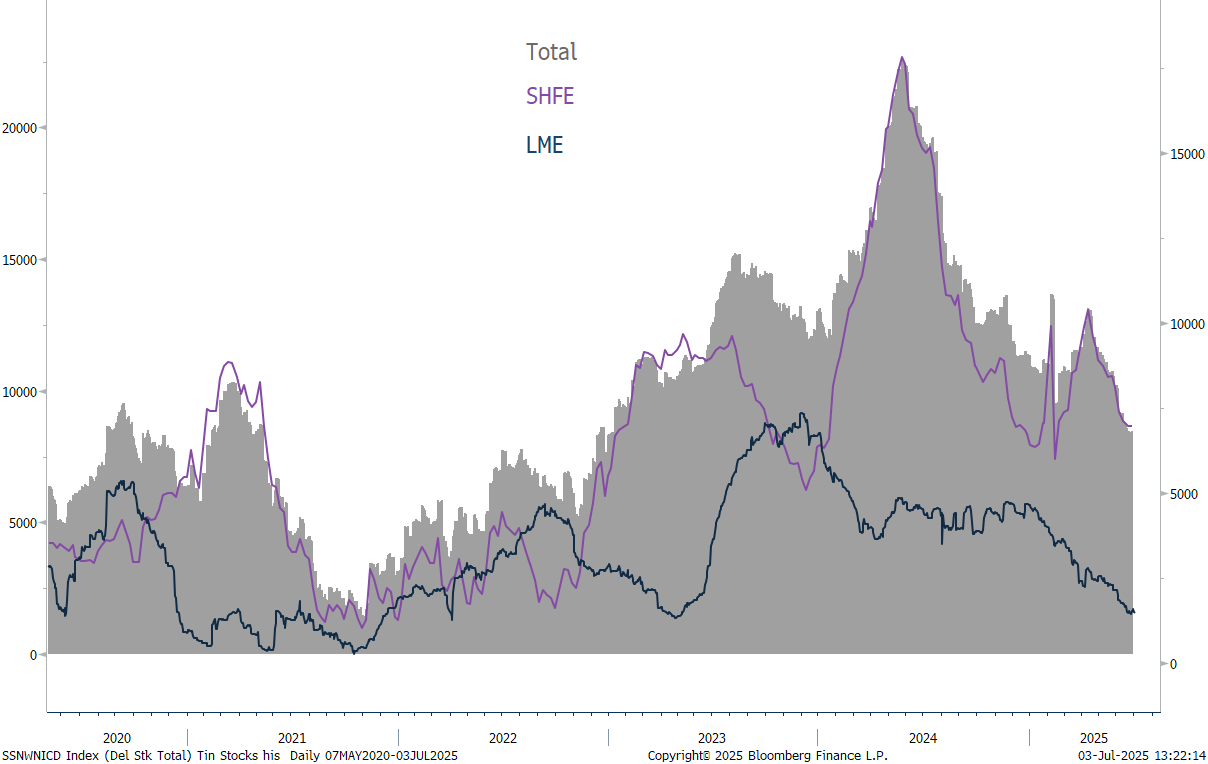
• Tin has been the clear outperformer in 2025 (+15.9%) driven by robust fundamentals in which a host of supply risks within its largest producing countries of Indonesia, Myanmar and the DRC have been set against strong and price inelastic demand in fast growing end-uses such as renewable energy, artificial intelligence and energy storage. As a result, global visible exchange stocks have been significantly drawn down, standing 23% lower than where they were end-2024.
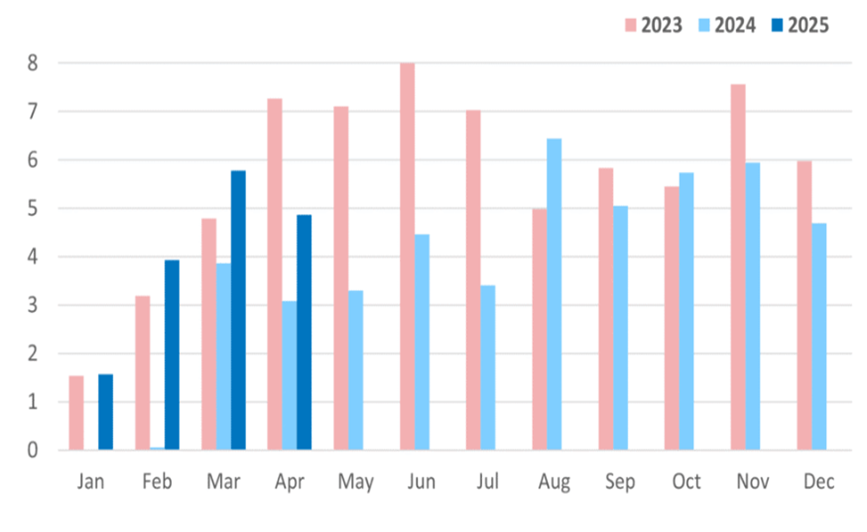
• However, as supply risks start to fade with resumed exports out of Indonesia (up 130% Y/Y over January-April), following a 33% decline last year, the restart in April of Myanmar’s largest tin mine (following a 20-month ban) and the restart of Alphamin Resources Corporation Bisie mine in the DRC, we tin’s micro story to ease in H2.
• Having said this, production from Myanmar’s Wa State is yet to return to normal, with cross border flows of tin ore into China at very low levels, resulting in Chinese refined production posting a 15% Y/Y decline in June (based on SMM). Note, Myanmar is the world’s third largest producing country of tin and the largest importer to China.
• As a result, tin (alongside copper) is one of the only metals that have posted backwardations in June, with the market set to maintain a deficit for a second year in 2025.
Source: ITA
Exports From the World’s Largest Tin Producing Country Show Signs of Recovery
Source: ITA
Global Visible Tin Stocks
Source: Bloomberg
Copper – LME Backwardation Structure to Remain in Play Until Outcome of US Investigation on Copper Imports is Clear
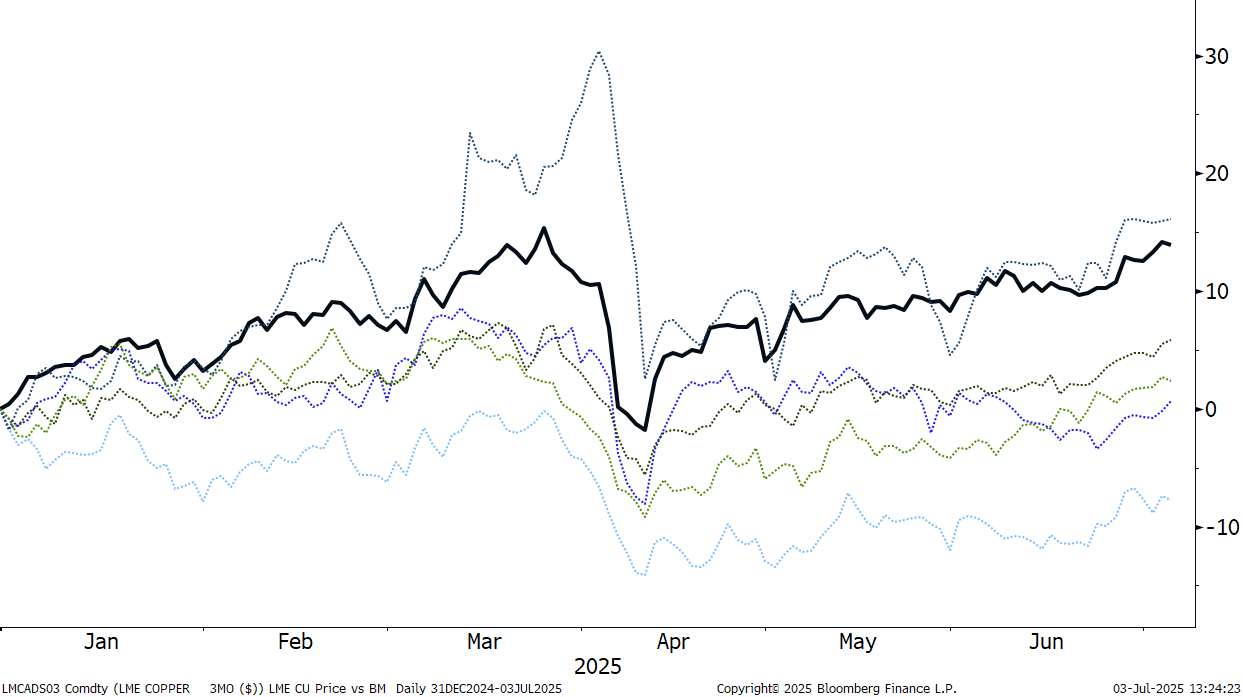
LME 3M Copper Price Performance Versus Rest of the Suite
Source: Bloomberg
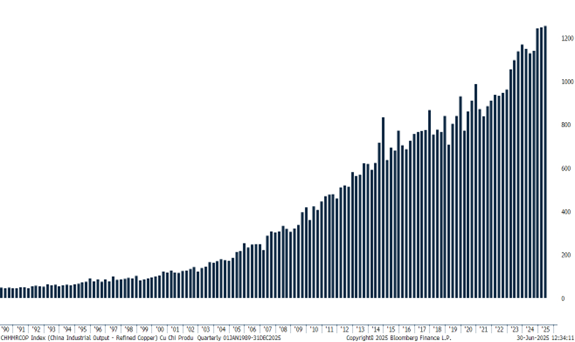
The global micro picture for copper is fairly modest for 2025, with steady demand versus improving refined output to result in the third year of surplus. The impact of the ongoing Section 232 investigation has caused copper to post its highest level of price volatility since end-2022.
Here, while in theory the investigation has 270 days to run before a recommendation on action is required, huge uncertainty surrounds not only the timing of a potential tariff, but at what level it would be set and if it will include any country exemptions. With the US having a 44% reliance on copper imports, it is perhaps not surprising that COMEX copper futures posted a nominal high just a month after the executive order was signed (25th February), while it is understood that over 400,000t of refined copper have been directed into the country over the first five months of the year.
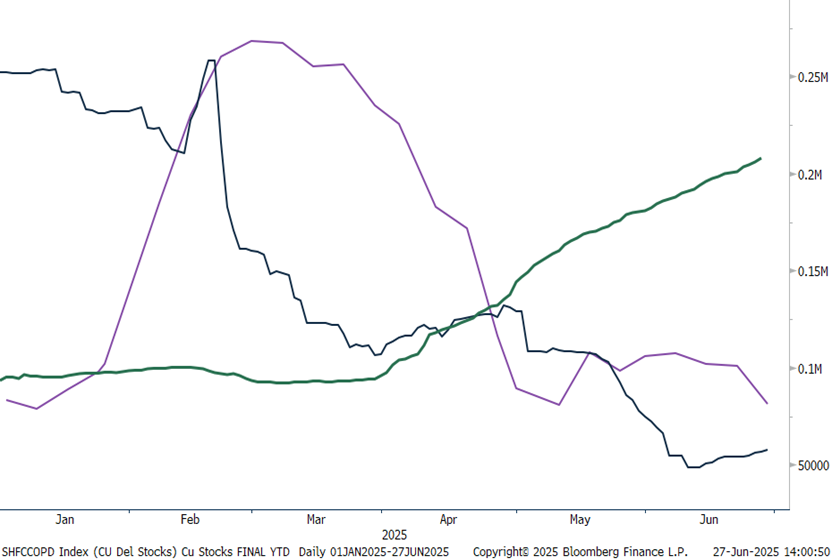
This in turn has created an artificial tightness in the global market, with not only traditional trading partners such as Chile and Canada re-routing trade into the US, but units being taken from markets of last resort including the LME and SHFE, with stocks on both exchanges at their lowest level seasonally since 2023.
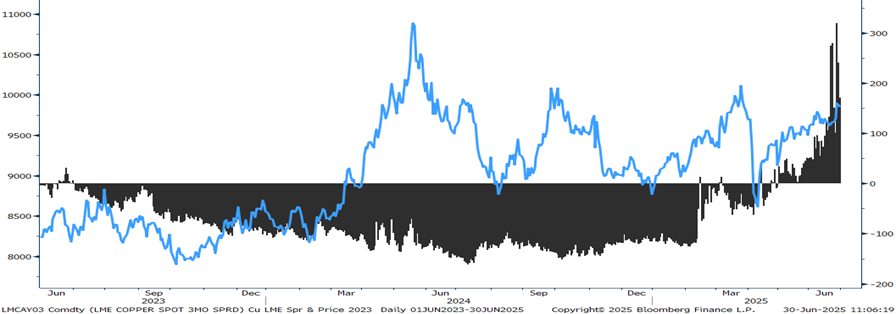
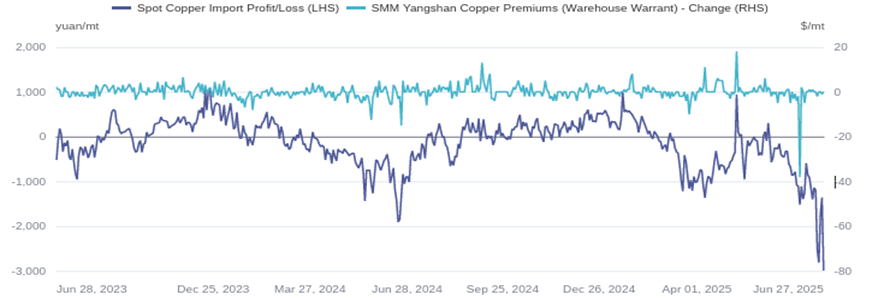
As it stands, backwardation structures have formed across near-month contracts on the LME and SHFE, with an ongoing squeeze on the LME temporarily removing copper from acting as Dr. Copper , with prices instead being almost solely led by the micro picture. This is a change from what we have seen over H1, in which copper prices appeared to be caught between the impact of potential US copper tariffs versus the wider macro impact of global tariffs, which is weakening the demand outlook for industrial metals. Since the start of June, the narrowing SHFE/LME arbitrage has resulted in Chinese market players posting import losses, with Chinese smelters moving to increase exports, with 35,000t forecast to enter LME Asian warehouses in the near-term. While this development will not reverse the backwardation structure on the LME, it may limit recent highs, in which the tom/next spread hit its highest level since 2021 at the end of June.
In our view, while tariffs appear to be likely, the longer they take to be signed in, the further refined tightness is expected ex-US and the longer it would take for trade routes to ‘normalize’. We expect the same outlook on copper tariffs containing country exemptions (such as Chile), while the higher tariffs level would stimulate the opposite response, making it more undesirable to import material into the US.
LME Cash-3M Spread Versus LME 3M Price
Source: Bloomberg
SMM Chinese Copper Import Profit/Loss
Source: SMM
YTD COMEX, LME & SHFE Copper Stocks
Source: Bloomberg
Chinese Monthly Refined Copper Output
Source: Bloomberg
Copper Smelter Cathode Manufacturing & Processing Cost
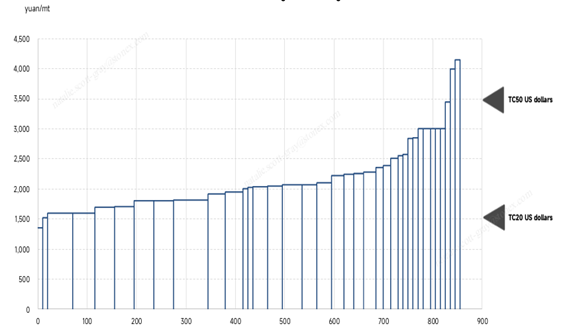
source: SMM
Lead – Price Performance Sheltered by Unique Fundamentals
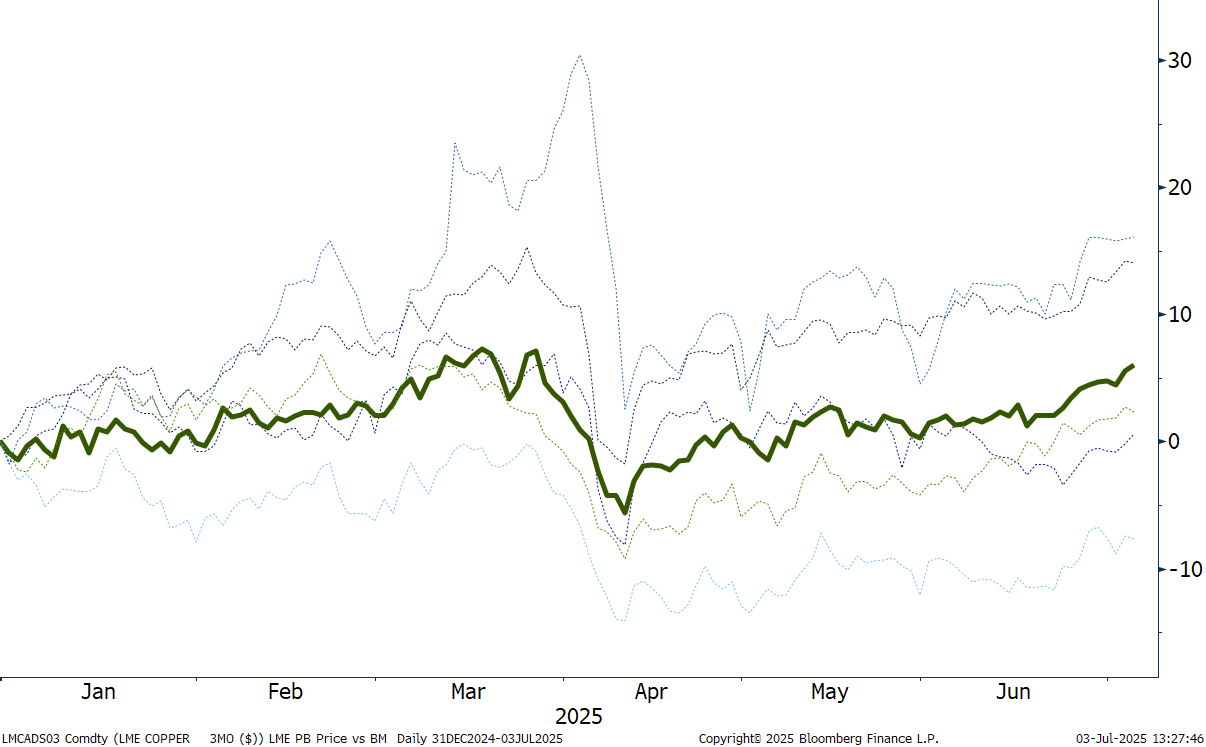
LME 3M Lead Price Performance Versus Rest of the Suite
Source: Bloomberg
Lead ended H1 as the third best performing base metal, with a positive gain of 4.8%. Lead’s price has been supported by its unique fundamentals with two-thirds of supply coming from secondary sources, while its largest end use in lead-acid batteries is supported by two-thirds of consumption stemming from ‘recession proof’ replacement requirements. Meanwhile, in the absence of significant market imbalances, lead often takes its price cues from copper, which has provided additional price support.
Looking ahead, with forecast hot weather across the northern hemisphere as we enter summer, we expect lead demand to be underpinned in the months ahead.
Aluminium – Fundamentals Set to Soften in H2, Global Premium Diversion Builds
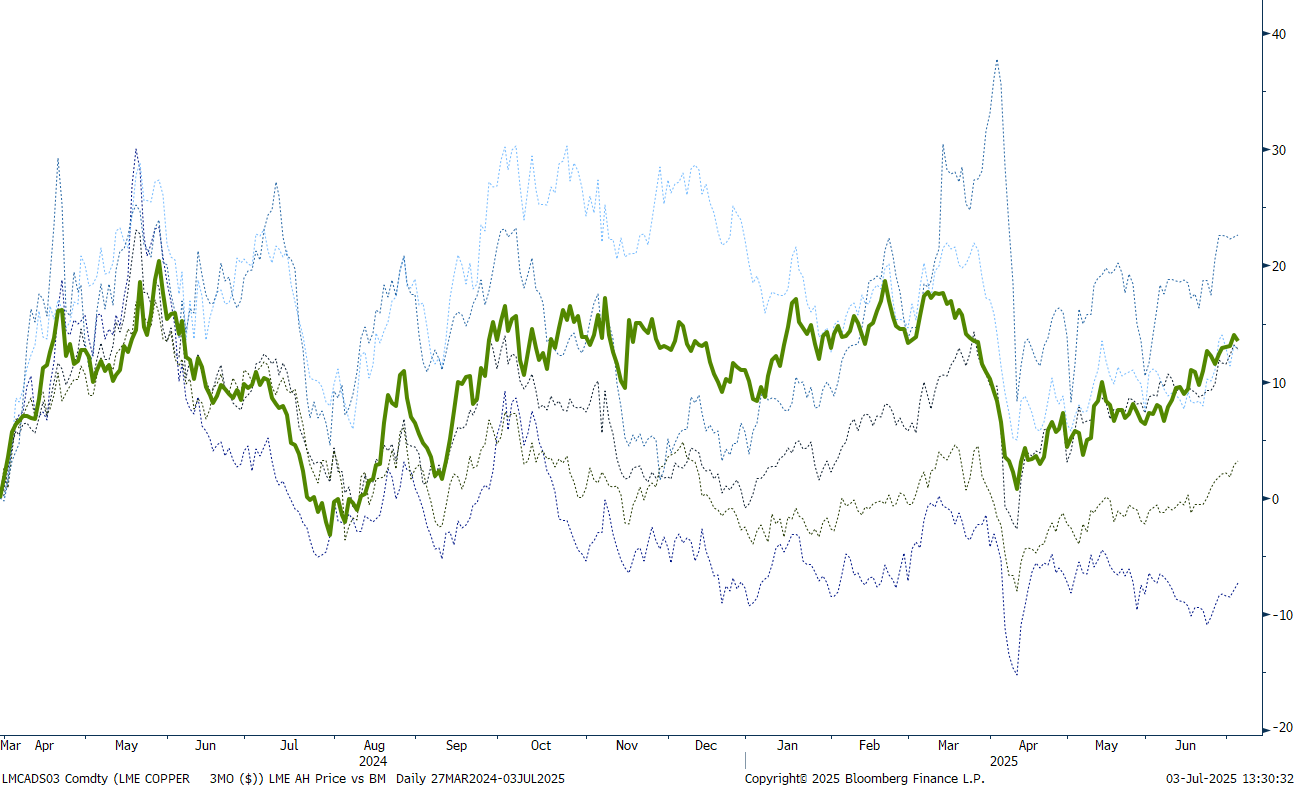
LME 3M Aluminium Price Performance Versus Rest of the Suite
Source: Bloomberg
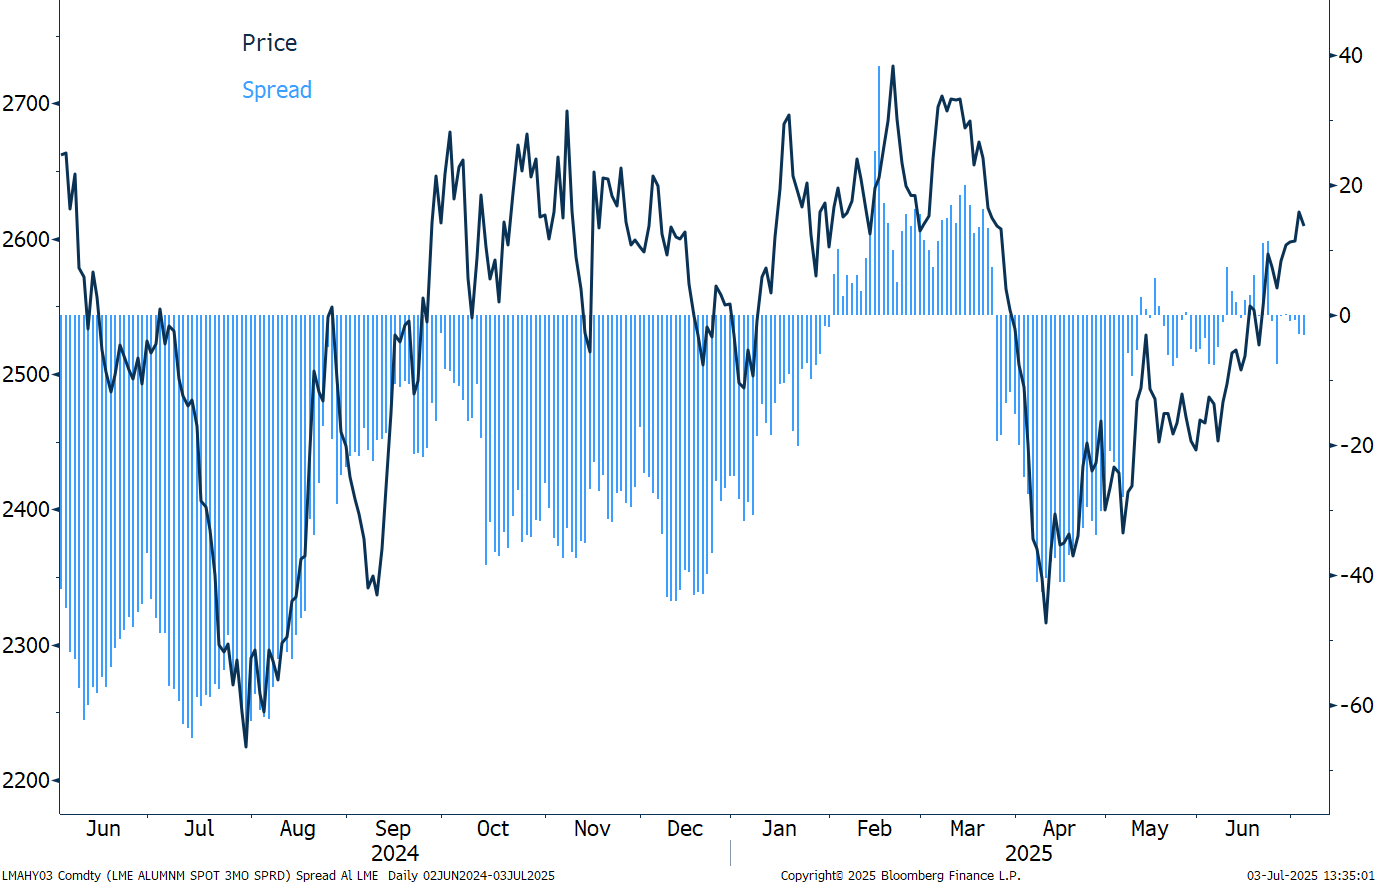
Aluminium ended the first half with a modest gain of 1.8%, despite starting the year strongly with robust demand coming out of China (especially for solar) and a host of supply risk in the alumina market at end-2024. Prices ex-US have faced increasing headwinds, not just from the downgrades to global growth prospects (the World Bank forecasting growth at 2.3% from 2.8% in January), but from re-routing of material from the US on the back of tariffs.
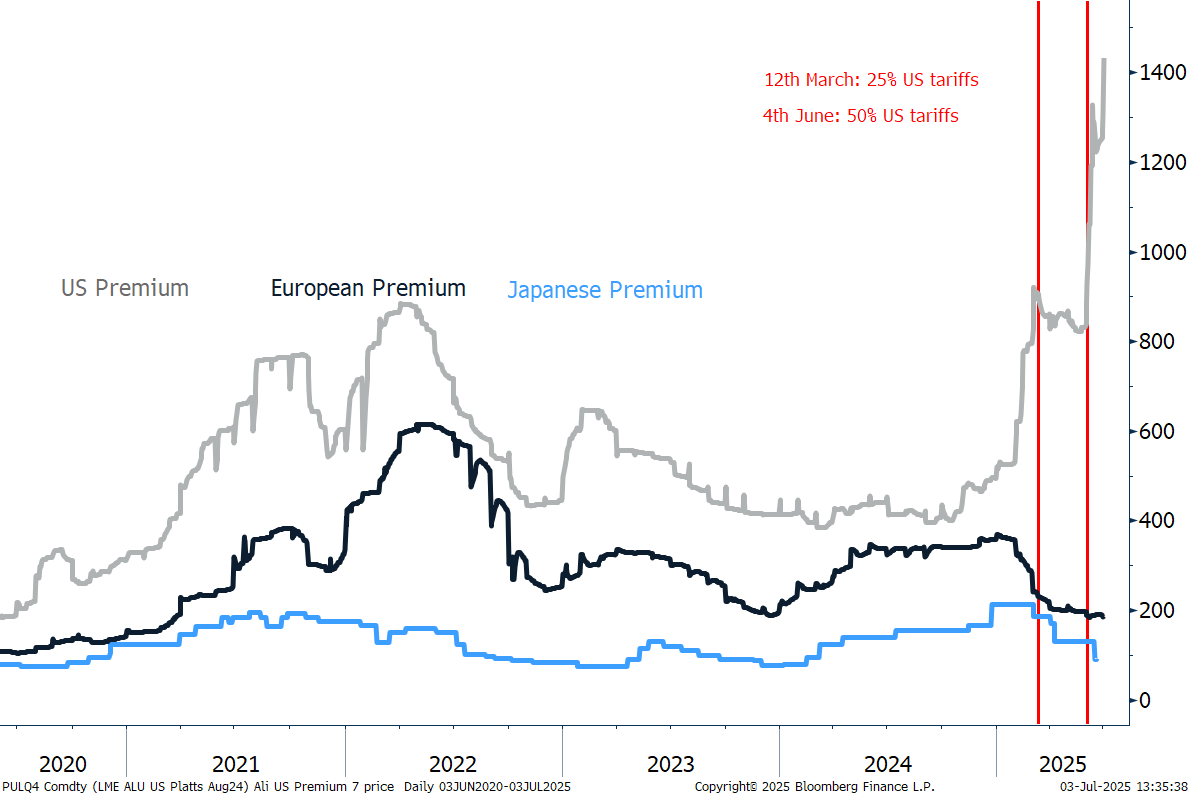
Indeed here, while the US administration implemented 25% tariffs on all aluminium and derivative products from 12th March, they moved to increase the tariff to 50% by 4th June, with the impact to global market being reflected in premiums. As it stands, since the 12th March, the US premium is up 82%, while the European and Japanese premiums have fallen 40% and 58% respectively. Note, the Japanese premium in Q3 was set at $108/t, a 41% drop from Q2 and its lowest quarterly fixing since January 2024, on weak demand and plentiful supply.
Looking ahead, we expect that resilient supply in China and Indonesia set against uneven demand will flip the aluminium market into a surplus this year, capping future price gains in H2, especially considering that China has not only passed its peak demand season (ending mid-May), but solar panel installations are forecast to pull lower from April, following an upcoming pricing policy change in June.
Global Premiums
Source: Bloomberg
LME 3M-Cash Spread
Source: Bloomberg
Nickel – Low Prices May Increase Supply Risks in 2025, But This is Unlikely to be Enough to Prevent a Fifth Year of Market Surplus
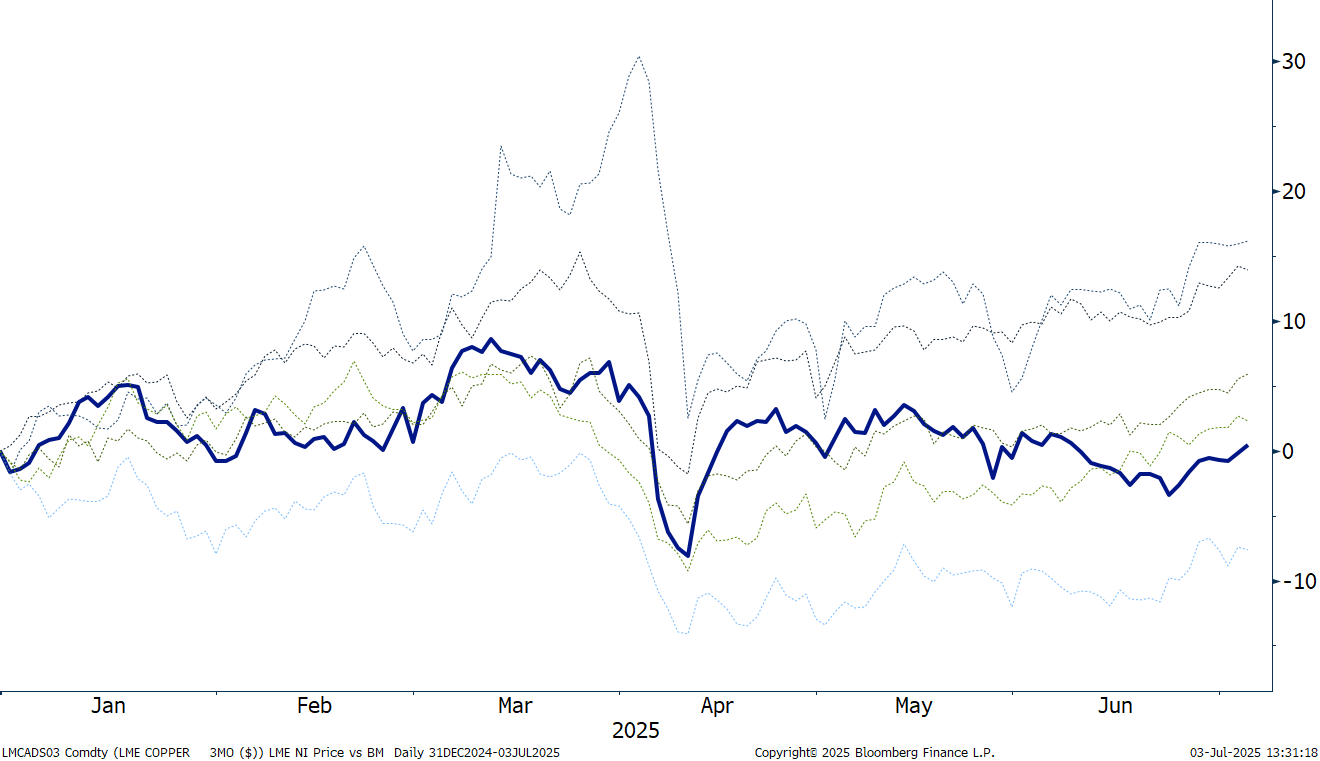
LME 3M Nickel Price Performance Versus Rest of the Suite
Source: Bloomberg
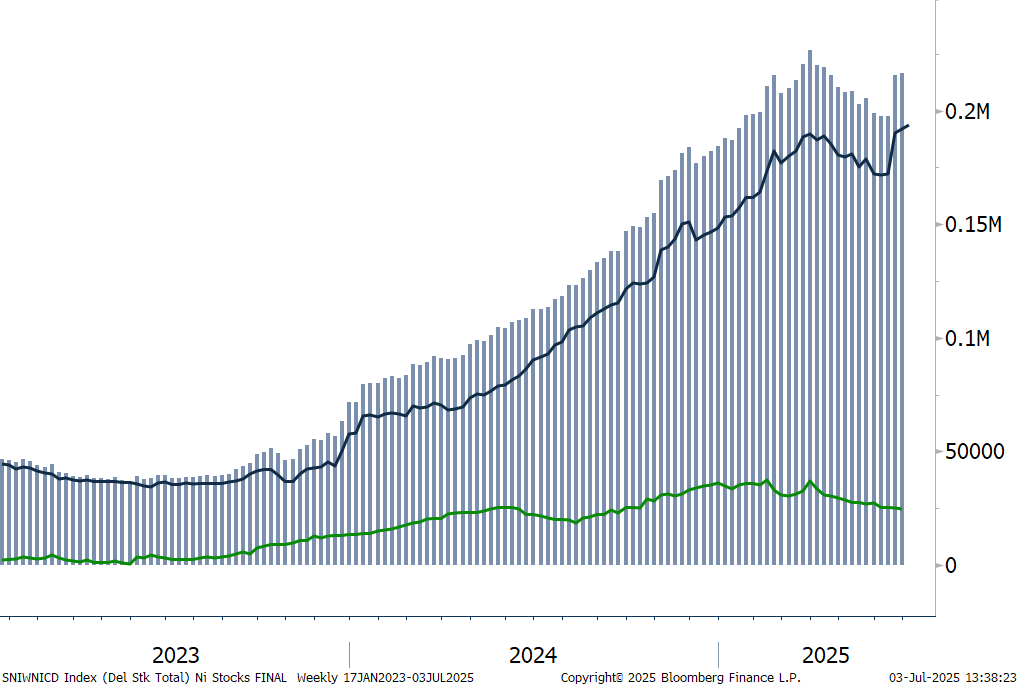
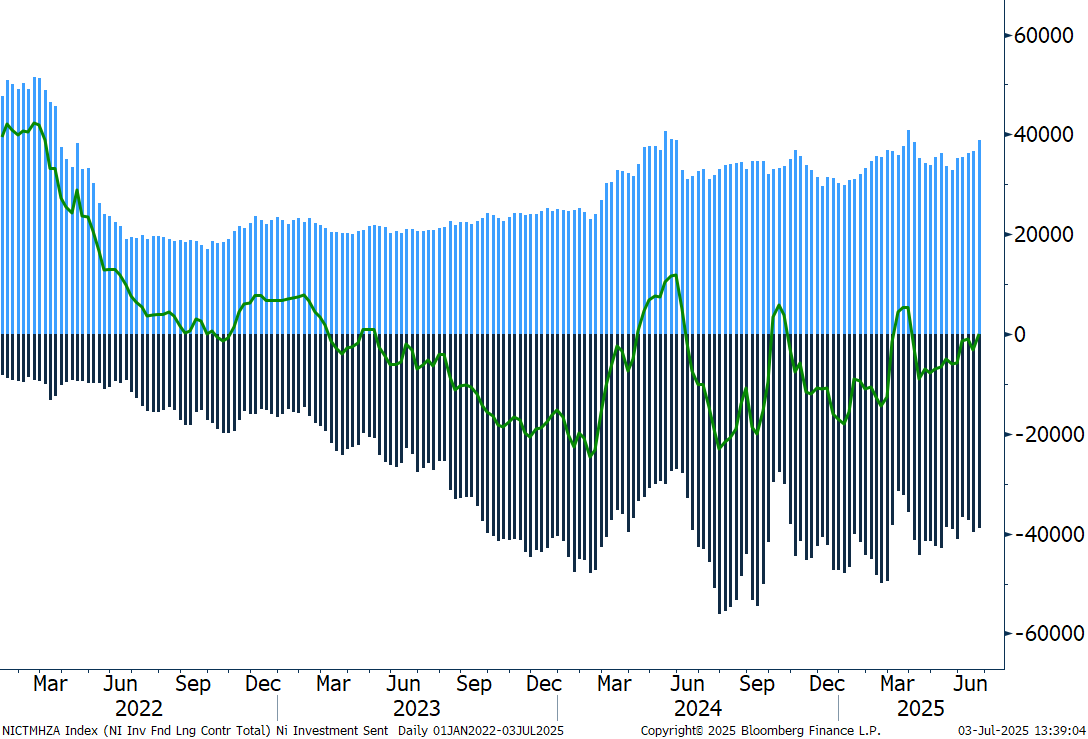
Nickel’s H1 performance has come in almost flat, with modest fundamentals accompanied by weak investor demand and the fast tracking of Chinese and Indonesian brands maintaining inventory levels across major exchanges.
On the demand side, while the largest end use market (stainless steel ) has disappointed, the rapid shift away from nickel containing lithium-ion batteries in EV and energy storage for lithium-iron-phosphate batteries has resulted in forecast downgrades. On the supply side, Indonesia continues to pump out material despite a low-price environment, keeping the global market in a forecast fifth year of surplus. It is therefore unsurprising that LME prices have fallen to their lowest level since 2020 this year. Here, with prices moving below the significant $16,000t level, profitability for producers both within and ex-Indonesia are being tested, however, with integrated market players able to continue to pump out healthy quantities of material, we continue to see nickel as likely to be the weakest performing base metal this year.
Nickel Visible Stocks
Source: Bloomberg
LME Speculative Positioning
Source: Bloomberg
Zinc: Modest Prospects for Demand and an Easing in Supply to Limit Price Gains
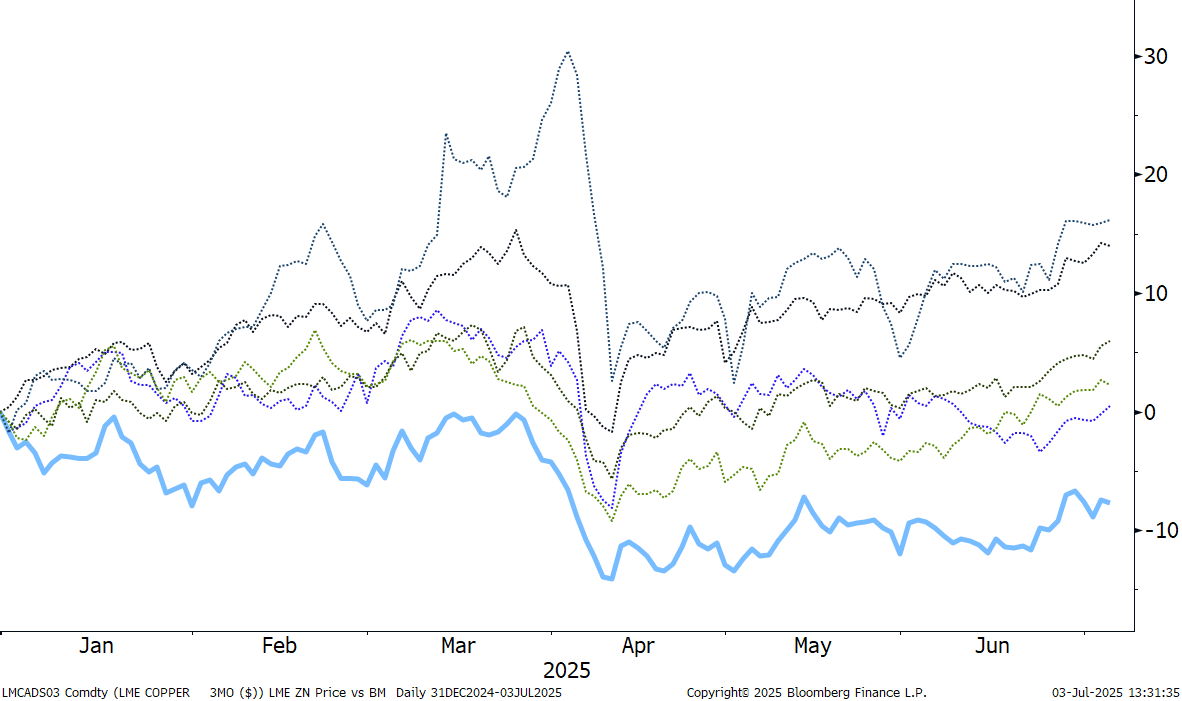
LME 3M Zinc Price Performance Versus Rest of the Suite
Source: Bloomberg
Despite zinc arguably having the tightness supply fundamentals across the suite at the start of the year, following three years of declining mine production and a fall in refined output last year, zinc has been the weakest performing base metal in H1, down 7.6%.
The key drivers behind this weak performance have arisen from modest prospects for steel demand in 2025, in which production has fallen 1.3% over January-May (based on the World Steel Association). Zinc has almost a 60 % exposure to the steel market.
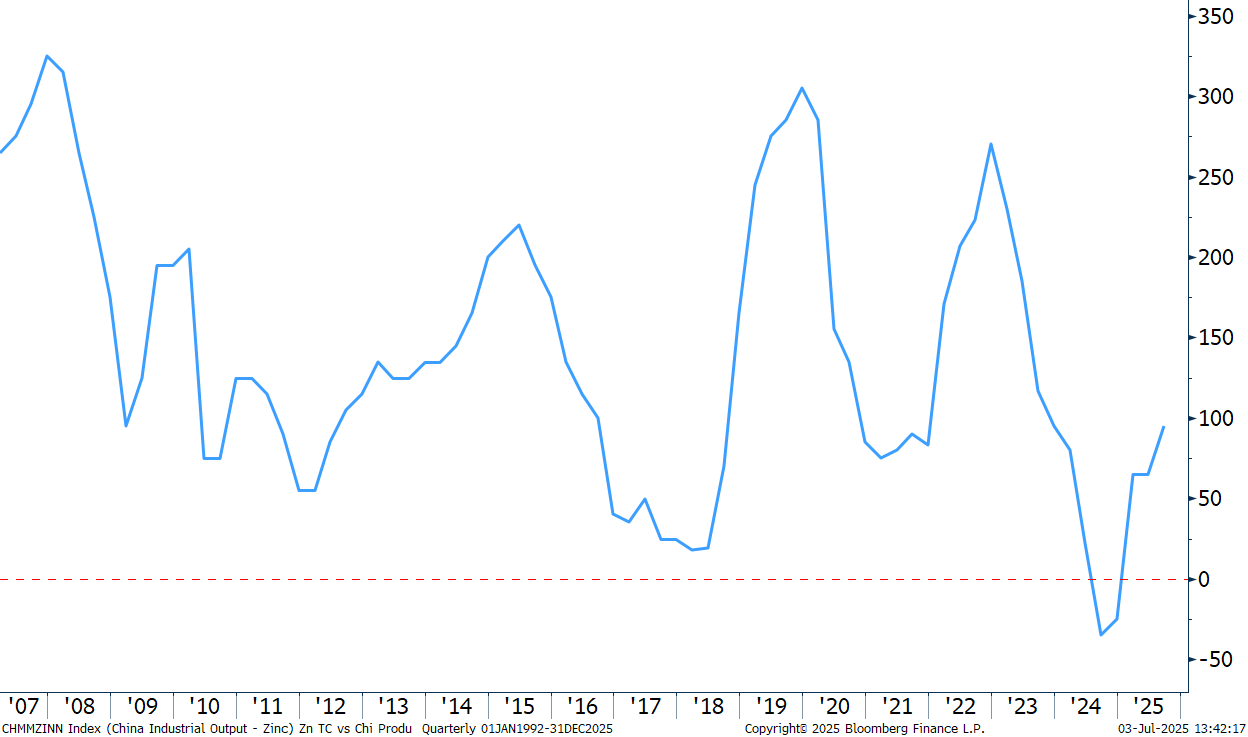
Meanwhile, on the supply side, mine production has jumped 5.1% Y/Y over January-April (based on ILZSG ), with Chinese imports of concentrate up 52.5% Y/Y over Jan-May, versus a 23.4% fall over the same period in 2024. As a result, spot TCs moved out of negative territory in January, currently posting at $95/t, its highest level since December 2023.
Looking ahead, we expect zinc prices to face headwinds on weak demand versus an easing in supply on the back of ramping up of new output at key mines in the DRC and expansions in Peru, alongside a forecast rebound in China and Mexico, with an acceleration in output from India.
Zinc RC/RC
Source: Bloomberg
In summary, we expect tin to remain a top performer in 2025, supported by ongoing supply tightness, while copper prices will continue to be underpinned as long as uncertainty remains surrounding the Section 232 investigation. Lead is likely to remain in the middle of the group, given its unique characteristics, while nickel may well find modest price support with growing supply concerns over profitability. Dampening demand forecasts and building supply fundamentals are likely to keep zinc below 2024 highs, while aluminium will face a battle holding above its psychological $2,700/t level.