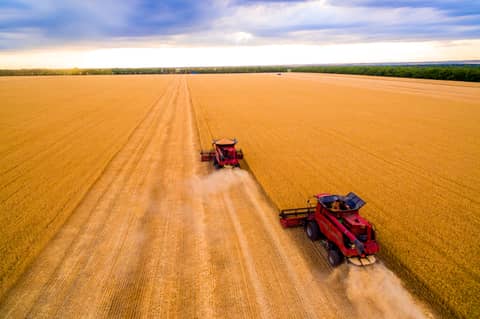
USDA’s weekly crop conditions were mostly constructive for corn and soybeans, with corn rated 68% good/excellent and soybeans 66% good/excellent, while soybean planting reached 95% complete. That keeps row-crop conditions in solid shape nationally, even with localized flooding and excess moisture concerns in parts of the eastern Corn Belt. The bigger issue remains wheat: winter wheat was only 27% good/excellent, while harvest advanced to 25% complete, keeping quality and yield concerns elevated as harvest moves forward. Cotton was more mixed at 50% good/excellent. Overall, the report leans neutral-to-slightly bearish corn/beans from a crop-condition standpoint, but still supportive wheat due to poor winter wheat ratings.
USDA Secretary Rollins said USDA and DHS are looking to sign an MOU this week to coordinate the federal response to New World screwworm. The MOU would allow USDA and Homeland Security to collaborate more directly on detection, movement controls, border enforcement, and outbreak response. For livestock markets, the headline is supportive because it confirms the government is treating screwworm as a serious biosecurity threat, not just a regional cattle-health issue. The risk remains that response infrastructure is still trying to catch up after confirmed U.S. cases and broader spread pressure from Mexico/Central America, while cattle supplies are already tight and beef prices elevated.
May NOPA crush came in 208.8 million bushels, missing the Bloomberg average estimate of 216.4 million and landing near the low end of expectations, which confirms that May maintenance downtime was heavier than the market was positioned for. The miss is bearish for nearby soybean usage versus expectations, but crush was still well above last year’s 192.8 million, so underlying demand remains strong. The more supportive piece was soybean oil stocks at 1.735 billion pounds, below the 1.868 billion estimate, showing oil supplies tightened more than expected despite the weaker crush. Overall, this is a mixed report: negative beans/meal from the crush miss, but supportive soybean oil because inventories were meaningfully below expectations.
Grain inspections were mixed but mostly steady, with corn still carrying the strongest big-picture export tone. Corn inspections eased to 1.637 MMT from 2.014 MMT last week, but marketing-year-to-date movement remains well ahead of last year at 65.6 MMT vs 52.1 MMT, keeping the export program supportive. Soybeans improved to 522,687 tons from 412,122 tons and were well above last year’s weekly pace, though season-to-date inspections remain behind last year. Wheat was slightly higher on the week at 334,292 tons, but still below last year, while sorghum was the clear standout at 313,614 tons, sharply higher than both last week and last year. Overall, corn remains the best demand story, soybeans showed a needed weekly improvement, wheat was neutral, and sorghum was the bullish surprise.
Crude oil has essentially come full circle. After months of geopolitical-driven volatility and periodic spikes tied to Middle East tensions, crude prices are now near where they were a year ago. The recent U.S.-Iran peace framework and expectations for the Strait of Hormuz to reopen have removed a significant portion of the risk premium from the market. For agriculture and biofuels, this means energy markets may begin trading less on headlines and more on supply, demand, and global economic fundamentals heading into the second half of the year.
May industrial production came in softer than expected, rising only 0.1% versus the 0.3% consensus, while factory output was unchanged on the month against expectations for a 0.3% gain. Capacity utilization matched expectations at 76.2%, up slightly from April’s 76.1%. The one supportive offset was that April industrial production was revised higher to 0.9% from 0.7%. Overall, the report points to a manufacturing sector that is not collapsing, but still struggling to build momentum, with May activity flatter than expected despite a stronger prior-month revision.
The June Empire State manufacturing report was softer than expected, with the headline factory index falling to 5.7 vs. 13.7 expected, signaling growth slowed sharply from May. The weak spot was new orders, which dropped to 3.5 from 22.7, suggesting demand momentum cooled meaningfully. Inflation signals were more mixed but still elevated, with prices received at 31.4 vs. 31.8 in May, showing firms are still passing through higher prices even if the pace eased slightly. The better piece was labor, with employment rising to 9.6 from 8.3, so companies are still adding workers despite the slower order flow. Overall, this is a softer growth read, not a collapse, but it leans mildly dovish for the Fed because demand cooled while price pressures remain sticky.
Corn
S 4000 u 420/390/360 put flies 7 1/2
B 1500 n 420 c 4 to 4 1/4
S 500 n 465 c 1/4
B 500 z 420/390 ps 9 ¼ vs 441
B 500 h 450p/470c strangles 47 1/2
B 500 nu -9 p vs s -6 c even
B 950 n 440 c 7/8 vs 415 3/4
S 200 h 430 p 14 1/4
B 1000 n 400 p 1 3/8 to 1 1/2
B 2000 z 460 c 18 ¾ vs 441 1/2
S 1000 sd u 480 c 7 1/2
B 100 z 445/480 cs 10 3/4
S 1000 sd q 450 c 11 7/8
B 500 z 460/510 cs 10 7/8 to 11
B 800 u 500 c vs s 1600 u 600 c 1 3/8 vs 423 3/4
S 1000 n 425 c 2 ½ to 2 3/8
S 750 n 420 p 12 ½ vs 410
B 2000 z 530 c 5 ¾ to 5 7/8
S 100 z 460 c 17 7/8 vs 440 1/2
S 2000 sd u 440 p 17 ½ to 17
B 4000 n 520 c 1/8
B 400 sd q 520 c 1 3/8 vs 436 1/2
B 2000 z 480/530 cs vs z 550 c 11 ½ db vs 445
B 2000 z 400 p 7 1/8
S 250 u 420 c 15 7/8 vs 415 3/4
S 1000 n 440 p 30 ¾ to 28 1/2
B 2000 q 460 c vs 417 ½ agianst s 2000 z 470 c vs 436 ½ collecting 10 1/8
S 500 z 490/530 cs 4 3/4
B 750 n 420 p 12 1/2
S 200 z 450/420 ps 16 7/8
S 100 sd n 460 c 1
On a block
B 850 h 540 c 7 1/8
B 900 u 390 p 5 1/8 vs 422 3/4
Beans
S 1000 x 1300 c 9 ¾ to 9 5/8 vs 1132 3/4
S 600 q 1110 p 20 ½
B 800 n 1100 c 13 to 14 1/8
B 200 q 1150 c 10 1/2
B 1000 n 1120 c 6 ¾ to 7 1/4
B 100 x 1260 c 12 1/2
S 500 n 1150 c 1
S 400 n 1110 c 9 ¼ to 9 1/8
B 800 n 1110 c 8 7/8 to 9
Soymeal
B 200 u 320/340 cs 2.45
S 900 n 300 p 3.25 to 3.10
B 300 n 300 p 3.25 vs 301.6
S 200 q 310 c 4.50
Bean oil
S 100 z 69 straddles 9.00
B 500 q 75/78 cs .625
S 400 q 70 p 1.690 to 1.625
B 1000 n 7450 c .620 to .740
S 500 z 60 p 1.365
B 475 q 70 p 1.690
B 150 n 72/75 cs 1.345
S 250 q 70 p 1.670 to 1.620
B 300 n 73 c 1.420 to 1.460
B 200 n 68 p .135 to .145
B 500 n 75 c .905
B 150 n 72/70 ps .290
On a block
B 1100 q 7350/78 cs 1.225 vs 7240
Wheat
S 2000 u 670/620/570 put flies 15 to 14 7/8
B 1000 z 590 p 29 ½
B 300 n 610 c 1 ¼ to 3
S 400 q 600 straddle 43 ½ to 43
B 750 w2 610/660 cs 10
B 3000 q 620/650 cs 5 to 6 1/4
S 500 n 600 c 2 ½ to 2 1/4
B 200 n 580 c 12 1/.8
Kc wheat
B 600 n 630/650 cs 7 1/8
S 600 n 630 c 8 ¾
Hogs
Sold 100 Aug 92 puts @ 1.70 down to 1.6750
Sold 600 July 93 puts @ .35
Sold 600 Dec 92 calls @ .50
Bought 150 Aug 104 calls paid .85
Bought 600 July 104 calls paid .10
Sold 900 Aug 108/104 put spread @ 3.50
Sold 175 Aug 121 calls @ .075
Bought 150 Oct 82 puts paid 5.15 up to 5.30
Bought 450 Oct 100 calls paid .425
Live Cattle
Sold 200 Oct 245 calls @ 3.975 down to 3.875
Bought 100 Aug 240/220 put spread paid 3.40 up to 3.425
Sold 300 Aug 236 puts @ 3.25 down to 3.225
Sold 125 Oct 2410 calls @ 5.625 down to 5.00
Bought 100 Aug 242/252 call spread paid 3.575
Feeder Cattle
Sold 100 Nov 390 calls @ 3.3750 covered 352.325 On a Block
|
Corn
| | | | | | | | | | |
|
Month
|
Futures
|
Change
|
Strike
|
Implied Vol
|
Change in IV
|
Futures Range
|
Implied BE
|
Realized BE
|
20D Historic Vol
|
Days to Exp
|
|
C N6
|
415.50
|
2.75
|
415
|
21.4
|
1.00
|
10.50
|
5.60
|
4.03
|
15.41
|
11
|
|
C Q6
|
422.75
|
2.00
|
425
|
27.6
|
0.90
|
10.00
|
7.35
|
3.89
|
14.61
|
39
|
|
C U6
|
422.75
|
2.00
|
425
|
25.6
|
0.60
|
10.00
|
6.82
|
3.89
|
14.61
|
67
|
|
C V6
|
441.75
|
1.50
|
440
|
23.1
|
0.50
|
9.50
|
6.43
|
3.80
|
13.65
|
102
|
|
C X6
|
441.75
|
1.50
|
440
|
22.7
|
0.60
|
9.50
|
6.32
|
3.80
|
13.65
|
130
|
|
C Z6
|
441.75
|
1.50
|
440
|
22.2
|
0.50
|
9.50
|
6.18
|
3.80
|
13.65
|
158
|
|
Beans
| | | | | | | | | | |
|
Month
|
Futures
|
Change
|
Strike
|
Implied Vol
|
Change in IV
|
Futures Range
|
Implied BE
|
Realized BE
|
20D Historic Vol
|
Days to Exp
|
|
S N6
|
1119.25
|
5.75
|
1120
|
14.1
|
0.70
|
17.25
|
9.94
|
8.10
|
11.49
|
11
|
|
S Q6
|
1123.50
|
4.75
|
1120
|
16.8
|
0.40
|
16.25
|
11.89
|
8.36
|
11.81
|
39
|
|
S U6
|
1121.75
|
4.00
|
1120
|
17.4
|
0.30
|
15.00
|
12.30
|
8.48
|
12.01
|
67
|
|
S V6
|
1134.75
|
2.75
|
1130
|
16.8
|
0.10
|
14.75
|
12.01
|
7.86
|
11.00
|
102
|
|
S X6
|
1134.75
|
2.75
|
1130
|
16.9
|
0.20
|
14.75
|
12.08
|
7.86
|
11.00
|
130
|
|
SRW Wheat
| | | | | | | | | | |
|
Month
|
Futures
|
Change
|
Strike
|
Implied Vol
|
Change in IV
|
Futures Range
|
Implied BE
|
Realized BE
|
20D Historic Vol
|
Days to Exp
|
|
W N6
|
589.75
|
5.25
|
590
|
24.8
|
1.20
|
20.00
|
9.21
|
6.36
|
17.11
|
11
|
|
W Q6
|
600.50
|
4.75
|
600
|
27.9
|
0.70
|
19.00
|
10.55
|
6.06
|
16.02
|
39
|
|
W U6
|
600.50
|
4.75
|
600
|
27.8
|
0.60
|
19.00
|
10.52
|
6.06
|
16.02
|
67
|
|
W V6
|
616.75
|
4.75
|
620
|
25.2
|
0.00
|
19.00
|
9.79
|
5.82
|
14.98
|
102
|
|
W Z6
|
616.75
|
4.75
|
615
|
25.7
|
0.10
|
19.00
|
9.98
|
5.82
|
14.98
|
158
|
|
HRW Wheat
| | | | | | | | | | |
|
Month
|
Futures
|
Change
|
Strike
|
Implied Vol
|
Change in IV
|
Futures Range
|
Implied BE
|
Realized BE
|
20D Historic Vol
|
Days to Exp
|
|
KWN6
|
640.00
|
5.50
|
640
|
25.1
|
1.30
|
20.50
|
10.12
|
6.49
|
16.10
|
11
|
|
KWQ6
|
645.25
|
4.50
|
645
|
27.4
|
0.70
|
18.50
|
11.14
|
5.91
|
14.53
|
39
|
|
KWU6
|
645.25
|
4.50
|
645
|
27.1
|
0.60
|
18.50
|
11.01
|
5.91
|
14.53
|
67
|
|
KWZ6
|
658.50
|
4.50
|
660
|
25.0
|
0.00
|
18.75
|
10.37
|
5.60
|
13.50
|
158
|
|
KWH7
|
669.25
|
3.75
|
670
|
23.9
|
-0.10
|
17.75
|
10.08
|
5.22
|
12.38
|
249
|
|
Bean Oil
| | | | | | | | | | |
|
Month
|
Futures
|
Change
|
Strike
|
Implied Vol
|
Change in IV
|
Futures Range
|
Implied BE
|
Realized BE
|
20D Historic Vol
|
Days to Exp
|
|
BON6
|
74.37
|
0.09
|
74.5
|
24.4
|
0.40
|
2.06
|
1.14
|
1.03
|
22.02
|
11
|
|
BOQ6
|
72.72
|
-0.14
|
72.5
|
25.1
|
-0.40
|
1.87
|
1.15
|
0.97
|
21.08
|
39
|
|
BOU6
|
71.26
|
-0.27
|
71.5
|
25.4
|
-0.50
|
1.69
|
1.14
|
0.91
|
20.36
|
67
|
|
BOV6
|
70.05
|
-0.33
|
70
|
25.3
|
-0.60
|
1.61
|
1.12
|
0.86
|
19.40
|
102
|
|
Meal
| | | | | | | | | | |
|
Month
|
Futures
|
Change
|
Strike
|
Implied Vol
|
Change in IV
|
Futures Range
|
Implied BE
|
Realized BE
|
20D Historic Vol
|
Days to Exp
|
|
SMN6
|
302.00
|
0.70
|
300
|
19.4
|
2.20
|
3.40
|
3.69
|
2.96
|
15.56
|
11
|
|
SMQ6
|
302.90
|
0.80
|
305
|
18.8
|
0.80
|
3.10
|
3.59
|
2.68
|
14.07
|
39
|
|
SMU6
|
303.10
|
0.90
|
305
|
18.7
|
0.50
|
3.30
|
3.57
|
2.33
|
12.21
|
67
|
|
SMV6
|
302.40
|
1.00
|
300
|
18.3
|
0.30
|
3.30
|
3.49
|
2.09
|
10.99
|
102
|
|
Lean Hogs
| | | | | | | | | | |
|
Month
|
Futures
|
Change
|
Strike
|
Implied Vol
|
Change in IV
|
Futures Range
|
Implied BE
|
Realized BE
|
20D Historic Vol
|
Days to Last Trade
|
|
LHN6
|
96.575
|
-0.875
|
96
|
13.7
|
-0.90
|
1.83
|
0.83
|
1.27
|
20.91
|
30
|
|
LHQ6
|
95.775
|
-0.575
|
96
|
20.5
|
-0.50
|
1.10
|
1.24
|
1.13
|
18.68
|
60
|
|
LHU6
|
80.225
|
-1.150
|
80
|
26.5
|
0.10
|
1.50
|
1.34
|
0.87
|
17.21
|
92
|
|
LHV6
|
80.225
|
-1.150
|
80
|
24.5
|
0.00
|
1.50
|
1.24
|
0.87
|
17.21
|
121
|
|
LHZ6
|
73.550
|
-1.050
|
74
|
23.3
|
0.10
|
1.47
|
1.08
|
0.78
|
16.79
|
182
|
|
Live Cattle
| | | | | | | | | | |
|
Month
|
Futures
|
Change
|
Strike
|
Implied Vol
|
Change in IV
|
Futures Range
|
Implied BE
|
Realized BE
|
20D Historic Vol
|
Days to Exp
|
|
LCN6
|
243.250
|
2.075
|
244
|
14.5
|
-0.20
|
2.55
|
2.22
|
2.66
|
17.36
|
17
|
|
LCQ6
|
243.250
|
2.075
|
244
|
14.3
|
-0.40
|
2.55
|
2.19
|
2.66
|
17.36
|
53
|
|
LCU6
|
236.800
|
3.000
|
236
|
14.8
|
-0.50
|
3.15
|
2.21
|
2.84
|
19.05
|
81
|
|
LCV6
|
236.800
|
3.000
|
236
|
14.8
|
-0.50
|
3.15
|
2.21
|
2.84
|
19.05
|
109
|
|
LCZ6
|
235.875
|
2.800
|
236
|
14.6
|
-0.40
|
3.07
|
2.17
|
2.74
|
18.47
|
172
|
|
Feeder Cattle
| | | | | | | | | | |
|
Month
|
Futures
|
Change
|
Strike
|
Implied Vol
|
Change in IV
|
Futures Range
|
Implied BE
|
Realized BE
|
20D Historic Vol
|
Days to Last Trade
|
|
FCQ6
|
361.550
|
4.125
|
362
|
14.9
|
-0.40
|
4.60
|
3.39
|
5.18
|
22.76
|
73
|
|
FCU6
|
359.525
|
4.975
|
360
|
15.8
|
-0.50
|
4.88
|
3.58
|
5.23
|
23.07
|
101
|
|
FCV6
|
356.100
|
5.175
|
356
|
16.6
|
-0.40
|
4.70
|
3.72
|
5.17
|
23.04
|
136
|
|
FCX6
|
352.425
|
5.250
|
352
|
16.9
|
-0.30
|
4.32
|
3.75
|
5.09
|
22.95
|
157
|
|
FCF7
|
345.850
|
5.275
|
346
|
16.9
|
-0.40
|
4.63
|
3.68
|
4.98
|
22.88
|
227
|
sources: vols bloomberg
This material should be construed as the solicitation of an account, order, and/or services and represents the opinions and viewpoints of the individual authors or presenters. It does not constitute an individualized recommendation or take into account the particular trading objectives, financial situations, or needs of individual customers.
The views are current only through the date stated and are subject to change at any time based upon market or other conditions, and StoneX Group Inc. (“SGI”) disclaims any responsibility to update such views. Actual results, performance, or achievements may differ materially from those expressed or implied. Information is based on data gathered from what we believe are reliable sources. Past performance does not guarantee future results.
The StoneX Group Inc. group of companies provides financial services worldwide through its subsidiaries, including physical commodities, securities, exchange-traded and over-the-counter derivatives, risk management, global payments and foreign exchange products in accordance with applicable law in the jurisdictions where services are provided.
References to certain OTC products or swaps are made on behalf of StoneX Markets, LLC (SXM), a member of the National Futures Association (NFA) and provisionally registered with the U.S. Commodity Futures Trading Commission (CFTC) as a swap dealer. SXM’s products are designed only for individuals or firms who qualify under CFTC rules as an ‘Eligible Contract Participant’ and who have been accepted as customers of SXM.
StoneX Financial Inc. (SFI) is a member of FINRA/NFA/SIPC and registered with the MSRB. SFI is registered with the U.S. Securities and Exchange Commission (SEC) as a Broker-Dealer and with the CFTC as a Futures Commission Merchant and Commodity Trading Advisor. StoneX Financial (Canada) Inc. (SFCI) is registered in Canada and is a member of CIRO and CIPF. References to certain securities trading are made on behalf of the BD Division of SFI and are intended only for an audience of institutional clients as defined by FINRA Rule 4512(c). References to certain exchange-traded futures and options are made on behalf of the FCM Division of SFI. Wealth Management is offered through SA Stone Wealth Management Inc., member FINRA/SIPC, and SA Stone Investment Advisors Inc., an SEC-registered investment advisor, both wholly owned subsidiaries of SGI.
R.J. O’Brien & Associates, LLC (RJO) is registered with the CFTC as a Futures Commission Merchant and is a member of NFA.
StoneX Financial Ltd (SFL) is registered in England and Wales, company no. 5616586. SFL is authorized and regulated by the Financial Conduct Authority (FCA) (registration number FRN:446717) to provide services to professional and eligible customers including: arrangement, execution and, where required, clearing derivative transactions in exchange traded futures and options. SFL is also authorized to engage in the arrangement and execution of transactions in certain OTC products, certain securities trading, precious metals trading and payment services to eligible customers. SFL is authorized and regulated by the FCA under the Payment Services Regulations 2017 for the provision of payment services. SFL is a category 1 ring-dealing member of the London Metal Exchange. In addition SFL also engages in other physically delivered commodities business and other general business activities which are unregulated and not required to be authorized by the FCA.
This communication is issued in the European Economic Area by StoneX Financial Europe GmbH (SFEG). StoneX is the trade name used by STONEX GROUP INC. and all its associated entities and subsidiaries. StoneX Financial Europe GmbH (“SFEG”) is a securities trading firm registered in Germany under Company No. HRB 80844.
StoneX Financial Pte Ltd (Co. Reg. No 201130598R) (“SFP”) is regulated by the Monetary Authority of Singapore and is a Capital Markets Service Licence holder (for dealing in capital market products), an Exempt Financial Adviser (for advising on investment products and issuing or promulgating analyses/ reports on investment products) and a Major Payment Institution (for domestic and cross-border money transfer services).
SFP may distribute analysis/report produced by its respective foreign affiliates within the StoneX Group of companies pursuant to an arrangement under Regulation 32C of the Financial Advisers Regulations Recipients should contact SFP at (65) 6309 1000 for any matters arising from, or in connection with, this webinar.
StoneX APAC Pte. Ltd. (“SAP”) (Co. Reg. No 200616676W) is regulated as a Dealer (PS20190001002) under the Precious Stones and Precious Metals (Prevention of Money Laundering and Terrorism Financing) Act 2019 for purposes of anti-money laundering and countering the financing of terrorism.
StoneX Financial (HK) Limited (CE No.: BCQ152) (“SHK”) is regulated by the Hong Kong Securities and Futures Commission for Dealing in Securities and Dealing in Futures Contracts.
StoneX Financial Pty Ltd (ACN 141 774 727) holds an Australian Financial Service License (AFSL: 345646) for Dealing in Securities, Exchange-Traded Derivatives Contracts, OTC Derivatives Contracts and Foreign Exchange Contracts, and is regulated by the Australian Securities and Investments Commission.
StoneX Securities Co., Ltd. (“SSJ”) (Co. Reg. No 010401047199) is regulated by the Japanese Financial Services Agency as a Type-I Financial Instruments Business Operator (Kanto Local Finance Bureau (FIBO)No.291’), is a member of the Financial Futures Association of Japan for dealing and broking FX and FX Option transactions, and is a member of the Japan Securities Dealers Association for dealing and broking stock indices and option transactions.
Trading swaps and over-the-counter derivatives, exchange-traded derivatives and options and securities involves substantial risk and is not suitable for all investors. Past performance of any futures or option is not indicative of future success. Indicators are not a trading system and are not published as a specific trade recommendation. The information herein is not a recommendation to trade nor investment research or an offer to buy or sell any derivative or security. It does not take into account your particular investment objectives, financial situation or needs and does not create a binding obligation on any of the StoneX group of companies to enter into any transaction with you. You are advised to perform an independent investigation of any transaction to determine whether any transaction is suitable for you. No part of this material may be copied, photocopied or duplicated in any form by any means or redistributed without the prior written consent of StoneX Group Inc.
The report/analysis herein is not directed to, or intended for distribution to or use by, any person or entity who is a citizen or resident of or located in any locality, state, country or other jurisdiction where such distribution, publication, availability or use would be contrary to law or regulation.
© 2026 StoneX Group Inc. All Rights Reserved.