
Daily Coffee Report 6/5/26
Daily coffee report
StoneX Coffee Team
- Coffee
By: CommodityNetwork Team - USA, CommodityNetwork USA

With 2025 in the rearview, StoneX and CoffeeNetwork revisited the global balance sheet using refreshed shipment, stock and domestic flow data across the main origins and consuming markets. As a result, we revised 2025 production to 166.5 million bags—up 2.2% versus our prior estimate—reflecting stronger-than-expected output in key producing regions and improved reconciliation between crop potential, export performance and on-the-ground availability signals. We also revised 2025 consumption higher to 166.2 million bags (+1.3%), as reviewed import flows and updated inflation and retail indicators pointed to demand holding up slightly better than initially assumed, despite elevated consumer prices across several major markets.
Taken together, these revisions lift the implied 2025 surplus to roughly 1.8 million bags, compared with the approximate 400,000-bag surplus we had previously estimated. While this is a meaningful change in the headline balance, it does not negate the broader story of tightness: the additional surplus is relatively modest against historically low and unevenly distributed inventories, and much of the “extra” coffee appears to have been absorbed through pipeline needs rather than building readily available stocks. In practical terms, 2025 looks less razor-thin than originally thought, but still leaves the market entering 2026 with limited buffer and heightened sensitivity to any disruption in Brazil or other key origins.
As the market shifts focus to crop year 2026, coffee remains shaped by the same forces that have driven volatility over the past year—only with higher stakes. Policy and compliance uncertainty continues around EUDR implementation and potential phase-ins, trade and tariff discussions remain fluid, and weather risk is still front and center as producing origins contend with shifting rainfall patterns and the potential for renewed climate disruptions. In this environment, where key assumptions can change quickly, timely, transparent data and reporting are more critical than ever. In this report, StoneX and CoffeeNetwork will provide comprehensive analysis of the global supply-and-demand picture with a sharper focus on the variables most likely to impact 2026 and beyond.
Our global supply-and-demand estimates are built from a comprehensive set of data and market-specific analyses across the industry’s key producing, exporting, and consuming regions. This approach supports a detailed assessment of the variables that will matter most into 2026, including production prospects, export capacity, stock dynamics, and domestic consumption trends.
In Europe, we built a detailed map of the coffee trade balance across every member state and across the main coffee categories consumed in the region. We carried out the same level of analysis for the United States, focusing on imports, available stock signals, and evolving consumption patterns. These regional assessments also incorporate timely indicators such as consumer price inflation and per-capita consumption to reflect the demand environment this year.
Together, this workstream consolidated a global view of stocks, production, and consumption and supports our projections for 2026.
Our 2026 estimates were built using primary data from StoneX in Brazil and interviews with coffee associations and other close sources in other main coffee producing countries, complemented by information from international organizations such as the USDA for other producing countries.
Between January and March, StoneX returned to the field in Brazil to evaluate the actual performance of the harvest and refine its estimates. StoneX’s first revision for Brazil’s 2026/27 coffee crop lifts production to a record 75.3m bags (+20.8% y/y), driven by recovery from last season’s weather damage and strong structural growth, particularly in robusta.
Arabica output is forecast at 50.2m bags (+37.5%), rebounding across Minas Gerais and São Paulo despite lingering losses from delayed rainfall and flower abortion that capped full yield potential, while robusta/conilon is seen at 25.1m bags (+2.8%), supported by area expansion, improved genetics and technology, with Rondônia likely posting a record crop. Improved rainfall from late 2025 into early 2026 and high prices sustaining farm investment underpinned the upward revision, though StoneX flags further adjustments may follow post‑harvest yield assessments. The full report can be accessed here: Brazil Coffee Crop Survey | 1st revision for 2026/27.
Coffee production in Brazil (million bags)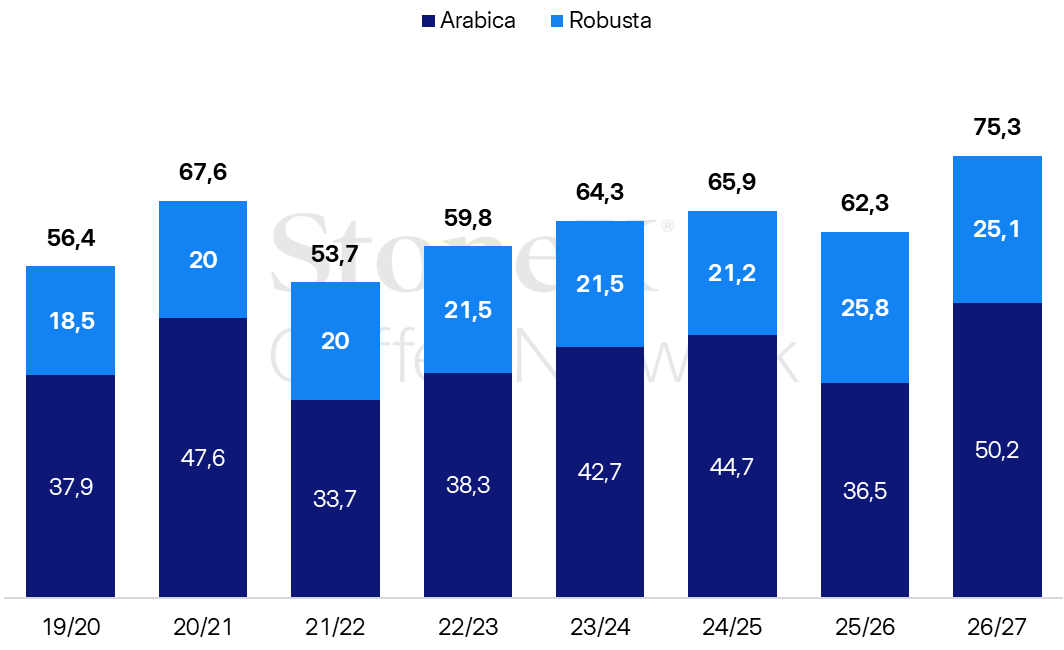
In Central America, production is expected slightly lower, with Costa Rica, Honduras and Guatemala all seeing smaller crops year on year. The declines, however, are not expected to be substantial with CoffeeNetwork estimating less than a 1% fall overall.
We expect Colombia’s crop to drop to around 12.6 million bags from the 13.5 million bags produced in the previous crop year.
In Africa, production increases in Uganda and Ivory Coast boosted the continent’s crop by 3.6% year-over-year.
While we expect some of the big producers in Asia, like Thailand, to see relatively flat production, Vietnam’s crop should recover from adverse weather in 2024/2025. Given more favorable conditions, a strong harvest, and assuming the country maintains the strong pace of exports observed since the start of the crop year (Oct. 2025), Vietnam’s supply could grow by nearly 10% that year.
Taking all of this into consideration, StoneX expects global production to be around 182.5 million bags, an increase of 9.6% from the 166.5 million bags produced in 2025 (based on our revised figures).
Global coffee stocks have entered a structurally tighter phase, marking a clear departure from the more comfortable inventory environment that characterized much of the past decade. Data spanning 2013 through 2026 shows a steady erosion of inventories across the world’s key producing and consuming regions, with the most pronounced tightening emerging after 2020. What once served as a reliable buffer against weather shocks, logistical disruptions, and demand swings has steadily thinned, leaving the market more exposed and potentially more volatile.
Brazil remains the undisputed anchor of global coffee inventories, but even its dominance underscores the current imbalance. Over the last decade, Brazilian stocks oscillated between roughly 15 million and 25 million bags, reflecting the natural rhythm of production cycles and biennial output. Peaks in the middle of the period gave way to sharper drawdowns in recent years, particularly between 2023 and 2025, when inventories fell below the long-term average. With a record crop incoming, however, the expectation is that Brazilian coffee inventories will see a significant jump and will remain on an upward trajectory. CoffeeNetwork estimates Brazilian coffee stocks could climb more than 5 million bags, following the 2026 harvest.
In consuming regions, the signal is even clearer. European inventories, typically the market’s shock absorber, show growing volatility rather than accumulation. After holding comfortably above 11 million bags through much of the mid-2010s, stocks fell sharply around 2018, rebounded briefly, and then resumed their downward drift. By the mid-2020s, European stocks were again trending near the lower end of their historical range, suggesting less willingness—or less ability—to carry surplus coffee in reserve. In 2026, however, the expectation is that green coffee stocks will steadily recover from the over 2 million bag decline observed from 2024 to 2025.
The United States green coffee stocks seemingly began their significant depletion by the end of 2022. Although there is no longer formal data provided by the Green Coffee Association, analysis provided by CoffeeNetwork and StoneX estimates that green coffee stocks in the US fell from over 6 million bags in 2022 to less than 1 million bags in 2025. For 2026, however, we see green coffee stocks to show a modest recovery.
Japan, traditionally conservative and disciplined in its stockholding approach, shows a gentler but persistent decline. While fluctuations remain limited, the longer-term trend points toward lower comfort levels relative to historical norms.
After four consecutive years of decrease in stocks through 2024 and a slight increase in 2025, CoffeeNetwork sees global coffee stocks rising from their level of around 38 million bags to exceeding 48 million bags in 2026.
Global coffee stocks (million bags)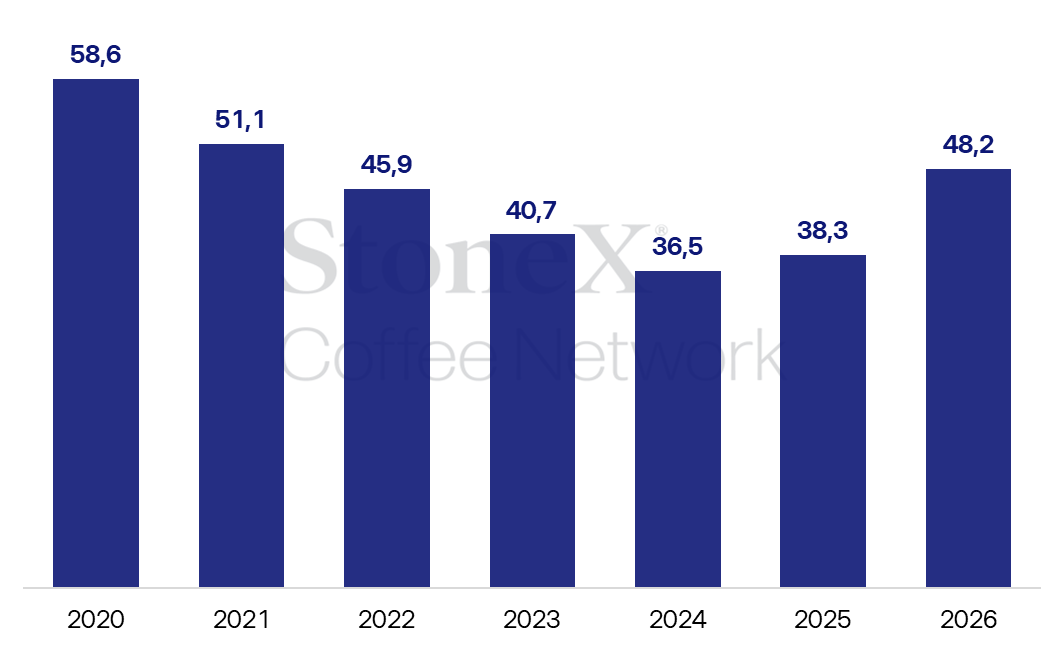
Global coffee consumption remained resilient but continued to show notable fluctuations across major markets. After growth in 2024, total consumption declined in 2025 by approximately 2.5%, reflecting the lingering impact of inflation, tighter consumer budgets, and slower economic growth across key regions. However, the data suggests a moderate recovery in 2026, with global consumption rising by roughly 2.5%, largely driven by improved demand in the United States, Brazil, Japan, and other emerging markets.
In the European Union, consumption declined in 2025. This contraction reflects sustained pressure on household spending and a cautious consumer environment. While 2026 shows a modest rebound, EU consumption remains below 2024 levels, indicating that demand recovery is gradual rather than robust.
The United States followed a similar trajectory. Reconciling 2025 import and export data against estimated availability implies per-capita consumption likely declined by around 3.0% year-over-year (roughly 2.7% in total consumption). With inflation easing and demand expected to stabilize, CoffeeNetwork assumes a modest normalization in 2026, with per-capita consumption recovering by approximately 3.0%—bringing usage back near 2024 levels and implying a 3.6% increase in total U.S. consumption. This recovery suggests renewed consumer engagement despite higher baseline prices, positioning the US as one of the more resilient mature markets in the current cycle.
In Brazil, consumption also softened in 2025, declining by roughly 2%, but is expected to show a strong rebound to near 2024 levels. This recovery indicates that while short-term demand was constrained, underlying structural consumption remains solid in the domestic market. consumption.
Japan mirrored Brazil’s pattern, with a clouse to 4% decline in 2025 followed by an expected 3% expansion in 2026, reinforcing the broader theme of temporary contraction followed by stabilization and recovery in 2026.
China remains the clear outlier on growth: import data shows two consecutive years of strong gains—up 616,000 bags (+24%) in 2024 and another 662,000 bags (+20.8%) in 2025—consistent with ongoing investment and rapid expansion across the domestic coffee landscape. For 2026, CoffeeNetwork assumes continued double-digit growth, with Chinese consumption rising in a 15% to 20% range, broadly in line with the trajectory implied by recent import momentum.
China monthly coffee imports (thousand bags)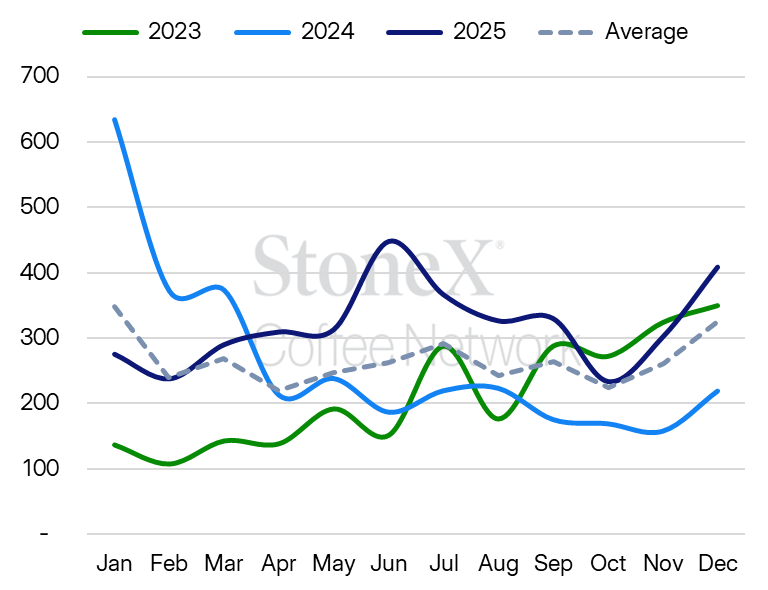
China annual coffee imports (million bags)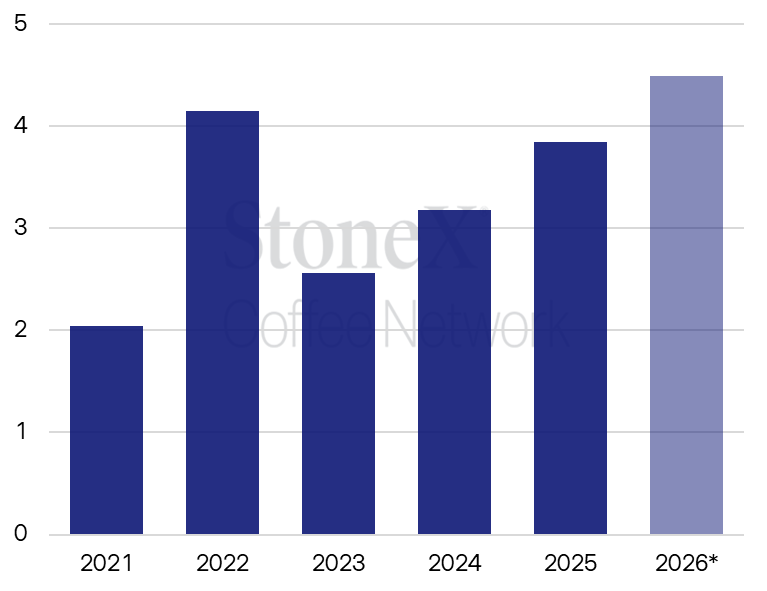
Consumption in other markets proved comparatively resilient, registering only a slight decline in 2025 (less than 1%) and accelerating by approximately 2.5% in 2026, contributing meaningfully to the overall global rebound.
Overall, the updated data suggests that while 2025 marked a cyclical low point for global coffee consumption, the outlook for 2026 is more constructive. Consumption growth is returning, though unevenly across regions.
Inflation has been slowing, but remains a key concern
Inflation will be a major factor in demand recovery for 2026. Coffee inflation in 2025 told a story of persistence rather than relief across the world’s major consuming and producing regions, with meaningful divergence only beginning to emerge at the very end of the year.
In Brazil, the epicenter of global coffee supply, inflation remained extreme for most of 2025. Annual coffee inflation surged above 80 percent by midyear as the market absorbed the aftershocks of earlier crop losses, logistics strain, and aggressive export demand. The second half of the year marked a turning point, with inflation easing steadily as supply expectations improved and market panic faded, but the year still ended with coffee prices roughly 35 percent higher than a year earlier. That deceleration mattered symbolically, yet in practical terms Brazil closed 2025 with coffee still dramatically more expensive than at any point in the past decade.
In the United States, the inflation picture was less volatile but arguably more stubborn. Throughout 2025, annual coffee inflation hovered above 30 percent, ending the year at roughly 34 percent. Unlike Brazil, where price pressure peaked and then retreated, U.S. inflation never experienced a sharp turning point. Instead, prices reflected delayed pass‑through from earlier global price spikes, compounded by higher labor, transport, and retail costs. Even as green coffee prices softened later in the year, U.S. consumer prices proved slow to respond, reinforcing the sense that coffee inflation had become structurally embedded rather than merely cyclical.
The euro area offered a comparatively calmer narrative. Coffee inflation there remained elevated throughout 2025 but followed a clearer downward slope. Prices rose at a slower pace than in Brazil or the U.S., finishing the year with annual inflation of about 18 percent. Stronger currency effects, weaker consumer demand, and faster adjustment at the retail level helped prevent the kind of runaway price dynamics seen elsewhere. While European consumers were still paying significantly more for coffee than in previous years, the direction of travel by late 2025 was clearly toward moderation.
This divergence became more pronounced in early 2026. In Brazil, annual inflation continued to retreat, with the worst of the inflationary surge appearing to be over. Still, coffee prices are likely to remain uncomfortably high for domestic consumers for some time before reaching more affordable levels, remaining highly sensitive to any new climate- or supply-related shocks.
The United States has finally begun to show more decisive relief. Annual coffee inflation dropped in the first two months of 2026 to near 30%, the lowest level in eight months. This marks the clearest evidence yet that the long‑delayed pass‑through of lower global prices is reaching store shelves, although prices remain far from normalized.
In the euro area, the normalization process continues steadily, with annual inflation gradually easing, signaling stabilization rather than volatility.
Consumer coffee inflation (12-month cumulative) 
Taken together, the trend points to 2026 as a year of adjustment rather than crisis. Brazil is expected to see inflation continue to slow gradually, assuming there are no major supply shocks. The U.S. outlook is also encouraging; if current trends hold, coffee inflation could fall into single digits by the end of the year as contracts reset and competitive pressure intensifies at retail. Europe appears on the smoothest path, with inflation likely settling in the mid‑single‑digit range over the same period.
Closely following the financials of major coffee companies can also offer a real-time read on demand. In its most recently reported quarter (fiscal Q1 2026, ended December 28, 2025), Starbucks reported global comparable store sales up 4%, driven by a 3% increase in comparable transactions and a 1% increase in average ticket. North America and U.S. comparable store sales also increased 4%, driven by a 3% increase in comparable transactions and a 1% increase in average ticket. International comparable store sales increased 5% (3% higher transactions; 2% higher ticket), and China comparable store sales increased 7% (5% higher transactions; 2% higher ticket).
JDE Peet’s latest full-year results (FY 2025) highlight both resilient top-line demand and continued cost pressure from green coffee. The company reported organic sales growth of 15.3% (driven by pricing, with volume/mix down), while organic adjusted EBIT increased 1.2% to €1.3 billion. Management noted that the operating environment remained volatile and challenging, citing unprecedented green coffee inflation, and reiterated actions to mitigate cost pressure through productivity initiatives and selective pricing while aiming to maintain affordability for consumers.
In China, growth remained more robust. JDE Peet’s has continued to point to strong momentum at Peet’s China, supporting the broader view that specialty demand in the market is still expanding. Luckin Coffee’s most recent release (Q4 and full-year 2025) underscores that trajectory: total net revenues rose 32.9% year-over-year in Q4 2025 to RMB 12.8 billion, while full-year 2025 total net revenues increased 43.0% year-over-year to RMB 49.3 billion. Luckin reported 1,834 net new store openings in Q4 and 8,708 net new store openings in full-year 2025, ending the year with 31,048 stores.
Based on our analysis, global consumption is pegged at 172.5 million bags, up 2.5% from the revised estimate of 168.3 million bags for 2025.
The stocks-to-use ratio helps frame just how tight—or comfortable—the market buffer is by comparing ending stocks to annual usage (consumption). As shown in the chart, CoffeeNetwork sees the ratio falling steadily from 35.8% in 2020 to 29.5% in 2021, 27.3% in 2022, 23.8% in 2023, and a cycle low of 21.0% in 2024, before edging higher to 22.8% in 2025. For 2026, the ratio is projected to rebound to 28.0%—the highest level since 2022—reflecting our expectation that the projected 2026 surplus allows inventories to rebuild meaningfully from depleted levels. Even so, the multi-year decline prior to 2026 underscores why the market has remained highly sensitive to supply shocks: the recovery begins from a historically tight base, and the distribution of stocks across origins and consuming regions remains a key watchpoint.
Our updated outlook points to a more comfortable global balance in 2026, with production forecast to rise to 182.5 million bags and consumption recovering to 172.5 million bags, allowing stocks to rebuild from historically tight levels to above 48 million bags. Even with a larger headline surplus, the market is unlikely to feel “well supplied” immediately: inventories remain unevenly distributed, and the path to normalization depends heavily on Brazil’s crop performance through post-harvest yield confirmation, alongside weather developments in other origins.
On the demand side, easing inflation should support a gradual recovery, but consumers remain sensitive to price and macro uncertainty. Against a backdrop of evolving regulation (including EUDR), trade policy and logistics risk amid ongoing geopolitical tensions, 2026 should be viewed as a transition year—one where improved supply prospects reduce tail-risk, but where vigilance remains essential as small shocks could still translate quickly into volatility.
Global Coffee Supply & Demand (million bags)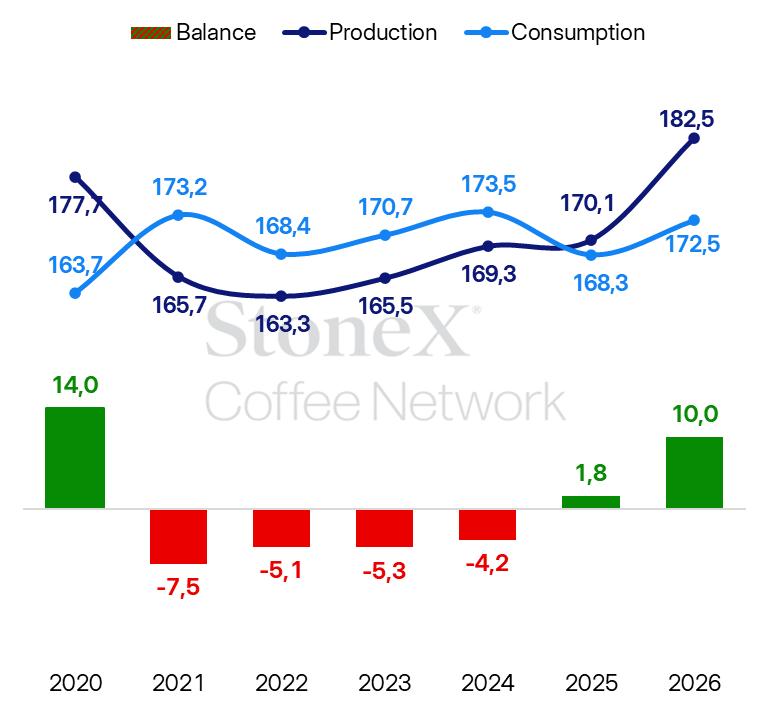
Global stocks and stock to use ratio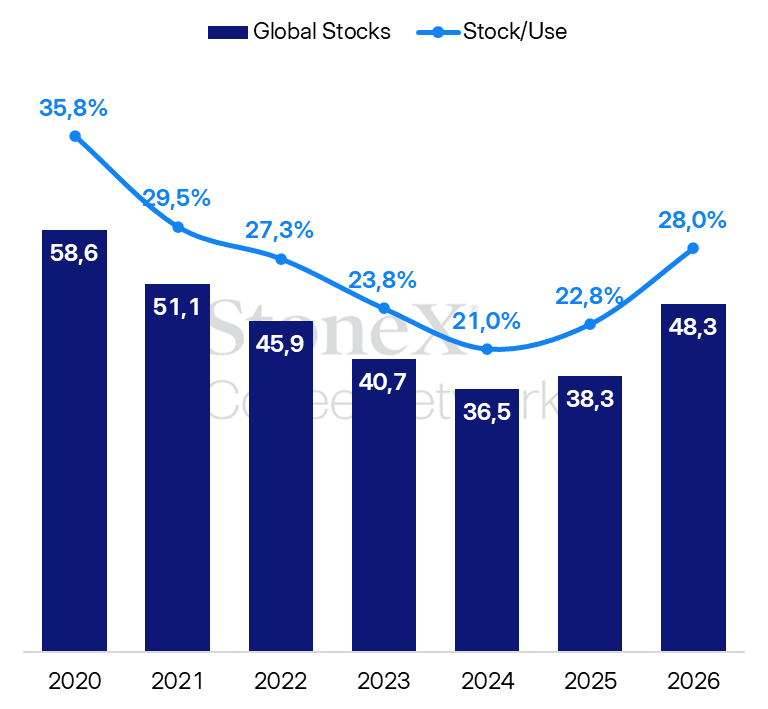
This material should be construed as market commentary and represents the opinions and viewpoints of the author, and does not reflect tailored advice associated with any specific account.
The views are current only through the date stated and are subject to change at any time based upon market or other conditions, and StoneX Group Inc. (“SGI”) disclaims any responsibility to update such views. Actual results, performance, or achievements may differ materially from those expressed or implied. Information is based on data gathered from what we believe are reliable sources. Past performance does not guarantee future results.
The StoneX Group Inc. group of companies provides financial services worldwide through its subsidiaries, including physical commodities, securities, exchange-traded and over-the-counter derivatives, risk management, global payments and foreign exchange products in accordance with applicable law in the jurisdictions where services are provided.
References to certain OTC products or swaps are made on behalf of StoneX Markets, LLC (SXM), a member of the National Futures Association (NFA) and provisionally registered with the U.S. Commodity Futures Trading Commission (CFTC) as a swap dealer. SXM’s products are designed only for individuals or firms who qualify under CFTC rules as an ‘Eligible Contract Participant’ and who have been accepted as customers of SXM.
StoneX Financial Inc. (SFI) is a member of FINRA/NFA/SIPC and registered with the MSRB. SFI is registered with the U.S. Securities and Exchange Commission (SEC) as a Broker-Dealer and with the CFTC as a Futures Commission Merchant and Commodity Trading Advisor. StoneX Financial (Canada) Inc. (SFCI) is registered in Canada and is a member of CIRO and CIPF. References to certain securities trading are made on behalf of the BD Division of SFI and are intended only for an audience of institutional clients as defined by FINRA Rule 4512(c). References to certain exchange-traded futures and options are made on behalf of the FCM Division of SFI. Wealth Management is offered through SA Stone Wealth Management Inc., member FINRA/SIPC, and SA Stone Investment Advisors Inc., an SEC-registered investment advisor, both wholly owned subsidiaries of SGI.
R.J. O’Brien & Associates, LLC (RJO) is registered with the CFTC as a Futures Commission Merchant and is a member of NFA.
StoneX Financial Ltd (SFL) is registered in England and Wales, company no. 5616586. SFL is authorized and regulated by the Financial Conduct Authority (FCA) (registration number FRN:446717) to provide services to professional and eligible customers including: arrangement, execution and, where required, clearing derivative transactions in exchange traded futures and options. SFL is also authorized to engage in the arrangement and execution of transactions in certain OTC products, certain securities trading, precious metals trading and payment services to eligible customers. SFL is authorized and regulated by the FCA under the Payment Services Regulations 2017 for the provision of payment services. SFL is a category 1 ring-dealing member of the London Metal Exchange. In addition SFL also engages in other physically delivered commodities business and other general business activities which are unregulated and not required to be authorized by the FCA.
This communication is issued in the European Economic Area by StoneX Financial Europe GmbH (SFEG). StoneX is the trade name used by STONEX GROUP INC. and all its associated entities and subsidiaries. StoneX Financial Europe GmbH (“SFEG”) is a securities trading firm registered in Germany under Company No. HRB 80844.
StoneX Financial Pte Ltd (Co. Reg. No 201130598R) (“SFP”) is regulated by the Monetary Authority of Singapore and is a Capital Markets Service Licence holder (for dealing in capital market products), an Exempt Financial Adviser (for advising on investment products and issuing or promulgating analyses/ reports on investment products) and a Major Payment Institution (for domestic and cross-border money transfer services).
SFP may distribute analysis/report produced by its respective foreign affiliates within the StoneX Group of companies pursuant to an arrangement under Regulation 32C of the Financial Advisers Regulations Recipients should contact SFP at (65) 6309 1000 for any matters arising from, or in connection with, this webinar.
StoneX APAC Pte. Ltd. (“SAP”) (Co. Reg. No 200616676W) is regulated as a Dealer (PS20190001002) under the Precious Stones and Precious Metals (Prevention of Money Laundering and Terrorism Financing) Act 2019 for purposes of anti-money laundering and countering the financing of terrorism.
StoneX Financial (HK) Limited (CE No.: BCQ152) (“SHK”) is regulated by the Hong Kong Securities and Futures Commission for Dealing in Securities and Dealing in Futures Contracts.
StoneX Financial Pty Ltd (ACN 141 774 727) holds an Australian Financial Service License (AFSL: 345646) for Dealing in Securities, Exchange-Traded Derivatives Contracts, OTC Derivatives Contracts and Foreign Exchange Contracts, and is regulated by the Australian Securities and Investments Commission.
StoneX Securities Co., Ltd. (“SSJ”) (Co. Reg. No 010401047199) is regulated by the Japanese Financial Services Agency as a Type-I Financial Instruments Business Operator (Kanto Local Finance Bureau (FIBO)No.291’), is a member of the Financial Futures Association of Japan for dealing and broking FX and FX Option transactions, and is a member of the Japan Securities Dealers Association for dealing and broking stock indices and option transactions.
Trading swaps and over-the-counter derivatives, exchange-traded derivatives and options and securities involves substantial risk and is not suitable for all investors. Past performance of any futures or option is not indicative of future success. Indicators are not a trading system and are not published as a specific trade recommendation. The information herein is not a recommendation to trade nor investment research or an offer to buy or sell any derivative or security. It does not take into account your particular investment objectives, financial situation or needs and does not create a binding obligation on any of the StoneX group of companies to enter into any transaction with you. You are advised to perform an independent investigation of any transaction to determine whether any transaction is suitable for you. No part of this material may be copied, photocopied or duplicated in any form by any means or redistributed without the prior written consent of StoneX Group Inc.
The report/analysis herein is not directed to, or intended for distribution to or use by, any person or entity who is a citizen or resident of or located in any locality, state, country or other jurisdiction where such distribution, publication, availability or use would be contrary to law or regulation.
© 2026 StoneX Group Inc. All Rights Reserved.
Our subscribers have access to comprehensive market analysis from StoneX spanning commodities, equities, currencies and more.
Daily coffee report
Weekly CFTC Report on the Softs and Metals Sectors


Today's commodity market news and analysis/advisory guidance.

Our market expertise, advanced platforms, global reach, culture of full transparency and commitment to our clients’ success all set us apart in the financial marketplace.
Reach
With access to 40+ derivatives exchanges, 180+ foreign exchange markets, nearly every global securities marketplace and numerous bi-lateral liquidity venues, StoneX’s digital network and deep relationships can take clients anywhere they want to go.
Transparency
As a publicly traded company meeting the highest standards of regulatory compliance in the markets we serve; our financials and record of accomplishment are matters of public record. StoneX’s commitment to “doing the right thing over the easy thing” sets us apart in the industry and helps us build respect, client trust and new partnerships.
Expertise
From our proprietary Market Intelligence platform, to “boots on the ground” expertise from award-winning traders and professionals, we connect our clients directly to actionable insights they can use to make more informed decisions and achieve their goals in the global markets.