Coffee market opens the week higher amid frost reports in Brazil
Translation generated by AI
• Coffee market rises with frost in Brazilian producing regions
• Temperatures were lower than forecasted by weather models
• Flowering may be impacted even without visible frost
• Arabica and robusta rise in the Brazilian physical market
• Colombian production grows 18% in July, according to local federation
• Vietnam exports below historical average for July
• Brazilian harvest reaches 93.2% as of August 11
• Regular rainfall will be crucial for flowering development
• Tariff negotiations between Brazil and the US remain on the radar
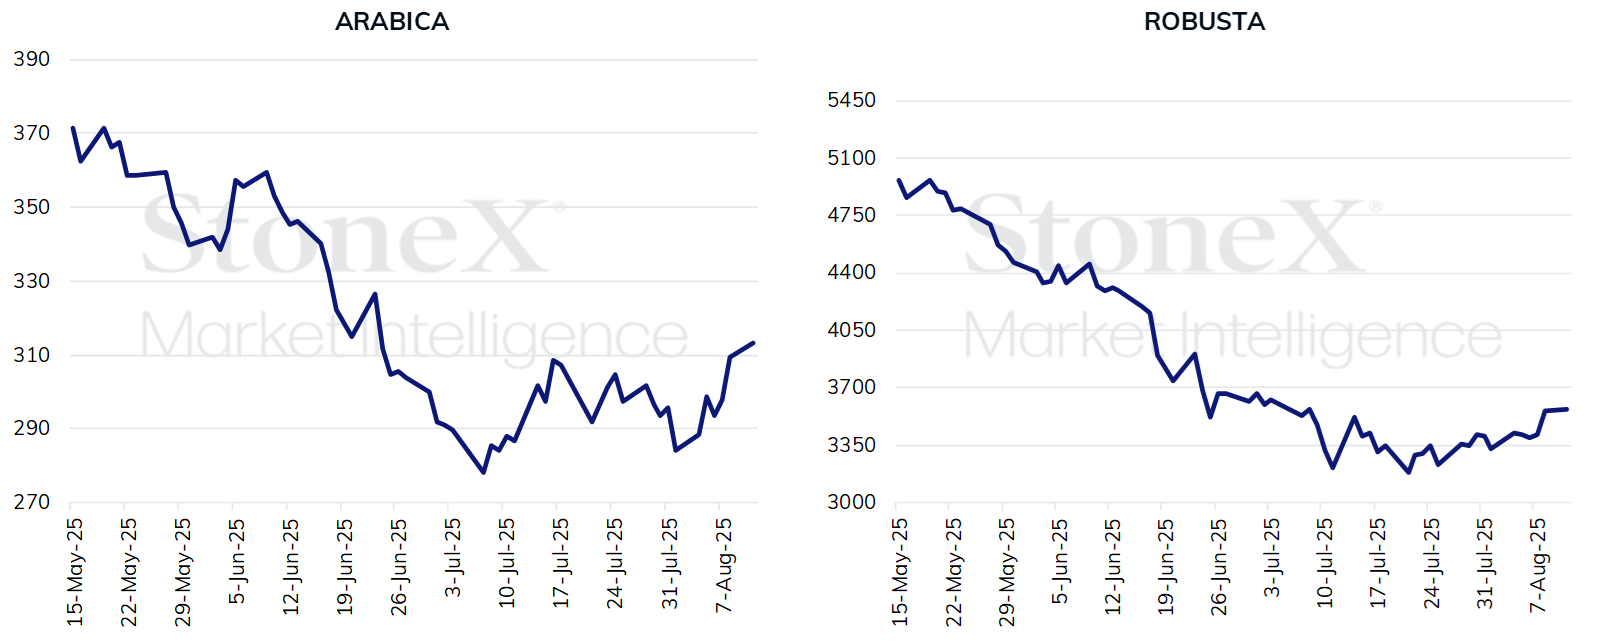
Futures prices for coffee started the week sharply higher, driven by reports of frost in important producing regions of Brazil. At market close, the most active contract on the New York Stock Exchange ended the session up 1,160 points, a 3.84% gain, quoted at US¢ 314.05 per pound. In London, contracts also closed in positive territory, rising by 154 dollars per ton, or 4.39%, to US$ 3,664 per ton.
This significant price increase is directly associated with the confirmed occurrence of frost in areas of Minas Gerais and Alta Mogiana. The possibility of this weather event had already been discussed since the previous week, when weather models began to indicate a sharp drop in temperatures across much of Brazil’s coffee belt.
The forecast indicated the arrival of a polar air mass, which was confirmed but proved to be stronger than initially predicted. While the European model, for instance, estimated minimum temperatures around 8 degrees Celsius in regions such as Patrocínio, in the Cerrado Mineiro, data from weather stations of the National Institute of Meteorology (INMET) showed significantly lower temperatures, with frost formation in several municipalities.
Frost occurrences were confirmed in cities such as Patrocínio, Uberaba, Sacramento, Ituverava, Passos, Bambuí, Monte Verde, and Campos do Jordão. In addition to these records, there were also reports of frost in coffee areas of several municipalities in the Cerrado Mineiro, including Araguari, Monte Carmelo, Sacramento, Araxá, Serra do Salitre, Indianópolis, Ibiá, and Campos Altos, as well as in specific regions of Alta Mogiana. Although it is still too early to accurately estimate the impact of this event on crops, everything indicates that the frost occurred in a localized manner, affecting specific areas within the affected municipalities.
Maps from INMET weather stations show the minimum temperature records on 08/11/2025, highlighting the areas where frost was confirmed. The black regions indicate coffee-growing zones in Minas Gerais.
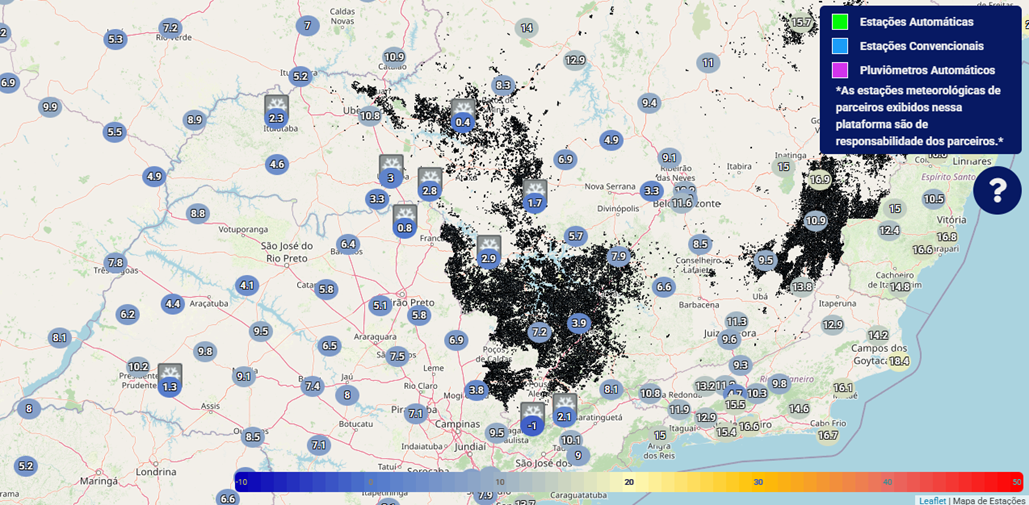
Source: INMET.
The StoneX team continues to closely monitor the situation and will send representatives to the affected areas for technical assessment. Further updates will soon be available on the StoneX Market Intelligence Portal. It is also worth noting that even in regions where frost did not form, the exposure of flower buds to very low temperatures may impair the development of flowering, negatively impacting the next crop.
Another point of concern is the timing of the event. As in 2024, this year’s frost was also recorded in the first half of August, which is atypical. Historically, most frost episodes in coffee regions occur in July. The presence of this phenomenon in August is considered unusual and reinforces the exceptional nature of this year’s event.
In the coming days, weather forecasts continue to indicate the risk of new temperature drops. Models suggest that municipalities in the Cerrado Mineiro, southern Minas Gerais, São Paulo’s countryside, and Paraná may still face very low minimum temperatures. According to the European model, cities in the Cerrado Mineiro may register lows close to 8.5°C. In southern Minas, municipalities such as Alfenas may see minimums of up to 6.4°C, while in the Alta Mogiana region, in São Paulo’s interior, minimums around 7°C are expected. In Paraná, minimums may reach 4°C.
Although the forecasted temperatures are, in theory, above the critical level for frost formation, it is important to remember that on the night of August 11 the models had also indicated similar values, yet the polar mass proved more intense than expected, resulting in sharper temperature drops and frost formation in several locations.
The StoneX team remains attentive to this situation and will continue on-site monitoring in the producing areas to identify possible production impacts. The objective is to assess not only the immediate crop damage but also the potential effects on flowering, whose formation and development depend on suitable weather conditions over the next few weeks.
Last week, prices rose amid tariff uncertainty
In the previous week, coffee futures prices had already shown strong gains. In New York, the most active contract rose 2,490 points during the week, a 9% increase, ending the period at US¢ 302.45 per pound. In London, contracts rose 251 dollars per ton, a 7.7% gain, closing at US$ 3,510 per ton.
This positive movement was also influenced by the depreciation of the dollar against the real, which fell 1.9% during the week, ending Friday at R$ 5.43. In the Brazilian physical market, prices also rose, albeit with less intensity. The Cepea indicator for arabica coffee showed a weekly increase of 2.4%, approaching R$ 1,815 per bag. The robusta indicator rose 2.1%, reaching just over R$ 1,051 per bag.
The scenario of uncertainty regarding the tariffs imposed by the United States remains one of the main sources of market tension. So far, coffee remains on the list of products subject to the 50% surcharge announced by the U.S. government. In addition, technical factors such as the rollover of positions by index funds contributed to increased volatility in international exchanges.
Arabica and robusta coffee futures prices (US¢/lb and USD/ton)
Source: Cmdty View. Prepared by: StoneX.
Colombian production and Vietnam exports
On the international front, the latest data show an increase in Colombia’s coffee production and a partial recovery in Vietnam’s exports. According to information from the Colombian National Federation of Coffee Growers, the country’s coffee production reached 1.37 million bags in July, an 18% increase compared to the same month last year, and more than 50% growth compared to the previous month, June. From January to July, total production reached almost 7.6 million bags, representing an 8.7% increase over the same period in 2024.
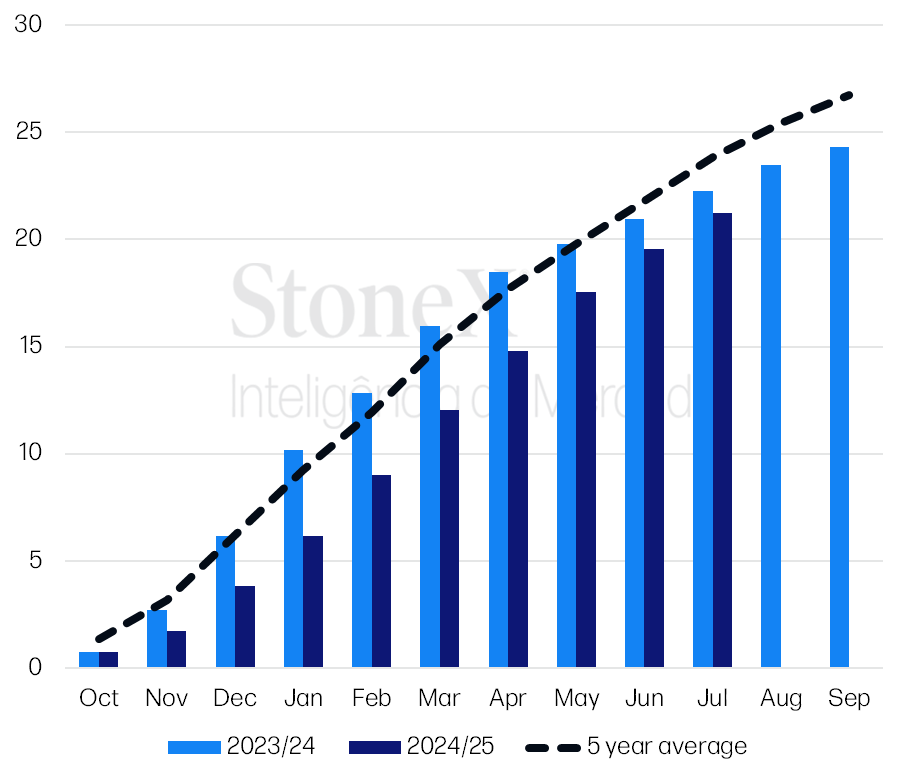
In Vietnam, official data show that the country exported 1.7 million bags of coffee in July. Although this represents a 14% decrease compared to the previous month, there was a significant increase of 32.5% compared to July 2024. Nevertheless, the volume exported remains 17.9% below the five-year average for July. In the 2024/25 crop year, from October to July, Vietnamese exports totaled 21.25 million bags, a 4.5% drop compared to the same period of the previous cycle.
Vietnam coffee exports evolution: seasonal (left) and crop-year-to-date (right)
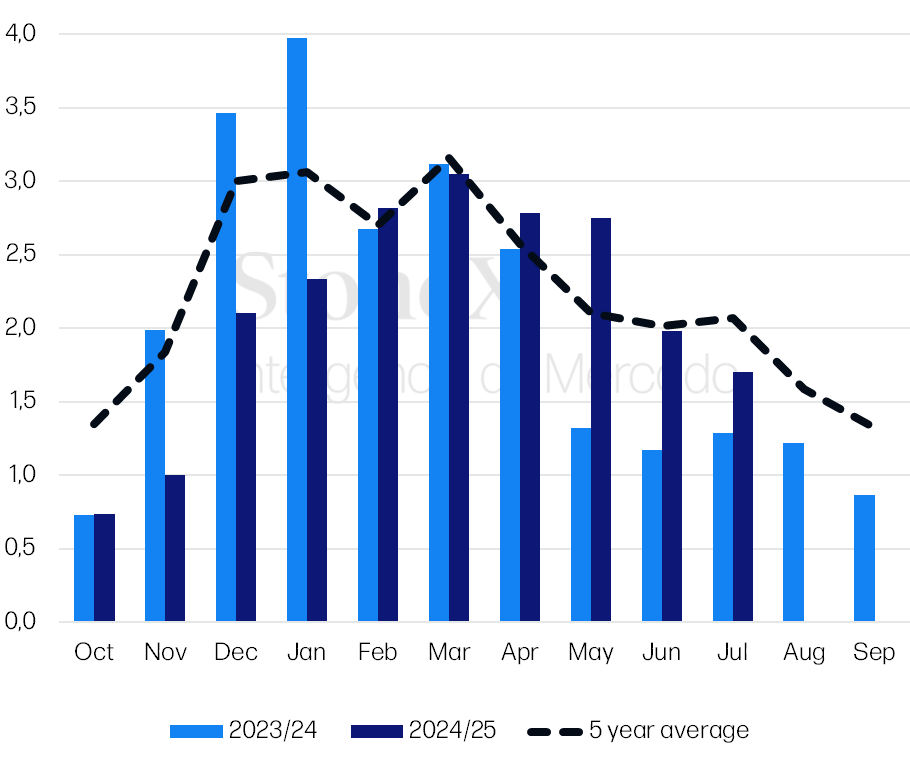
Source: Vietnam Customs. Prepared by: StoneX.
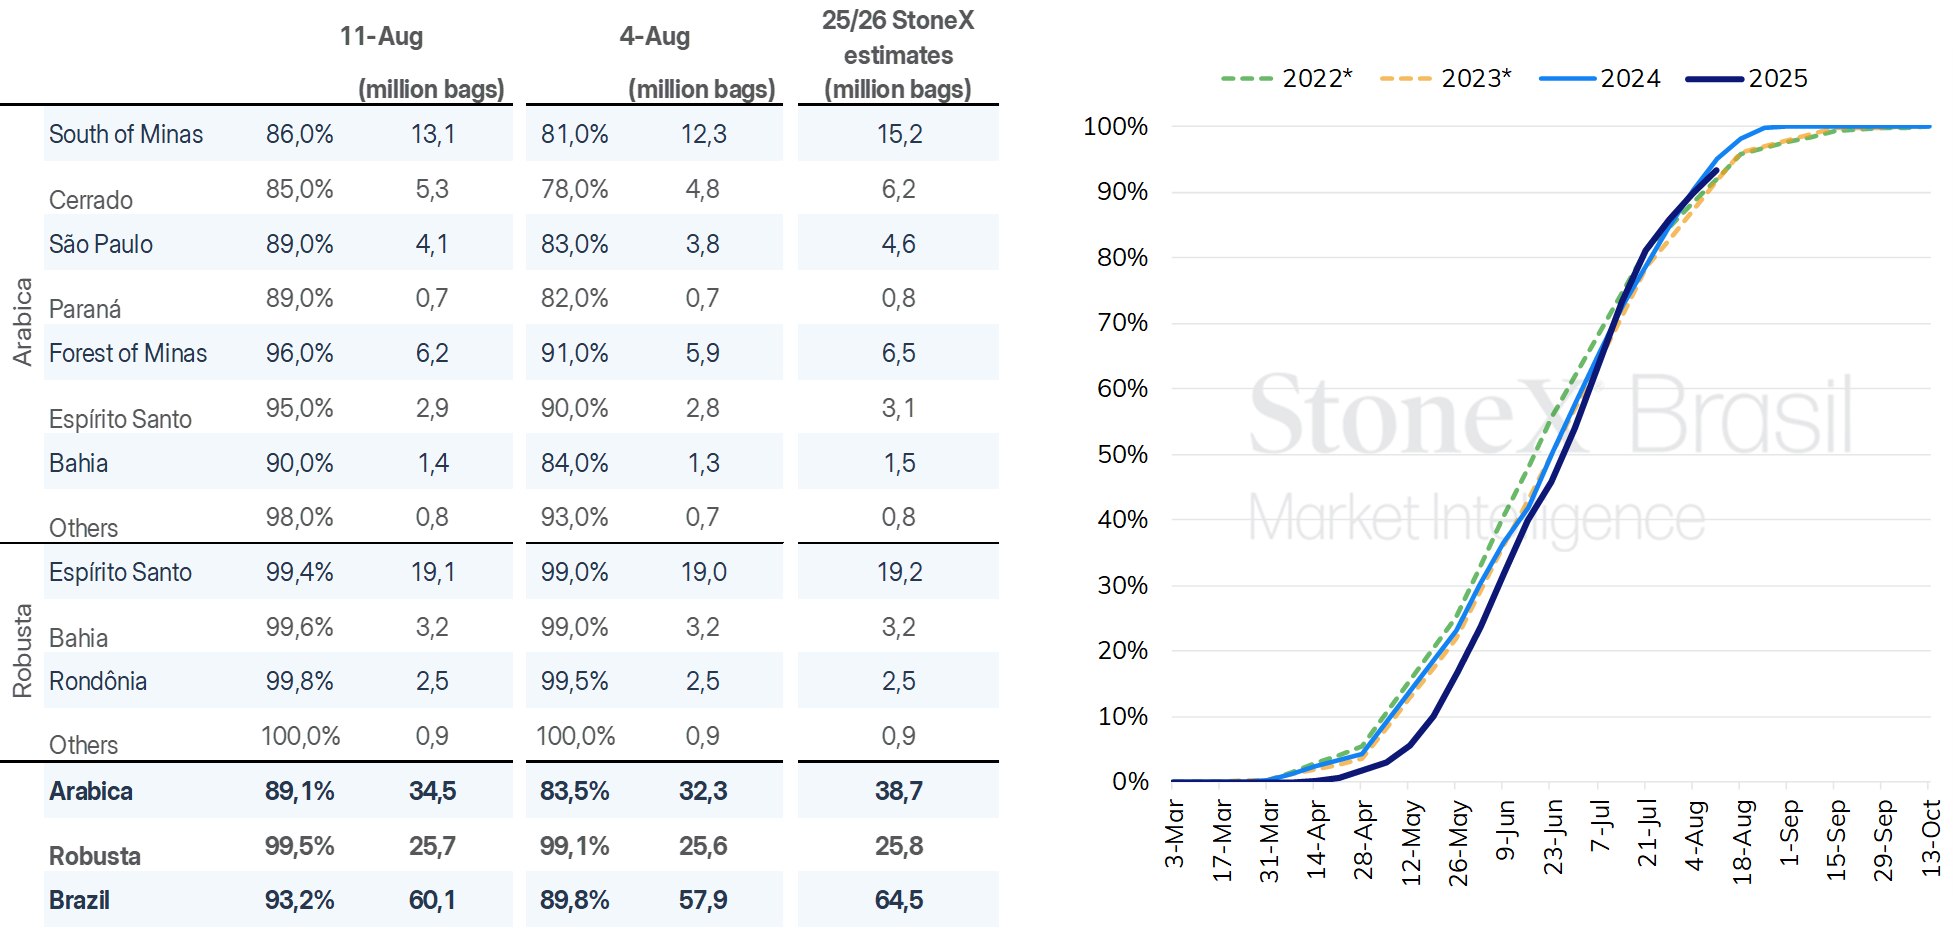
Regarding the Brazilian harvest, StoneX data indicate that as of August 11, the total harvest in the country reached 93.2%. The robusta harvest is practically complete, with 99.5% finished. For arabica, harvesting progressed to just over 89% of the total estimated. Among the main arabica-producing regions, the Cerrado Mineiro stands out, with approximately 85% harvested. In the Matas de Minas and southern Espírito Santo regions, the percentage harvested already exceeds 95%.
Coffee harvest progress in Brazil
Source: StoneX.
Outlook for the coming weeks
In the coming weeks, the market will continue to monitor closely the effects of the recent frosts and the weather conditions in the main producing regions. Beyond the observed minimum temperatures, the occurrence of regular rainfall will be essential for proper flowering development.
The market will also pay close attention to the release of Brazil’s official export data by Cecafé, as well as potential progress in negotiations between the Brazilian and U.S. governments regarding tariffs on Brazilian coffee exports to the United States.
INDICATORS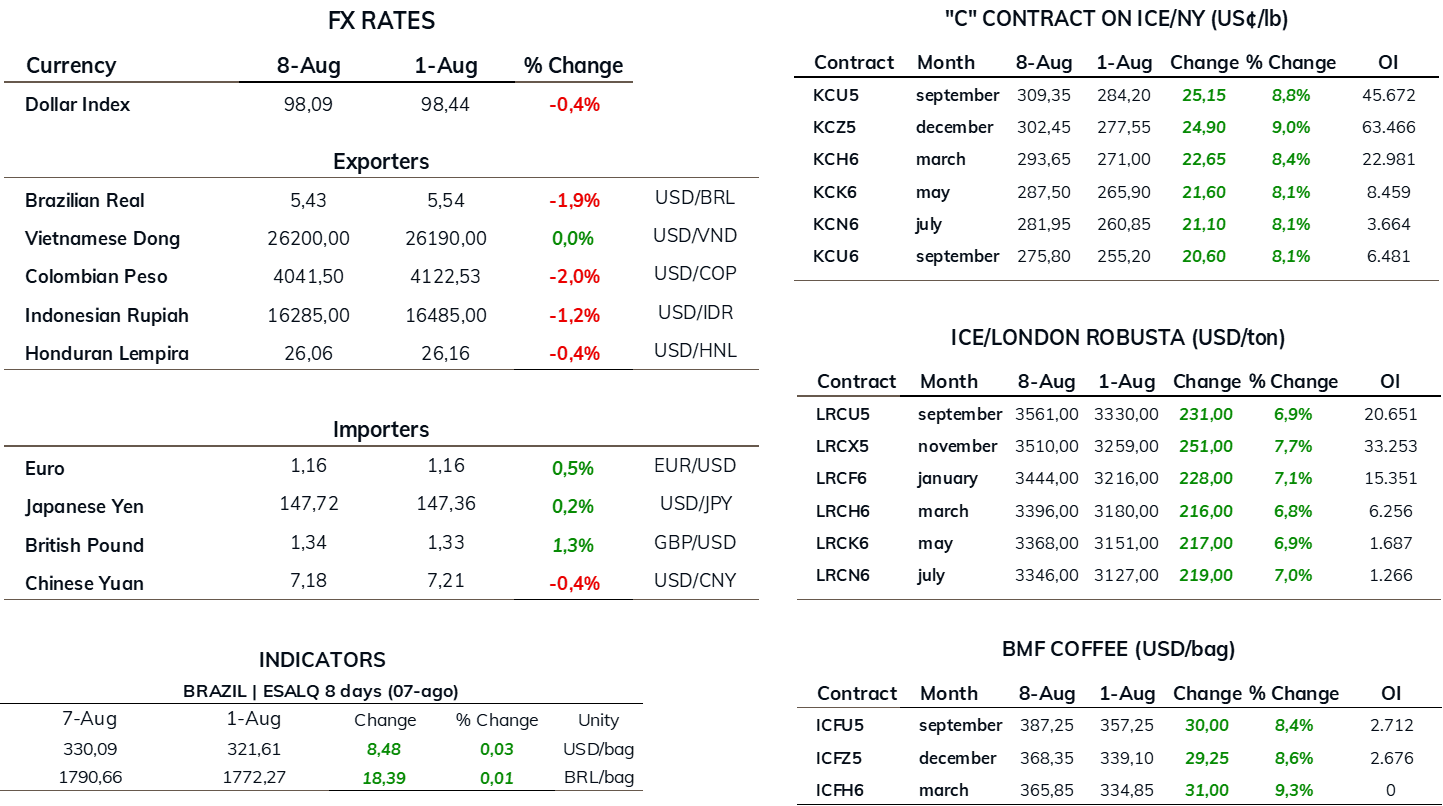
Sources: ICE/NY; ICE/EU; B3; Commodity Network Trader’s Pro.