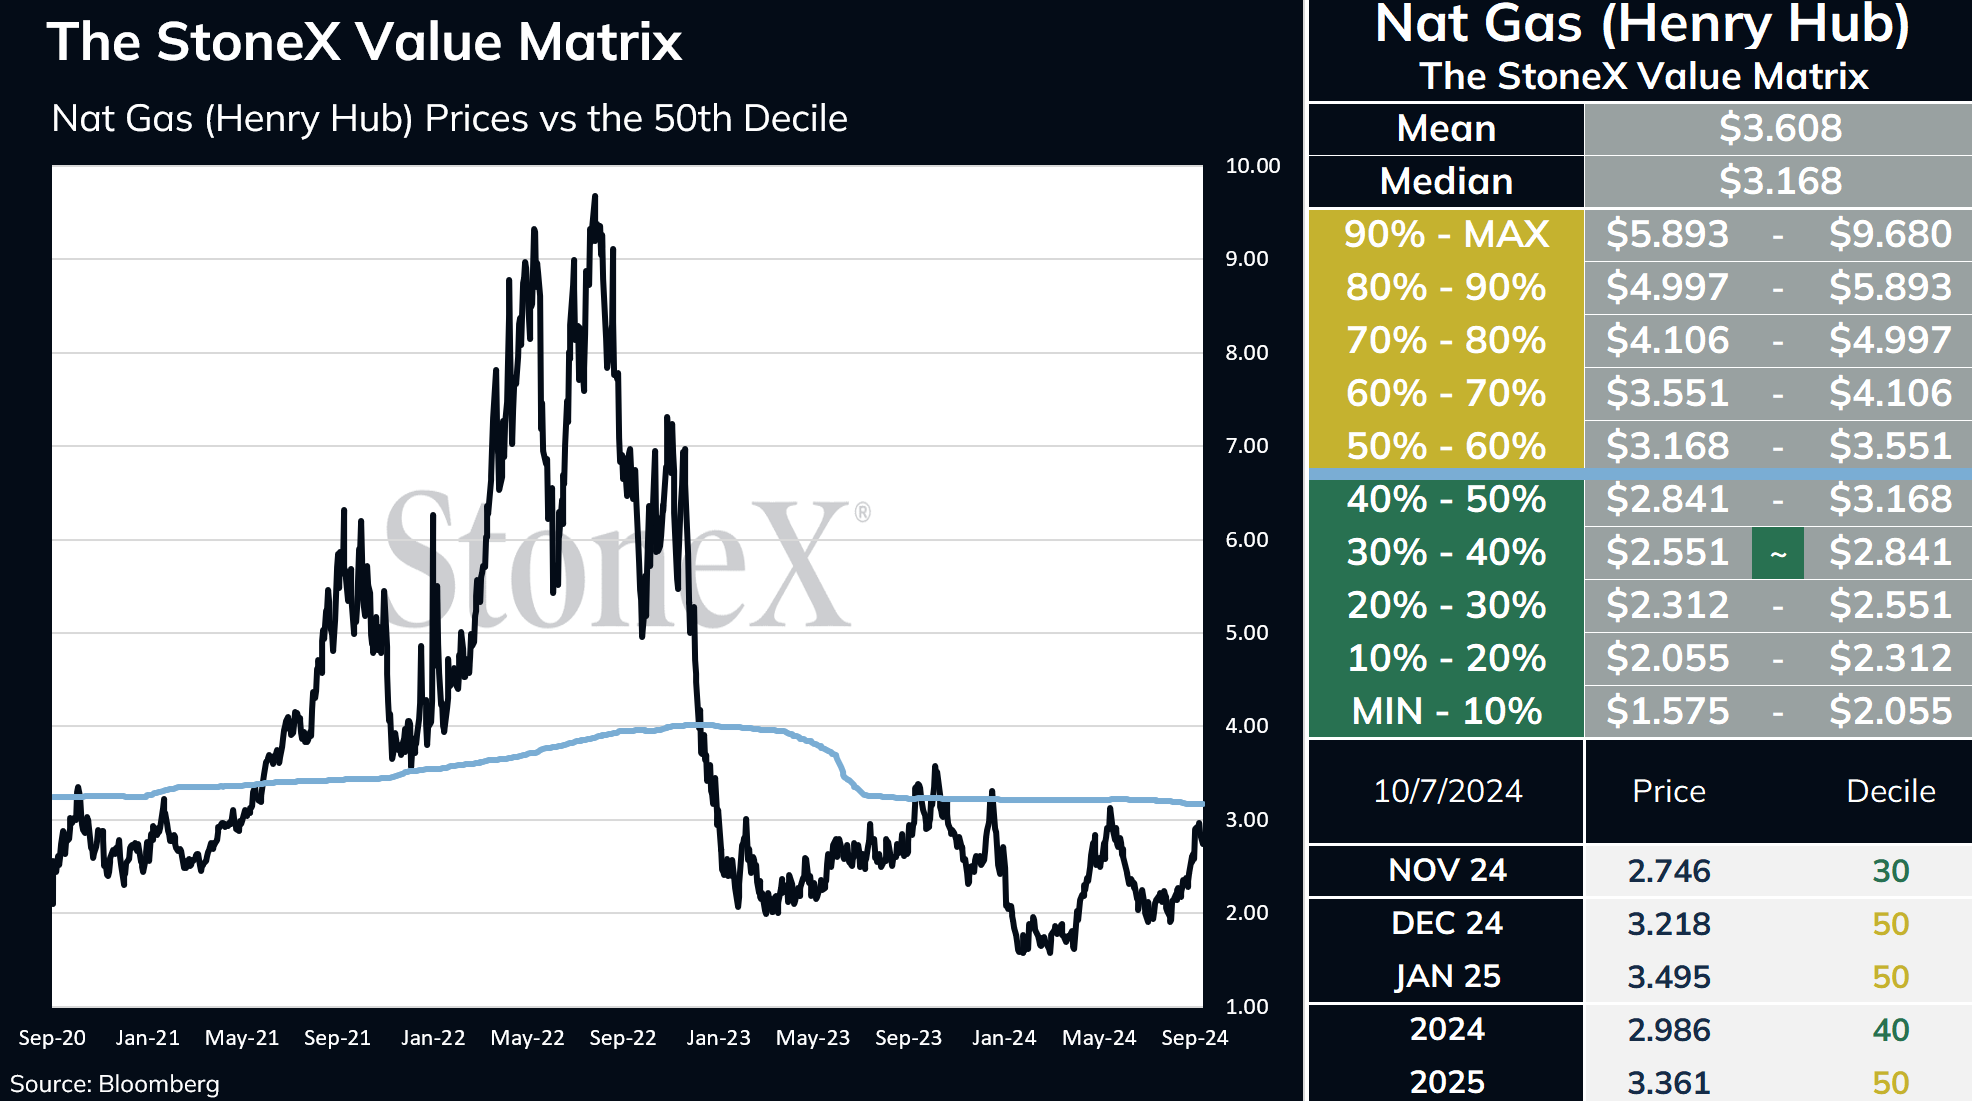
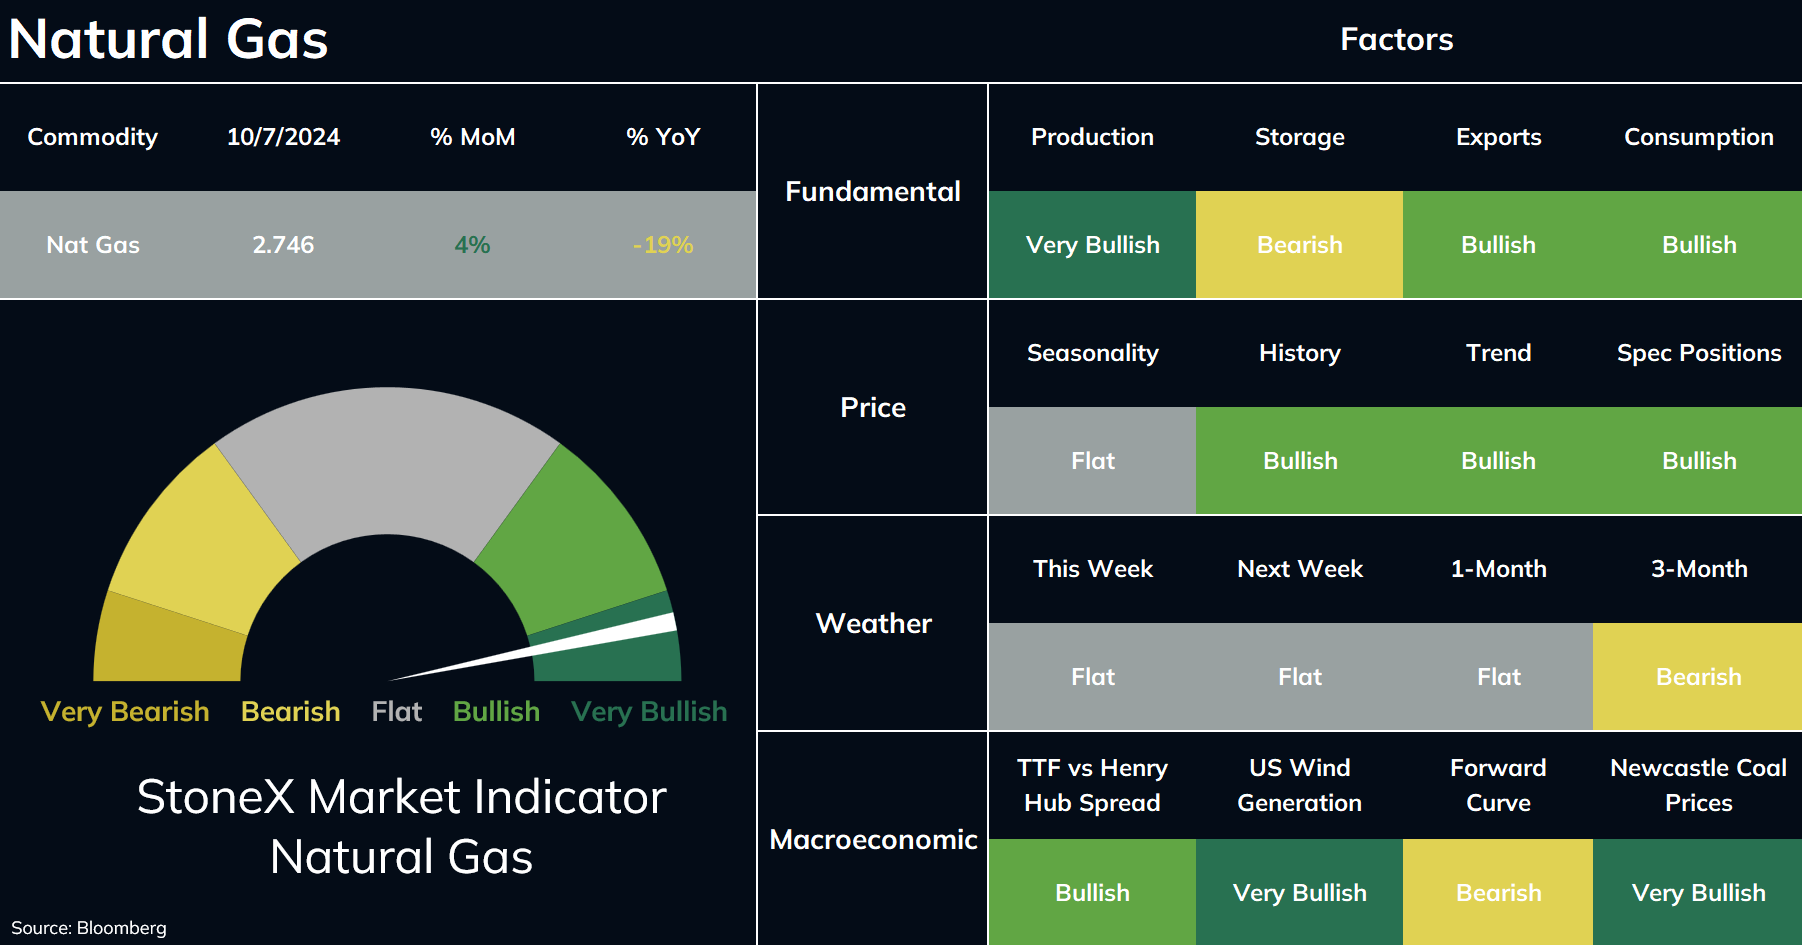
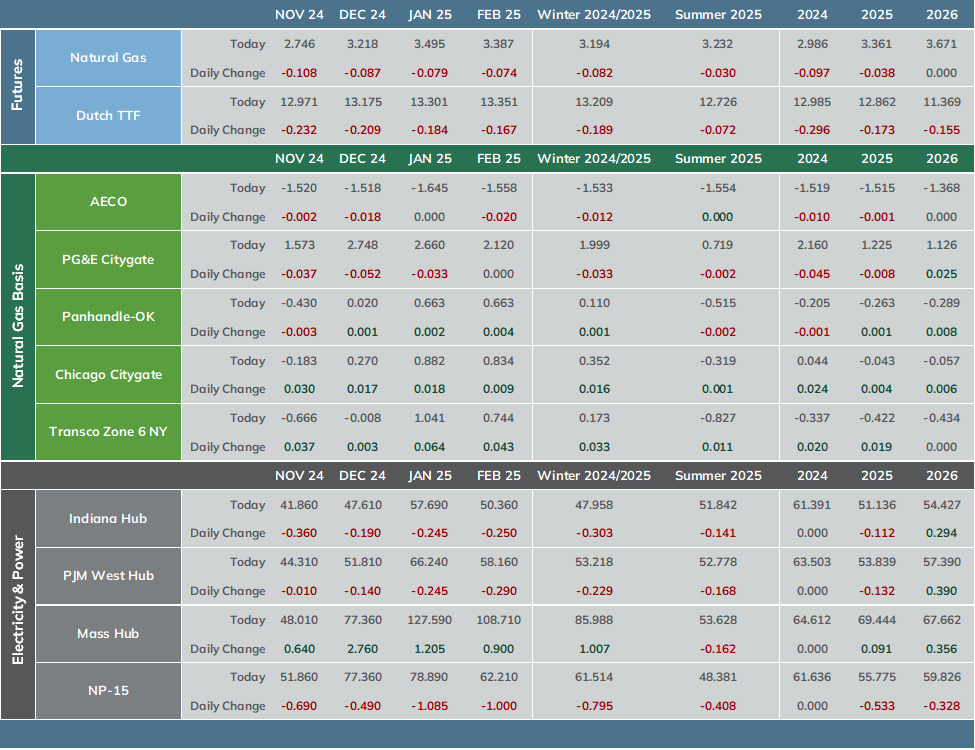
Following a more than 11 cent decline on Friday, the natural gas market extended gains into Monday’s session as what is now Hurricane Milton rapidly intensified over the weekend. The market priced in the likelihood of more widespread power outages and demand destruction across major portions of Florida that are still recovering from Hurricane Helene. Nov nat gas settled 10.8 cents lower at $2.746.
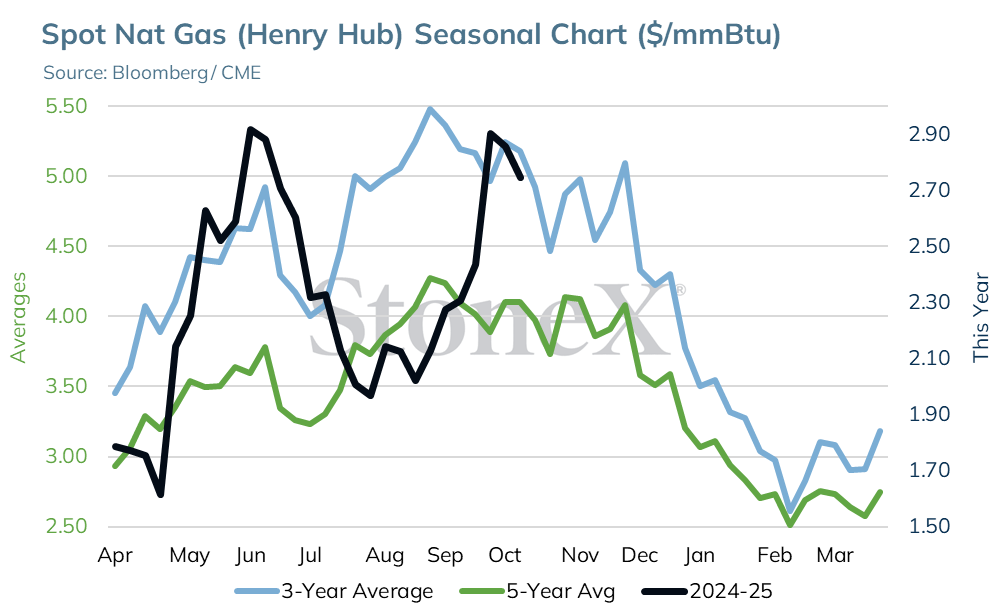
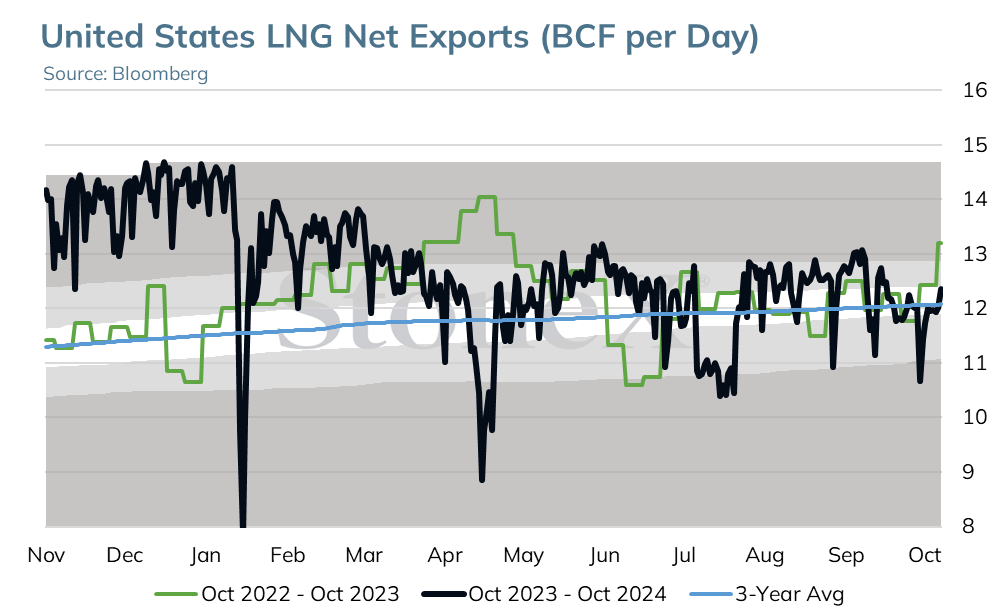
GOM output yesterday came in at just under 1.9 BCF/day as it continues to recover from shut ins prompted by Hurricane Helene. So far, Milton is expected to have limited impact on Gulf output.
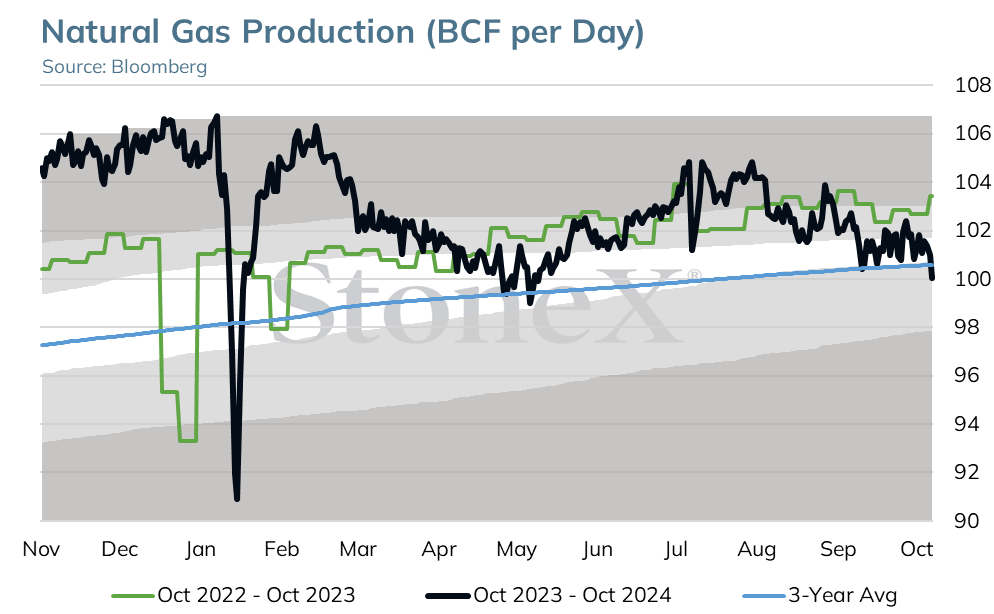
Gas production in the Permian basin is hitting new highs thanks to the Matterhorn Express Pipeline. Flows on the pipeline have been steady, near 600 MMcf/day, helping dry output in the Permian to hit a record high of 20.6 BCF/day on Oct 5. The pipeline can transport up to 2.5 BCF/day, leaving room for growth into next year.
Utilities in the SE are bracing for another hurricane as 260,000 customers still remain without service as a result of Helene. Milton is expected to become a Cat 5 hurricane as it makes landfall late tomorrow or early Thursday along the western Florida Peninsula. While Milton is likely to impact production, it will bring a deeper loss of demand through power outages and cooler temps.
The 6-10 day forecast from Maxar shows cooler changes across the central US for the coming 6-10 day period. The forecast now features a round of much below normal temps for portions of the Midwest and South mid period with the cooler readings hitting the East Coast late in the period. The West will remain unseasonably warm.
Prices are currently trading lower as colder forecasts for next week aren’t supportive enough to counter bearish sentiment from Hurricane Milton that is heading straight towards the Florida coast.
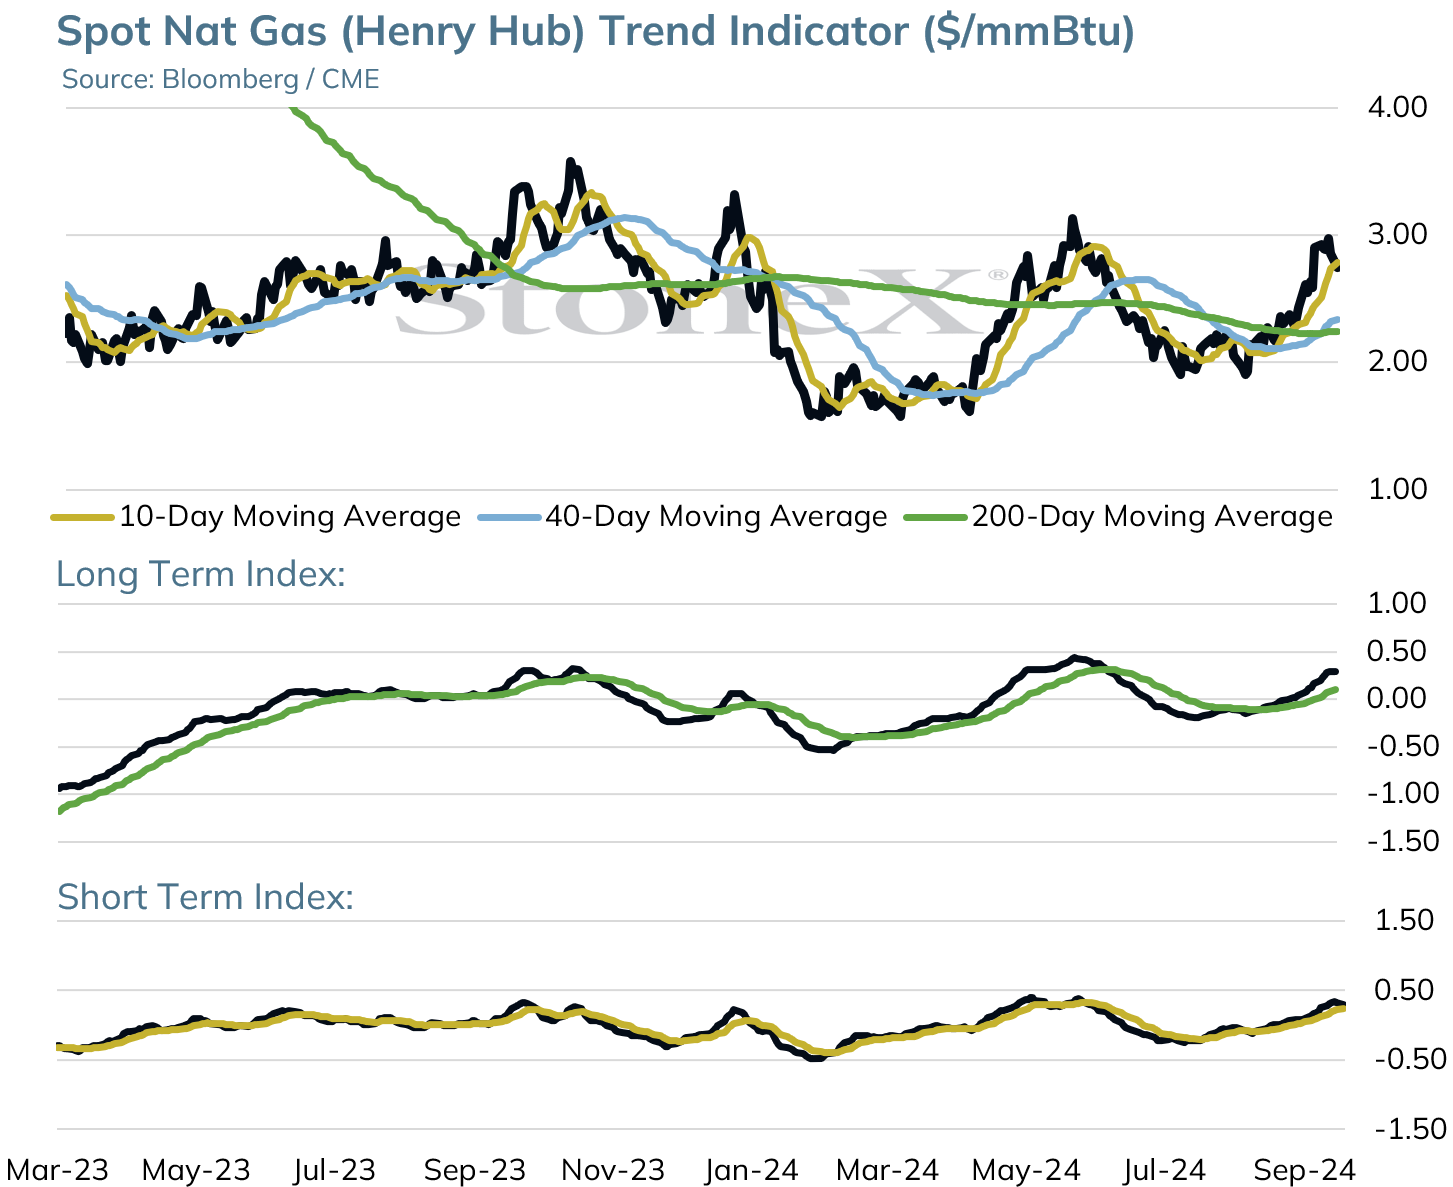
Continued weakness was the theme for natural gas to start the week. The November contract settled at $2.746, down .108 cents. The low at $2.705 breached the September 27th low of $2.720, although the market closed above that level – so far.
Whether this is a corrective pattern or the end of the current rally will depend on the ability of the November contract to close above $2.720 and yesterday’s close of $2.746. The 62% retracement of the recent November move is also at $2.700. There is also a gap between $2.690 - $2.720 that was created by the November rollover that is likely to be filled before any rally resumes.
If the market fails to hold these levels, the next target is the $2.500 area.
Moving Average Alignment – Bullish
Long Term Trend Following Index – Bullish
Short Term Trend Follow Following Index - Bullish
Relative Strength Index - 57.18
This material should be construed as the solicitation of an account, order, and/or services provided by the FCM Division of StoneX Financial Inc. (“SFI”) (NFA ID: 0476094) or StoneX Markets LLC (“SXM”) (NFA ID: 0449652) and represents the opinions and viewpoints of the author. It does not constitute an individualized recommendation or take into account the particular trading objectives, financial situations, or needs of individual customers. Additionally, this material should not be construed as research material. The trading of derivatives such as futures, options, and over-the-counter (OTC) products or “swaps” may not be suitable for all investors. Derivatives trading involves substantial risk of loss, and you should fully understand the risks prior to trading. Past results are not necessarily indicative of future results.
All references to and discussion of OTC products or swaps are made solely on behalf of SXM. All references to futures and options on futures trading are made solely on behalf of SFI. SXM products are intended to be traded only by individuals or firms who qualify under CFTC rules as an ‘Eligible Contract Participant’ (“ECP”) and who have been accepted as customers of SXM.
SFI and SXM are not responsible for any redistribution of this material by third parties, or any trading decisions taken by persons not intended to view this material. Information contained herein was obtained from sources believed to be reliable, but is not guaranteed as to its accuracy. Contact designated personnel from SFI or SXM for specific trading advice to meet your trading preferences.
(1) The StoneX Market Indicator provides an overall view of market sentiment for a commodity based on the quantification of fundamental, technical and historical market data related to that commodity. The StoneX Market Indicator History graphically represents each day’s actual very bearish to very bullish signal. This history contains the sum of all factors, excluding weather forecasts.
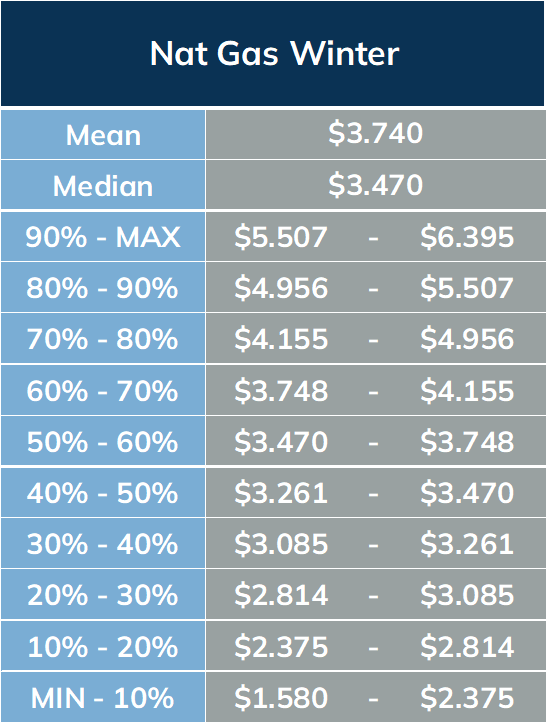
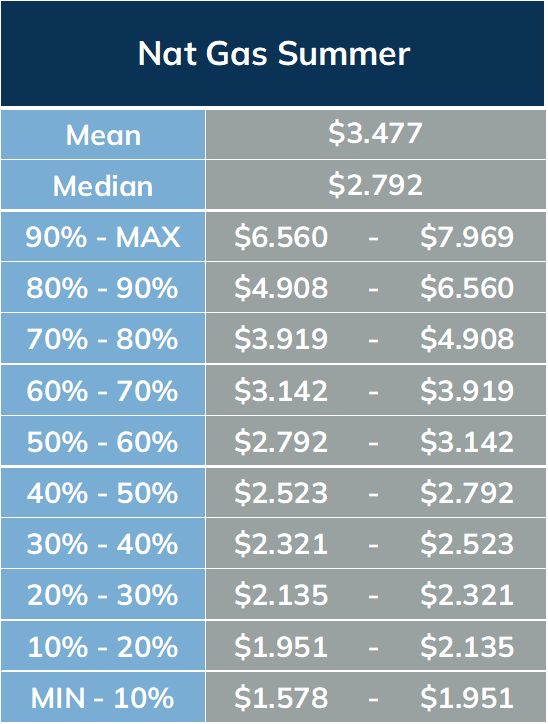
(2) The StoneX Value Matrix provides a measure of historical value by analyzing historical price data distributed into 10 deciles. The prices are adjusted for inflation using the Producer Price Index (PPI) published by the U.S. Bureau of Labor Statistics.
Reproduction or use in any format without authorization is forbidden. © Copyright 2024. All rights reserved.