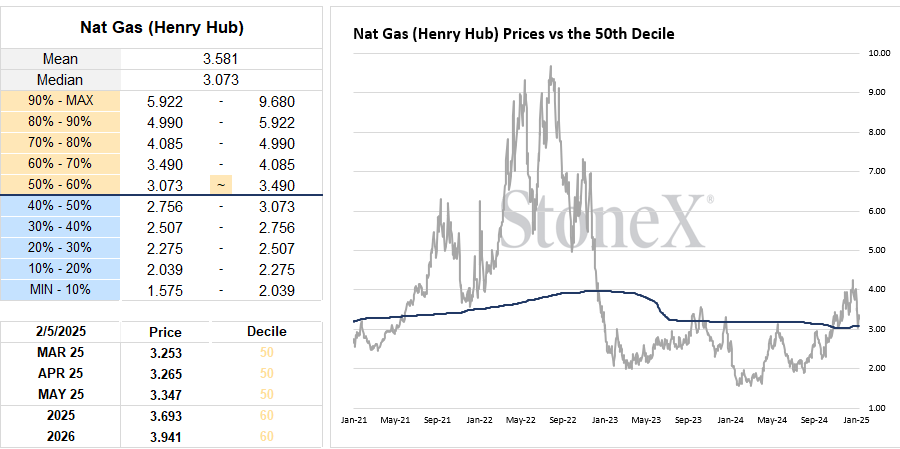
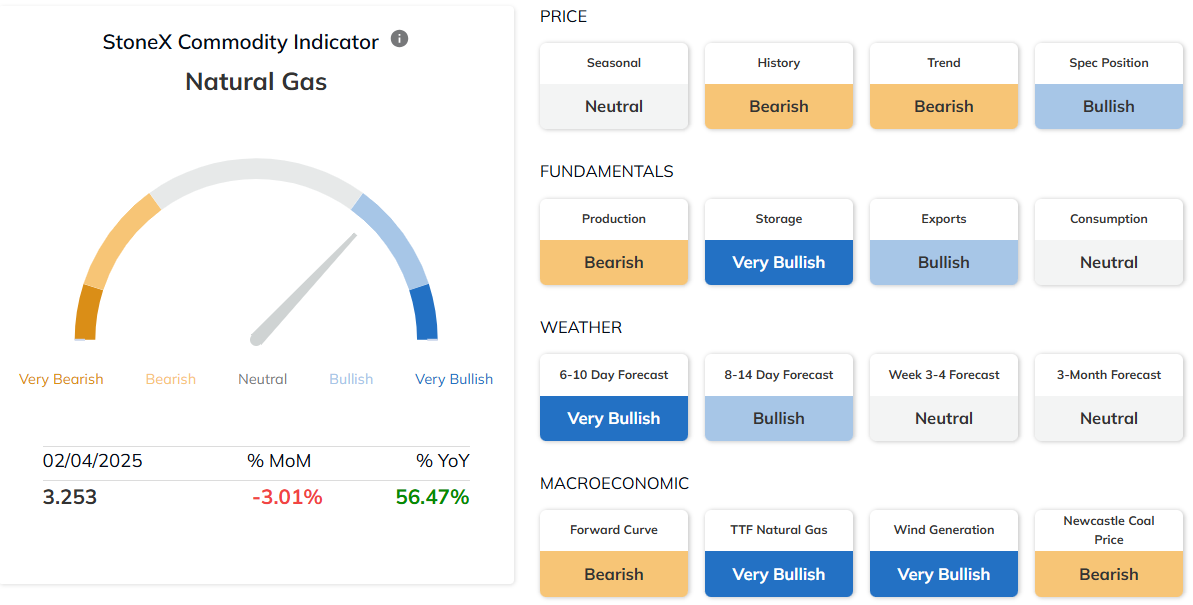
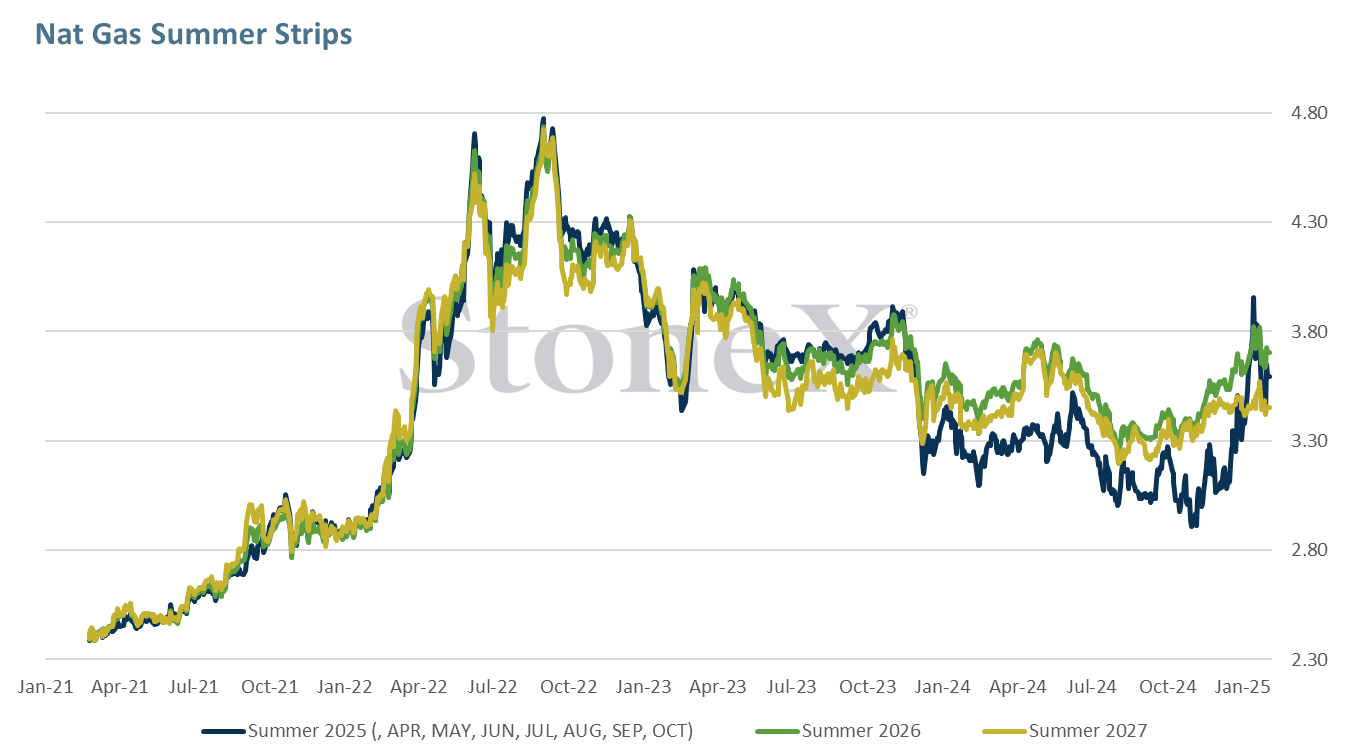
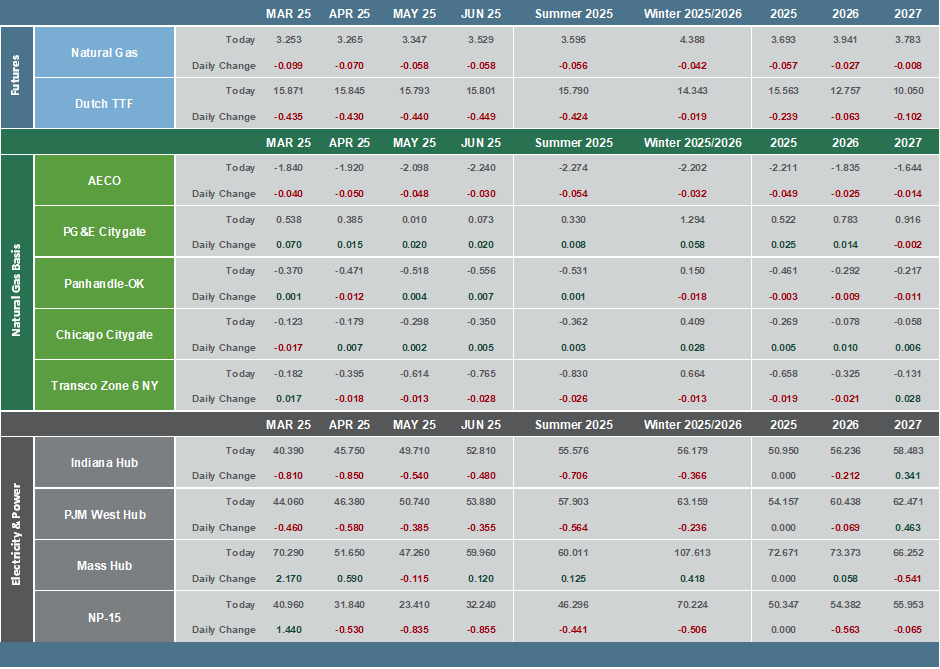
The March contract reversed some of its recent gains Tuesday in response to weather forecasts showing a more moderate pattern for mid February than initially thought. The delay in implementing new tariffs on imports from Canada and Mexico also contributed to the pull back in prices. March NG settled 9.9 cents lower at $3.253.
LNG feedgas demand is back above 15 BCF/day after dipping to 14.2 BCF/day yesterday. The decline yesterday stemmed from lower flows to Sabine Pass amid maintenance on the Creole Trail Pipeline.
Staring Feb 10, China will impose an additional 15% tariff on US coal and LNG in retaliation to Trump’s additional 10% tariff on Chinese goods. Chinese imports of US LNG are down 50% to start the year given weak domestic demand. Chinese imports of US LNG are likely to fall further as a result of the retaliatory tariffs. Chinese buyers are currently contracted to buy 14 million tons of US LNG in 2026 which could also be impacted if the trade war escalates.
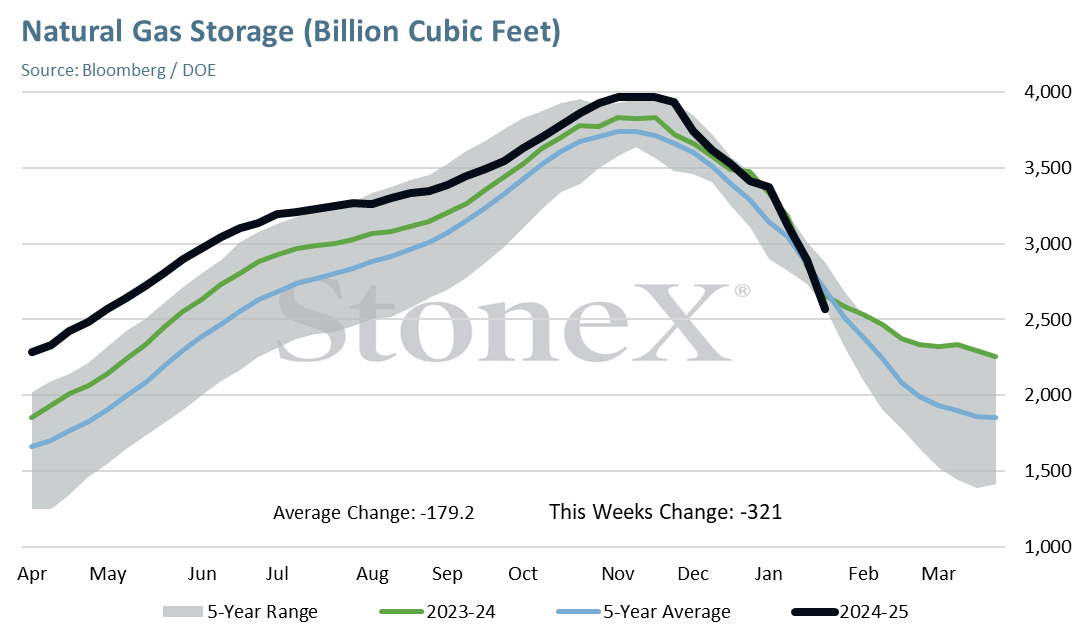
Following 3 back to back bullish storage reports, tomorrow’s report is expected to show a withdrawal more in line with historical averages. Platts estimates a pull of 171 BCF for the week ended Jan 31, which is still supportive compared to last year’s draw of 110 BCF but is in line with the 5 yr avg pull of 174 BCF. Total demand fell sharply last week, led by a drop in res/comm usage and power burn while production rebounded. Withdrawals this month are on track reach a record high, surpassing the 994 BCF withdrawal made during Jan 2022.
For the week ending Feb 7, analysts are expecting a draw around 90 BCF, which falls well below the 5 yr avg draw of 144 BCF but still exceeds the year ago pull of just 60 BCF.
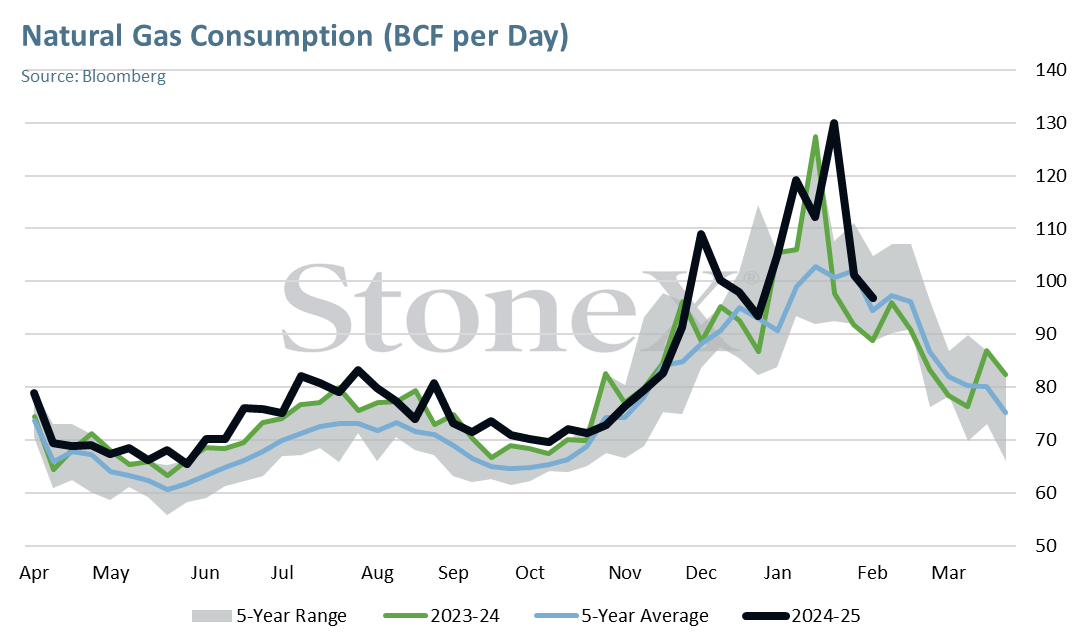
Production remains strong this morning at 104.7 BCF/day, down 0.2 BCF day over day. Total demand continues to creep higher, coming in this morning at 131.6 BCF/day, up 2.2 BCF/day.
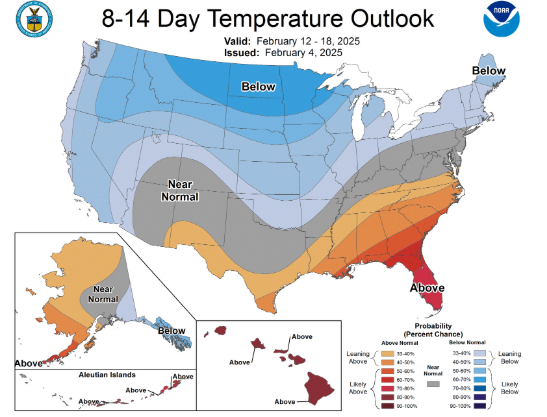
Record warmth will continue across the Southern US through the weekend while much to strong below normal temperatures will emerge across the NW and North Central US. The cold will advance next week, leaving much of the US under colder than normal conditions. The SE remains the exception with readings there expected to average above normal. The cold will turn less extreme while also scale back in coverage during the 8-14 day period.
Technical Analysis
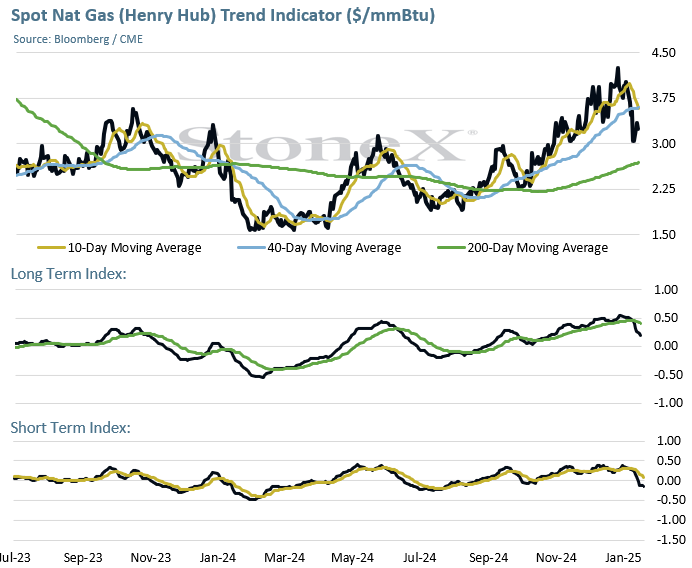
The March 25 natural gas contract turned back down on Tuesday following Monday’s rally higher losing .099 (2.9%) to close the day at 3.253.
Tuesday’s weakness followed a rally higher on Monday which closed the open gap at 3.310 created last week during expiration of the February 25 contract.
There is another downside gap created on Monday’s open which will be closed with trade down to 3.120. It will be interesting to see if prices firm once this gap is closed or instead continue lower.
2.990-3.000 is primary support. This where the March contract bottomed last week (2.990). It is also the 50% retracement support (3.000) of the 2024-2025 downtrend.
If 2.990-3.000 support is broken, the 618% retracement at 2.660 will become the next area of support which coincides with the 200 day moving average currently at 2.695.
The 10 and 40 day moving averages are now in a bearish alignment indicating a seasonal high is in place. 10 day moving average resistance is at 3.455 today, just above 3.407 weekly high resistance, followed by the 40 day average at 3.600.
Moving Average Alignment – Neutral-Bearish
Long Term Trend Following Index – Bearish
Short Term Trend Follow Following Index - Bearish
Relative Strength Index -41.98
This material should be construed as the solicitation of an account, order, and/or services provided by the FCM Division of StoneX Financial Inc. (“SFI”) (NFA ID: 0476094) or StoneX Markets LLC (“SXM”) (NFA ID: 0449652) and represents the opinions and viewpoints of the author. It does not constitute an individualized recommendation or take into account the particular trading objectives, financial situations, or needs of individual customers. Additionally, this material should not be construed as research material. The trading of derivatives such as futures, options, and over-the-counter (OTC) products or “swaps” may not be suitable for all investors. Derivatives trading involves substantial risk of loss, and you should fully understand the risks prior to trading. Past results are not necessarily indicative of future results.
All references to and discussion of OTC products or swaps are made solely on behalf of SXM. All references to futures and options on futures trading are made solely on behalf of SFI. SXM products are intended to be traded only by individuals or firms who qualify under CFTC rules as an ‘Eligible Contract Participant’ (“ECP”) and who have been accepted as customers of SXM.
SFI and SXM are not responsible for any redistribution of this material by third parties, or any trading decisions taken by persons not intended to view this material. Information contained herein was obtained from sources believed to be reliable, but is not guaranteed as to its accuracy. Contact designated personnel from SFI or SXM for specific trading advice to meet your trading preferences.
(1) The StoneX Commodity Indicator provides an overall view of market sentiment for a commodity based on the quantification of fundamental, technical and historical market data related to that commodity. The StoneX Commodity Indicator History graphically represents each day’s actual very bearish to very bullish signal. This history contains the sum of all factors, excluding weather forecasts.
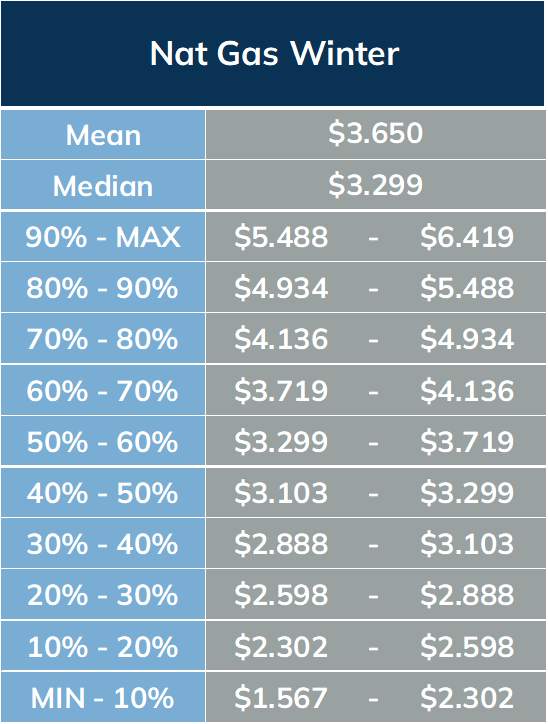
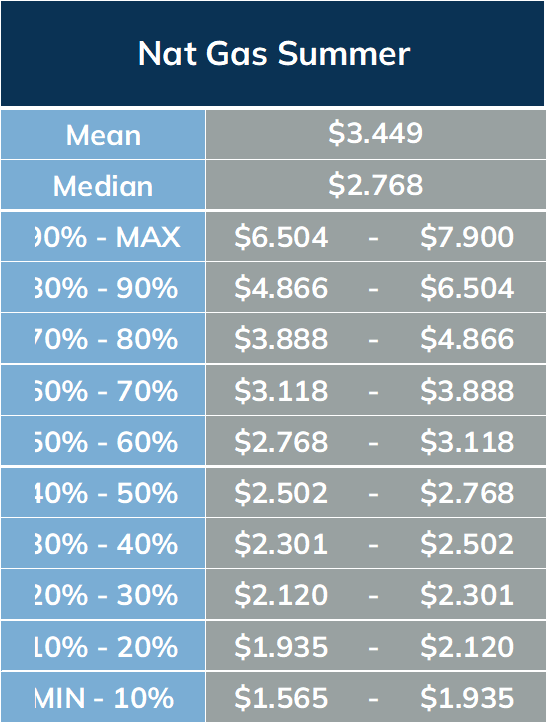
(2) The StoneX Value Matrix provides a measure of historical value by analyzing historical price data distributed into 10 deciles. The prices are adjusted for inflation using the Producer Price Index (PPI) published by the U.S. Bureau of Labor Statistics.
Reproduction or use in any format without authorization is forbidden. © Copyright 2024. All rights reserved.