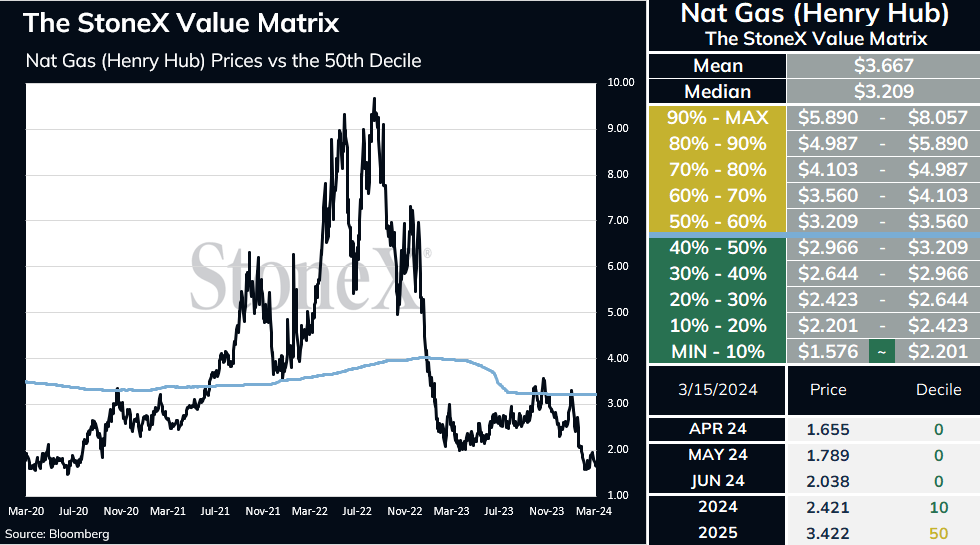
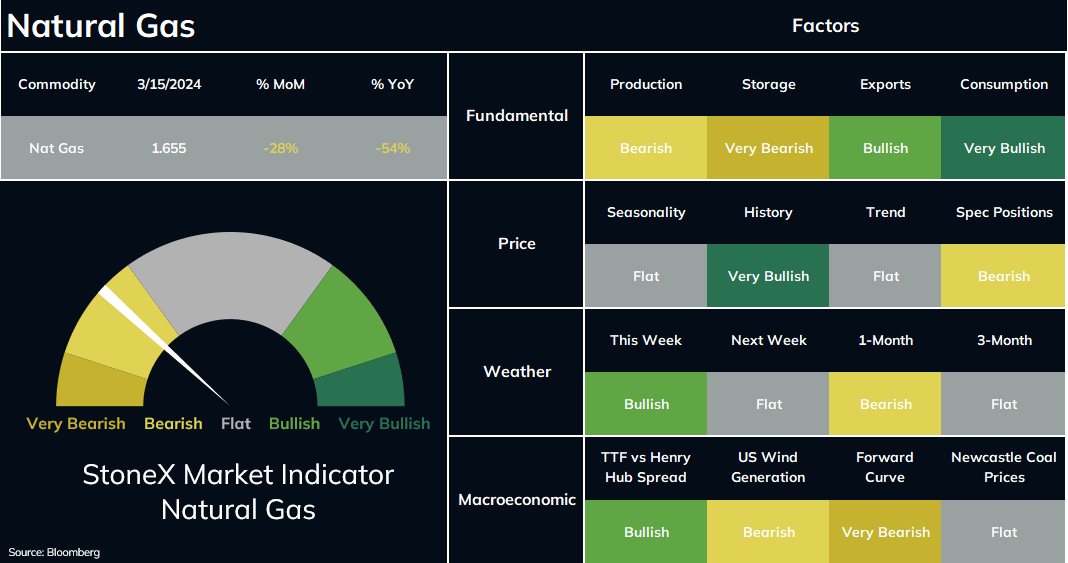
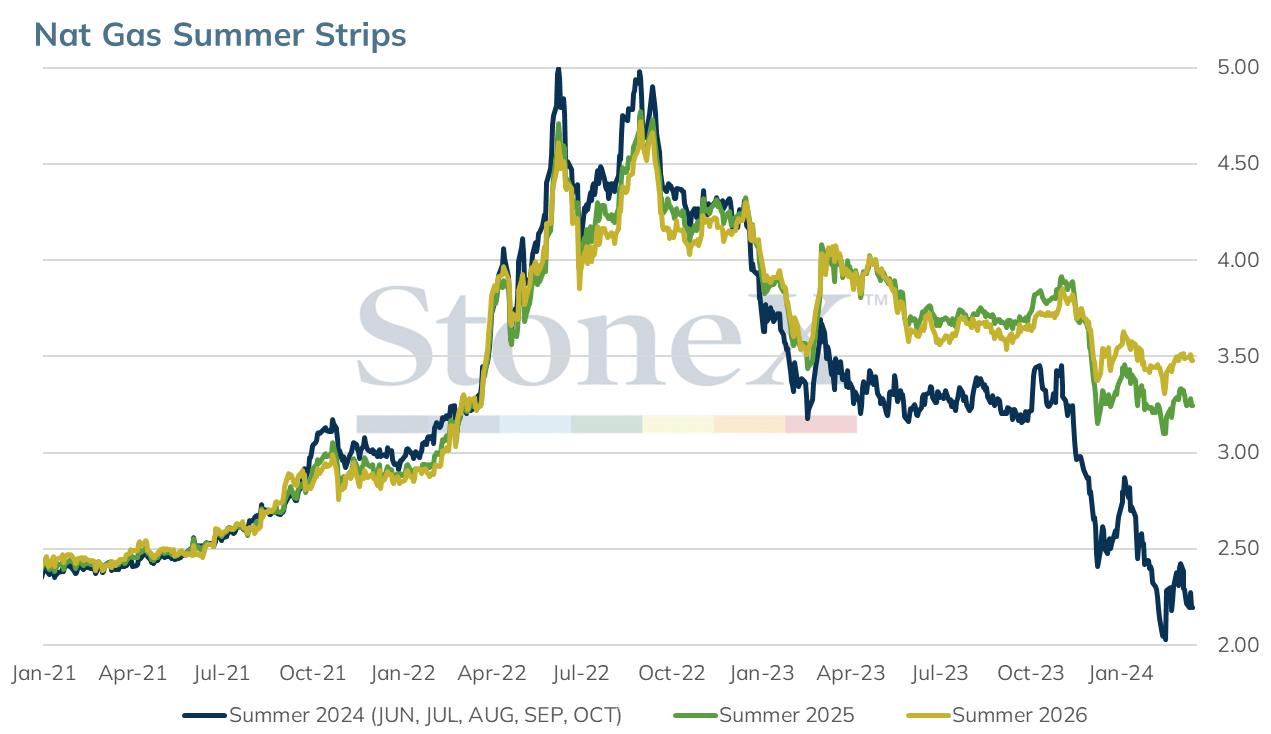
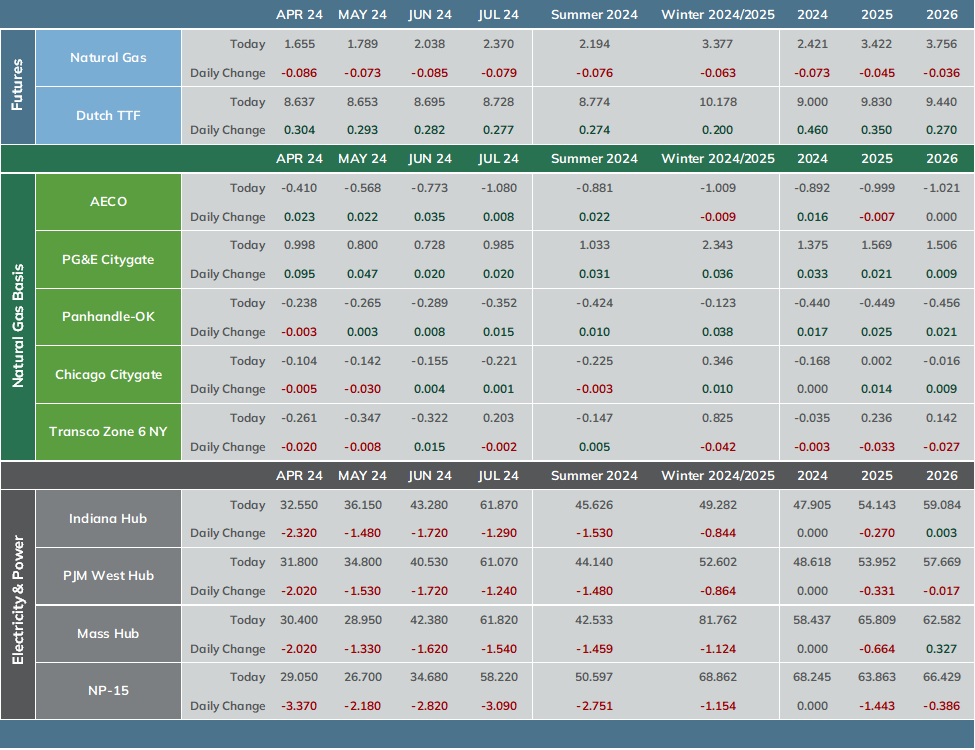
Spot month gas prices fell about 5% on Friday amid warmer forecasts for late March while additional work is underway at Freeport LNG. The combination of lower feedgas demand and paltry heating demand left Apr futures 8.6 cents lower, settling Friday’s session at $1.655. For the week, prices closed down about 8%.
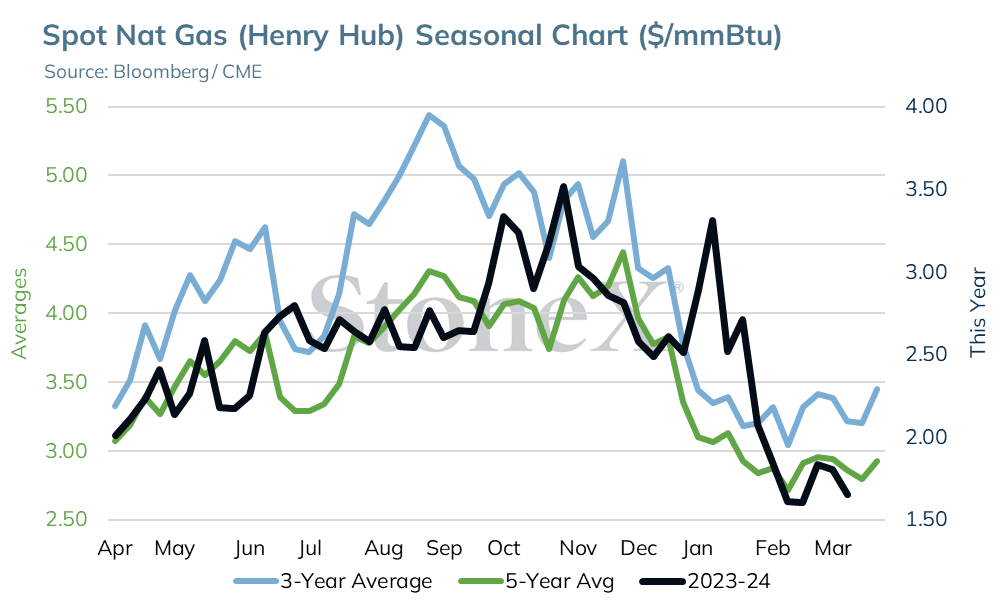
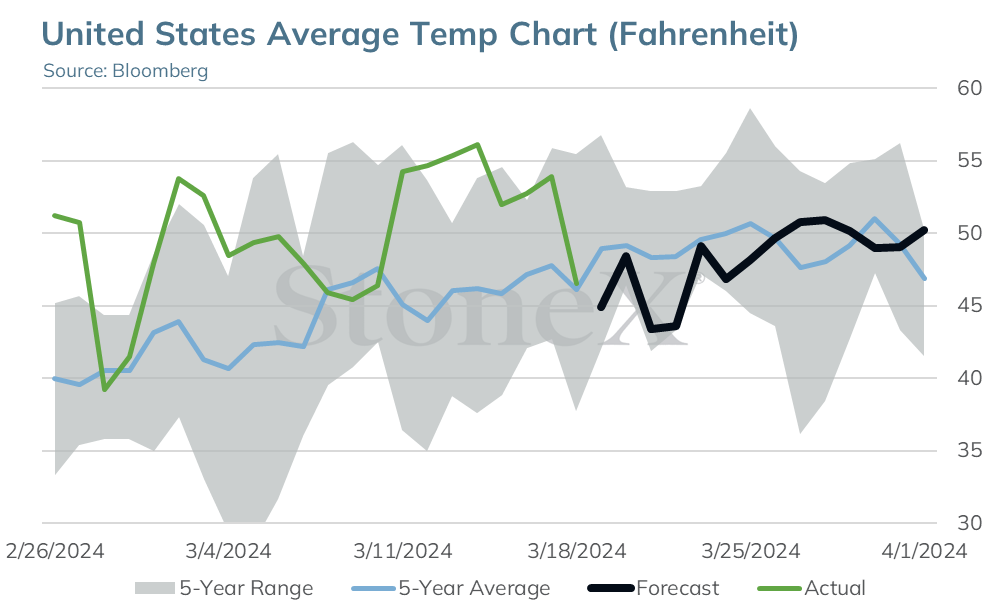
Forecasts trended colder over the weekend, particularly across the Plains and Midwest during the next 2 weeks. Maxar added in 13.6 HDDs with the next 15 days now forecast to yield a total of 274.7 HDDs. This is higher than both the 10 yr and 30 yr norms.
The 6-10 day outlook trended cooler across parts of the eastern 2/3 of the US and is notably colder since Friday from the Rockies to the western Midwest. The 11-15 day period is also trending colder, particularly across the West, Central and South while above normal temps are limited to the East.
Lower gas prices are adding about 3 BCF/day of coal to gas switching in the power sector. This, along with production cuts, could help with market balancing.
LNG feedgas rose to 12.8 BCF/day on Friday with volumes at Freeport LNG at about 770,000 MMBTU/day, indicating only one train in operation. Repairs to Freeport’s 3rd train have been completed however inspections of Train 2 revealed some much needed upgrades. After Train 2 is back online, inspections and upgrades will be made to Train 1. Feedgas demand this morning is estimated at 13.3 BCF/day, 0.6 BCF higher day over day.
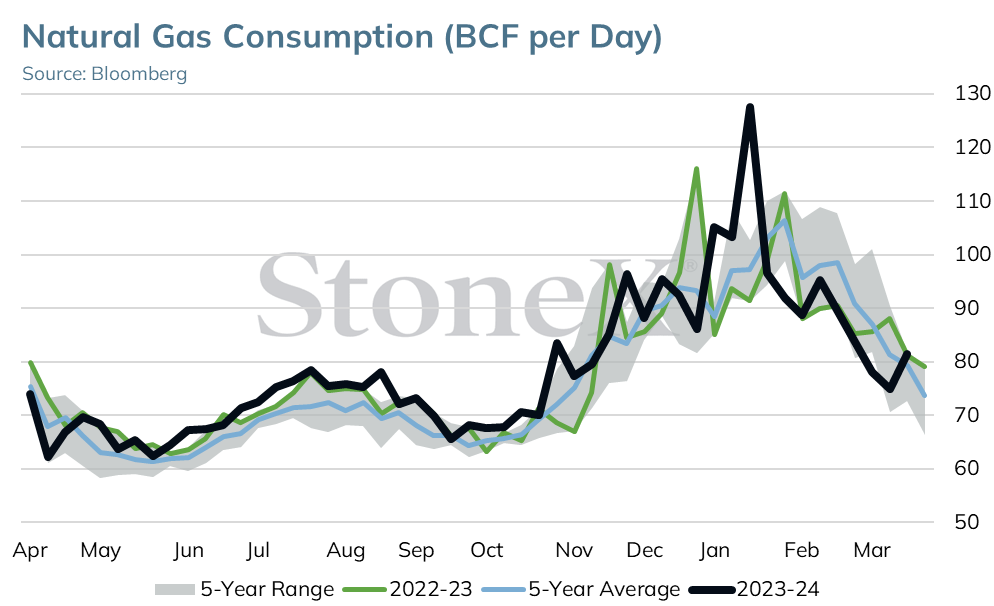
Total demand is coming in 14.3 BCF higher on the day with res/comm usage contributing 10 BCF to the increase. Power burn is up 1.5 BCF/day while industrial usage is up 1.3 BCF/day.
The increase in demand along with supportive weekend weather outlooks is helping nat gas rebound this morning. Dry output also appears to be stabilizing in the low 102 BCF/day range.
The spot April 24 natural gas contract is currently up .080 trading at 1.735 after losing .150 in last week’s trade to close Friday at 1.655.
The April contract has been consolidating in a sideways range between 1.650-1.750 over the past week forming a rectangle on the 60-minute chart.
A drop under 1.650 support will turn the 1.511 low set three weeks ago into the next area of support. If this low continues to hold, a post-winter low will be set.
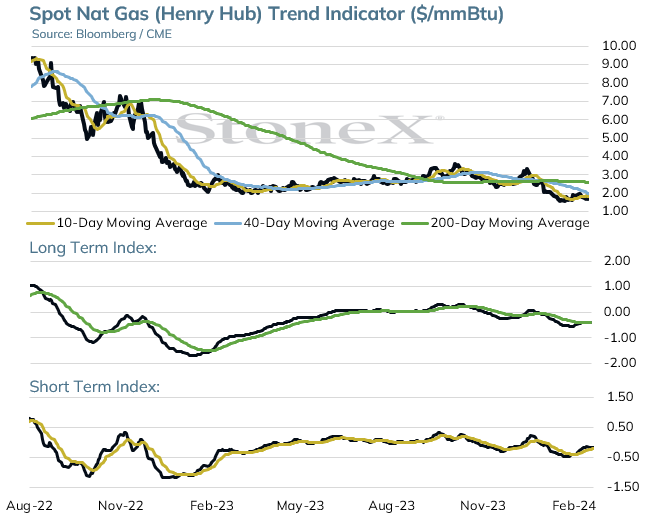
The 10 day moving average which held as resistance last week is at 1.775 today. If broken, the 40 day average at 1.920 will become the next area of resistance.
Trend following indexes are bullish but 10, 40 and 200 day moving average alignment is bearish offering a mixed technical picture.
Moving Average Alignment – Bearish
Long Term Trend Following Index – Bullish
Short Term Trend Follow Following Index - Bullish
Relative Strength Index - 43.83
The StoneX Market Indicator provides an overall view of market sentiment for a commodity based on the quantification of fundamental, technical and historical market data related to that commodity. Each factor is quantified by comparing data for the current period versus last year, versus the previous period, versus its history and versus the yearly average. This quantification is converted to a number and summed together. The sum of all factors are reweighted by the 4-year decile of its history. The 4-year deciles redistribute the StoneX Market Indicator to obtain an equal share between the bullish and the bearish signals. The StoneX Market Indicator History graphically represents each day’s actual very bearish to very bullish signal. This history contains the sum of all factors, excluding weather forecasts.
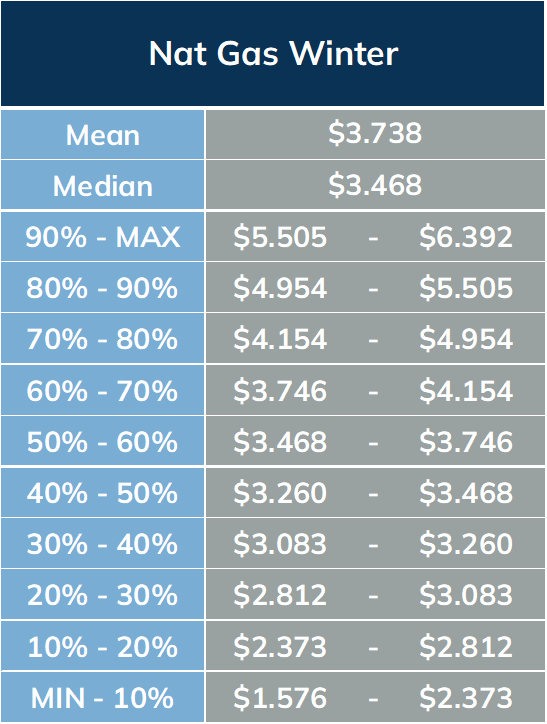
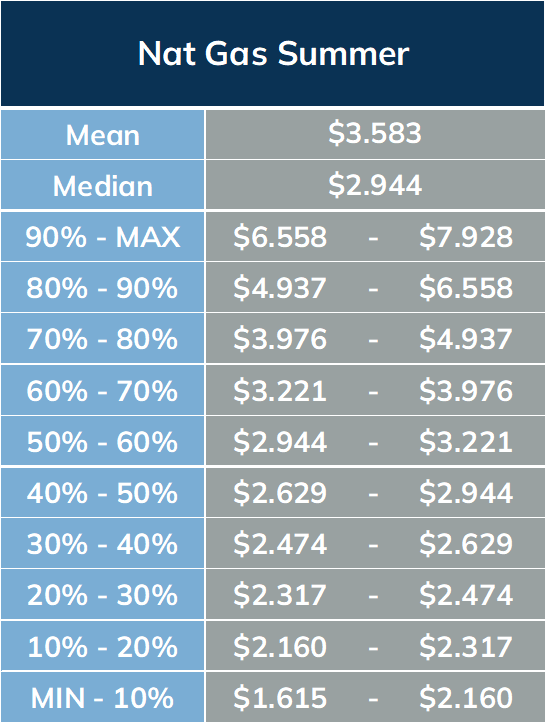
The StoneX Value Matrix provides a measure of historical value by analyzing 4 years historical price data distributed into 10 deciles. All of the years are weighted at 20% with the exception of the most recent year which is weighted at 40%. The prices are adjusted for inflation using the Producer Price Index (PPI).
Reproduction or use in any format without authorization is forbidden. © Copyright 2024. All rights reserved.