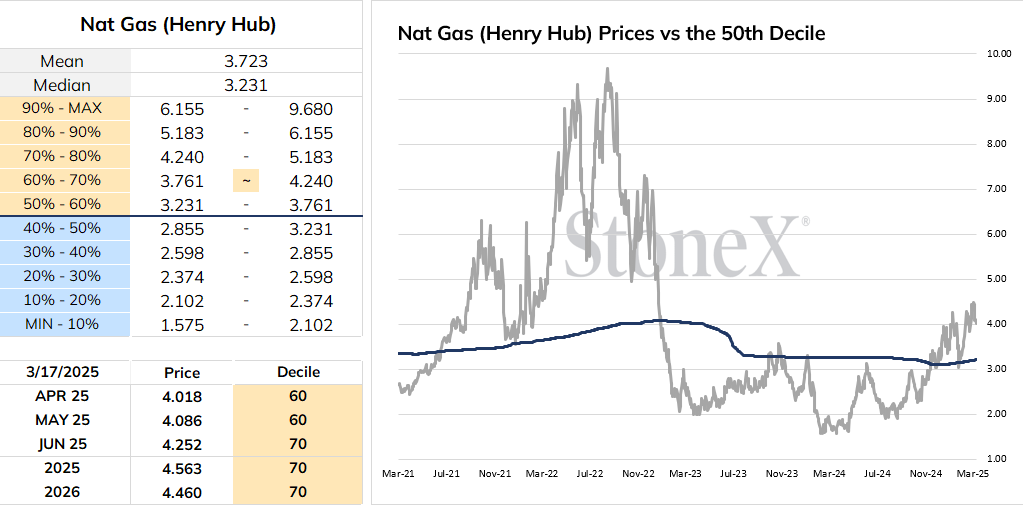
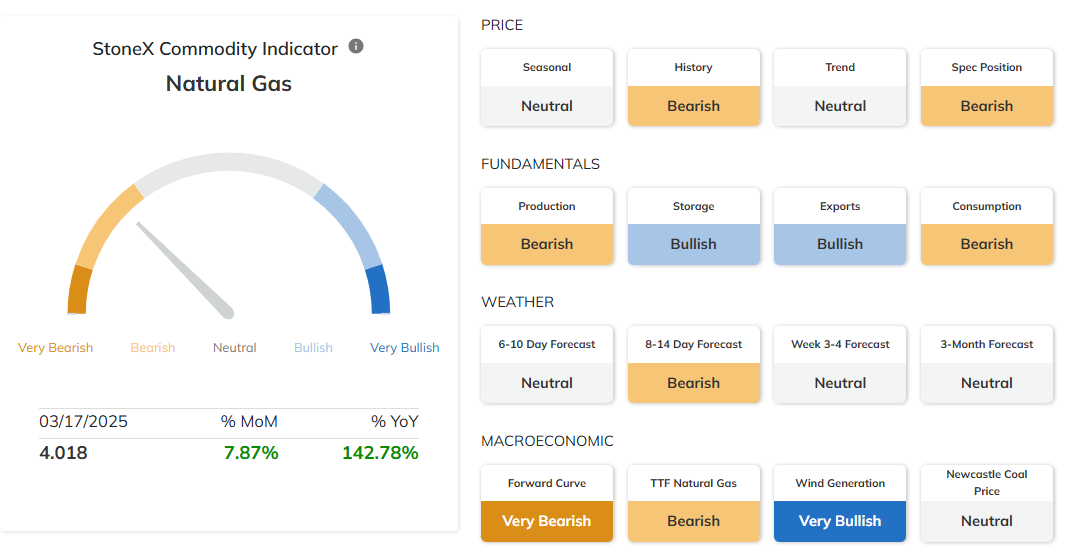
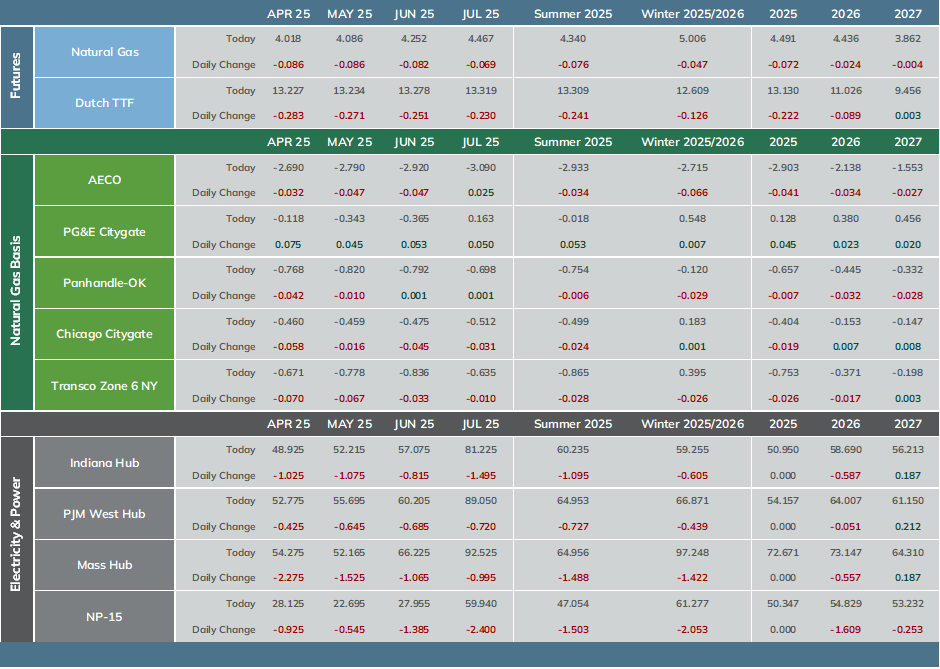
Spot month gas prices settled with a loss to the start the week following a volatile trading session. With weather forecasts not proving cool enough to provide support, trade yesterday was focused on the potential for an injection in this week’s storage report. April NG settled 8.6 cents lower at $4.018.
Cheniere has completed the first train of its midscale expansion of Corpus Christi. The train is the first of 7 units included in the Stage 3 expansion, which will add more than 10 mmt/yr of output capacity to the terminal once fully online. Two additional trains are expected to be completed this year with the remaining 4 in 2026. Total production capacity of the plant is estimated at more than 25 mmt/yr.
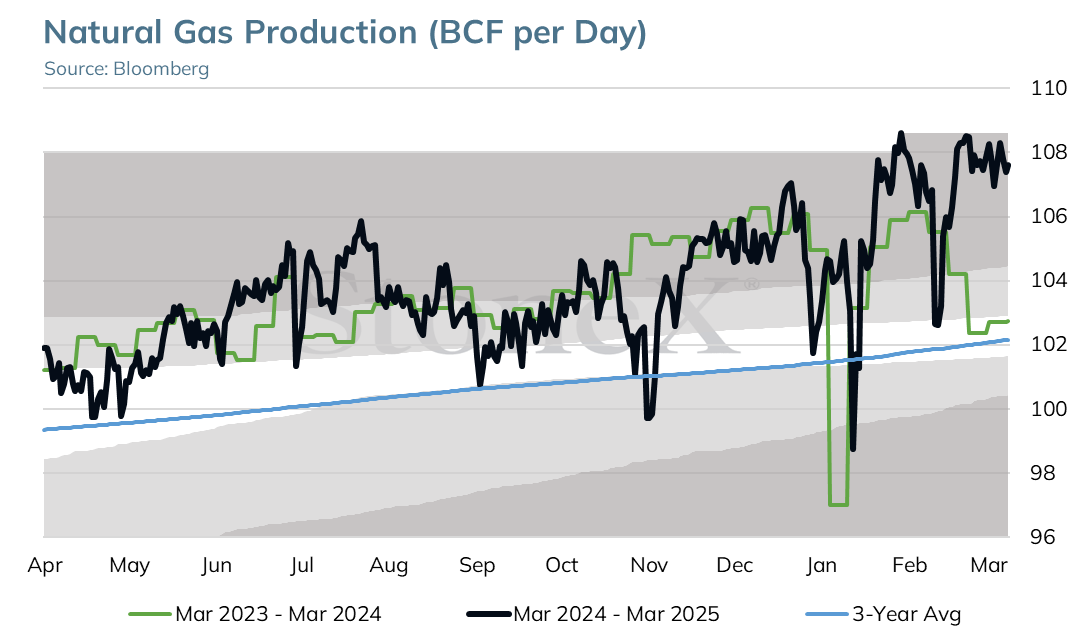
Feedgas deliveries to Cheniere were about 2.5 BCF/day yesterday with overall feedgas demand at 16.4 BCF/day. Over the next 4 years, feedgas demand is expected to grow by 15 BCF/day from this year’s projected average of 16 BCF/day.
Forecasts yesterday were revised warmer for the Midwest over the next 5 days with the West expected to turn warmer next week. Cooler changes were made to the Eastern US for both the 6-10 and 11-15 day periods with heating degree days forecasts rising by 15.3 HDDs for the coming 2 weeks.
Total demand for today is estimated at 103.7 BCF/day, 5.2 BCF/day lower than Monday. Res/comm is driving the decline as it is estimated at 24.3 BCF/day, down 3.9 BCF/day while power burn has slipped 0.8 BCF/day. Total consumption is expected to rise to 109 BCF/day over the next week.
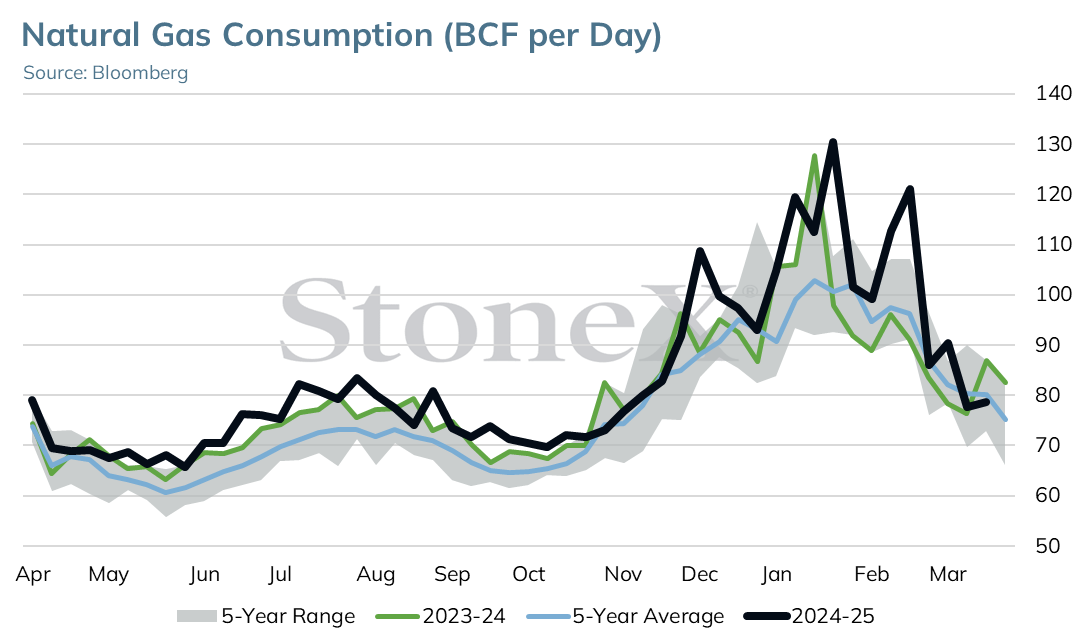
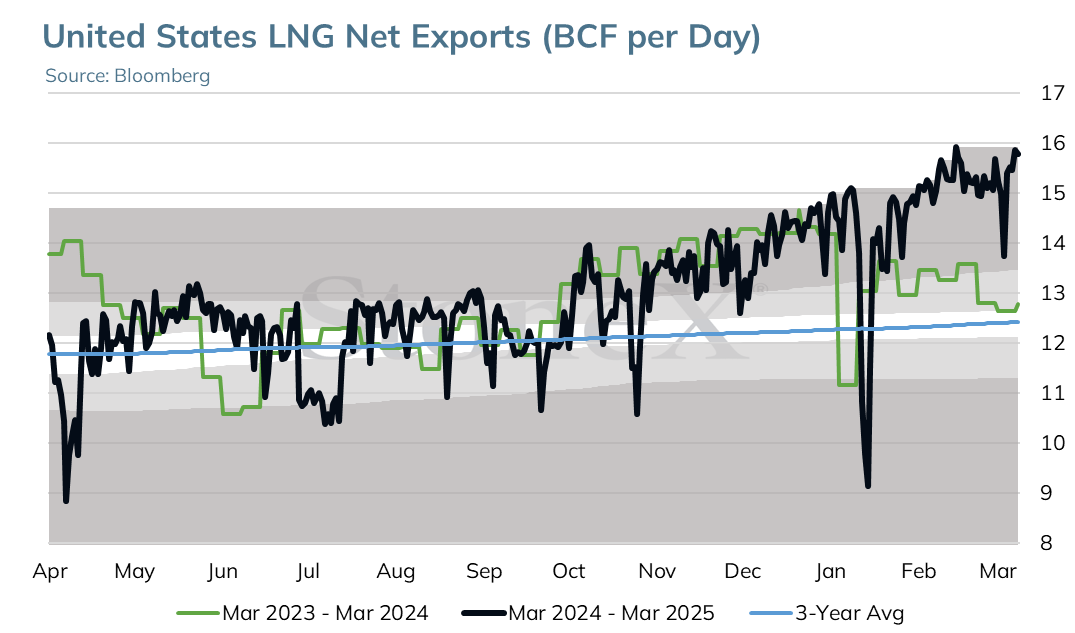
Prices are trading stronger this morning as pipeline maintenance weighs on production. Dry output is down 1 BCF/day this morning at 105.3 BCF/day.
Technical Analysis
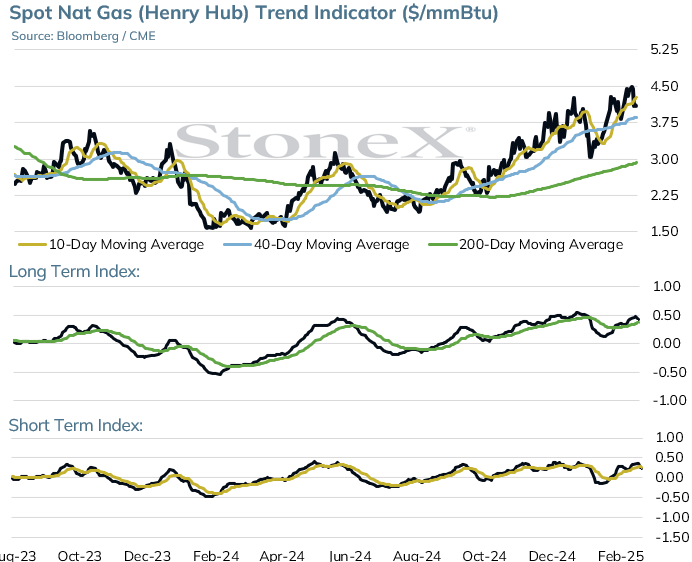
An early rally attempt on Monday by the April 25 natural gas contract reached a 4.218 high before stalling.
Selling into the close dropped the April contract to a 4.018 daily settle, down .086. Volume was low at 153,362 contracts.
60-minute chart trend line support at the 4.000 level was broken overnight but follow through selling has been minimal.
The daily continuation chart 40 day moving average is at 3.860 today. A close under this average will turn the trend back down.
10 day moving average resistance is at 4.240 with longer term resistance at last week’s 4.9101 high.
Bearish divergences (new price high, lower index high) on the daily RSI and short term trend following indexes suggest a winter top may finally be in place. A bearish dark cloud cover Japanese candlestick also formed on the weekly chart last week but needs to see follow though selling this week for confirmation.
Moving Average Alignment – Bullish
Long Term Trend Following Index – Bullish
Short Term Trend Follow Following Index - Bearish
Relative Strength Index - 49.19
This material should be construed as the solicitation of an account, order, and/or services provided by the FCM Division of StoneX Financial Inc. (“SFI”) (NFA ID: 0476094) or StoneX Markets LLC (“SXM”) (NFA ID: 0449652) and represents the opinions and viewpoints of the author. It does not constitute an individualized recommendation or take into account the particular trading objectives, financial situations, or needs of individual customers. Additionally, this material should not be construed as research material. The trading of derivatives such as futures, options, and over-the-counter (OTC) products or “swaps” may not be suitable for all investors. Derivatives trading involves substantial risk of loss, and you should fully understand the risks prior to trading. Past results are not necessarily indicative of future results.
All references to and discussion of OTC products or swaps are made solely on behalf of SXM. All references to futures and options on futures trading are made solely on behalf of SFI. SXM products are intended to be traded only by individuals or firms who qualify under CFTC rules as an ‘Eligible Contract Participant’ (“ECP”) and who have been accepted as customers of SXM.
SFI and SXM are not responsible for any redistribution of this material by third parties, or any trading decisions taken by persons not intended to view this material. Information contained herein was obtained from sources believed to be reliable, but is not guaranteed as to its accuracy. Contact designated personnel from SFI or SXM for specific trading advice to meet your trading preferences.
(1) The StoneX Commodity Indicator provides an overall view of market sentiment for a commodity based on the quantification of fundamental, technical and historical market data related to that commodity. The StoneX Commodity Indicator History graphically represents each day’s actual very bearish to very bullish signal. This history contains the sum of all factors, excluding weather forecasts.
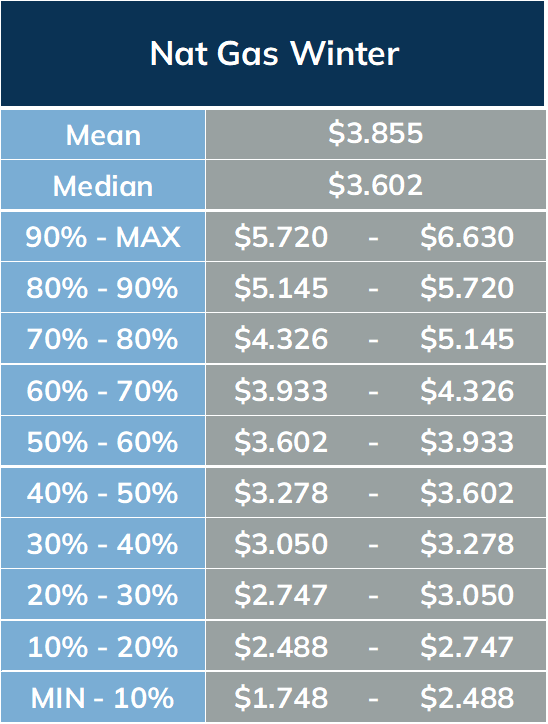
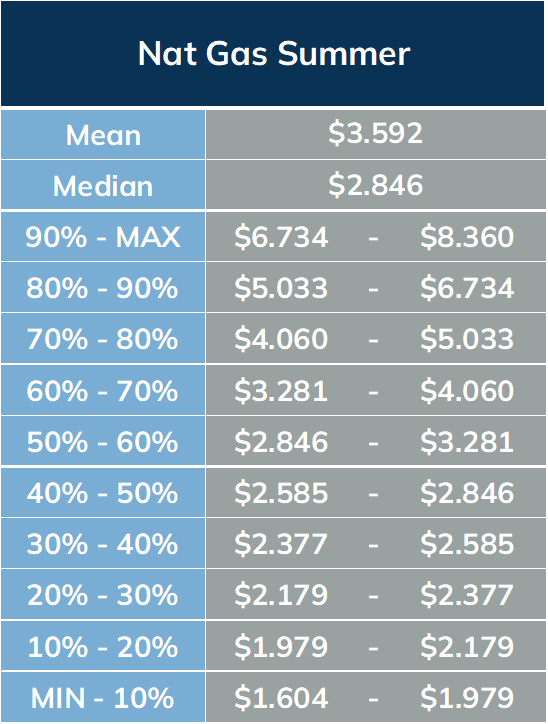
(2) The StoneX Value Matrix provides a measure of historical value by analyzing historical price data distributed into 10 deciles. The prices are adjusted for inflation using the Producer Price Index (PPI) published by the U.S. Bureau of Labor Statistics.
Reproduction or use in any format without authorization is forbidden. © Copyright 2024. All rights reserved.