The market rallied yesterday on more evidence of production cuts and an uptick in LNG feedgas demand at Freeport LNG. The rally lost traction midday on reports over a disruption to LNG export activity out of Corpus Christi due to a vehicle driving into the water. The channel closed Tuesday afternoon amid efforts to remove the vehicle. May futures settled 2.9 cents higher at $1.873.
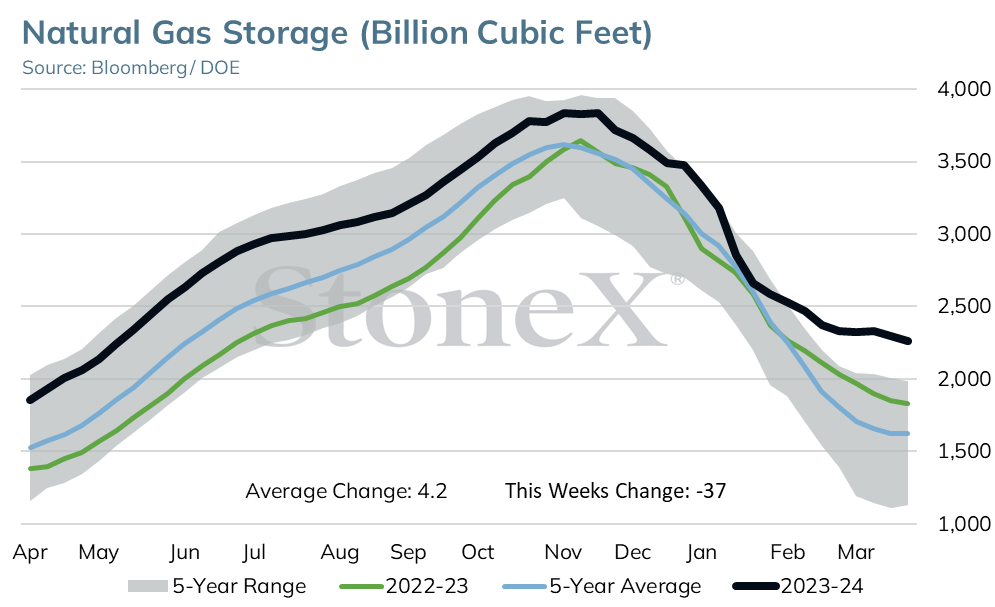
This week’s storage report is projected to show a lower than normal injection of 9 BCF for the week ended Apr 5 which will help chip away at the surplus. A build this size would be 15 BCF lower than the 5 yr avg and would fall short of last year’s 11 BCF injection. For the week ending Apr 12, Platts projects another relatively bullish injection of 37 BCF which would be 24 BCF below the 5 yr avg.
The EIA is expecting the injection rate this year to lag historical norms as a result of lower gas production. They still see injection season ending around 4.12 TCF, 10% higher than the 5 yr avg and the most on record.
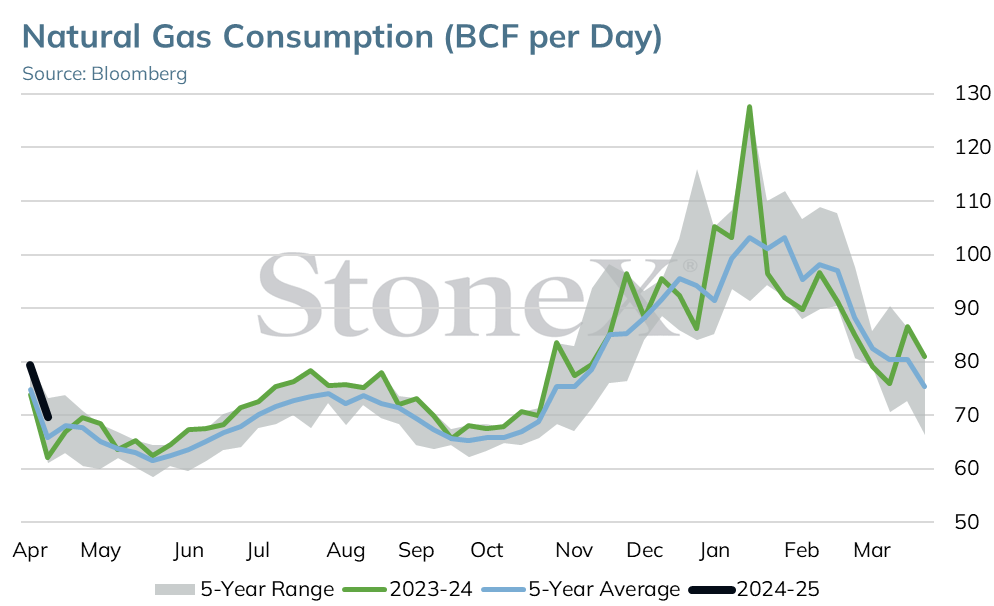
Total demand is pegged at 97.4 BCF today, up 0.6 BCF/day from yesterday due to stronger feedgas demand. After holding steady the past 2 days at 12.7 BCF/day, LNG feedgas demand is estimated today at 13.4 BCF/day. Volumes into Freeport rose about 1.3 BCF/day yesterday after averaging below 770 MMcf/day over the past month. Platts predicts feedgas volumes will remain above 13 BCF/day over the next 2 weeks, averaging about 13.3 BCF/day.
Res/comm usage has fallen about 10 BCF/day over the past week, coming in this morning at 17.9 BCF/day.
The gas market is maintaining upward momentum this morning as lower drilling rates are translating to slower production growth. Output yesterday fell below 100 BCF/day to 99.7 BCF/day. Output is down another 0.3 BCF this morning at 99.4 BCF/day. The EIA estimates dry output to average 103 BCF/day during the Apr-Oct period.
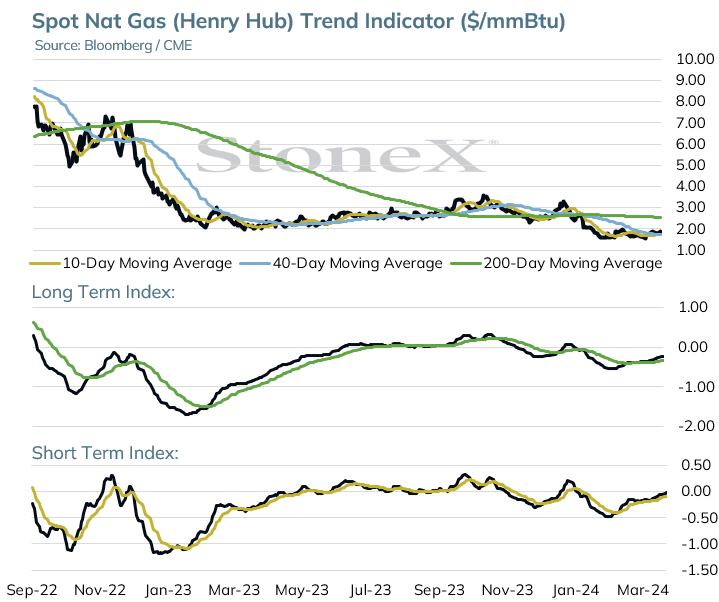
The near term and possibly long term trend for the natural gas market turned back higher this week after holding above key support last week.
After holding above 10 and 40 day moving average support last week, the spot May 24 natural gas contract has been trending back higher this week breaking out above 1.906 resistance in today’s early trade.
This turns the early-March high at 2.009 into the next area of resistance. A breakout above 2.000 would be a very bullish technical signal for the market.
1.900-1.910 is now near term support followed by the 10 day moving average at 1.820 and the 40 day average at 1.745. The 10 and 40 day moving averages are in a bullish alignment for the first time since early-January.
As long as the May contract holds above these two averages, the trend will remain sideways to higher.
Funds were net short 27,705 contracts as of the April 2 close. Funds have likely covered this position and will start to accumulate a long position given the technical change in the market.
Moving Average Alignment – Neutral-Bullish
Long Term Trend Following Index – Bullish
Short Term Trend Follow Following Index - Bullish
Relative Strength Index - 57.79
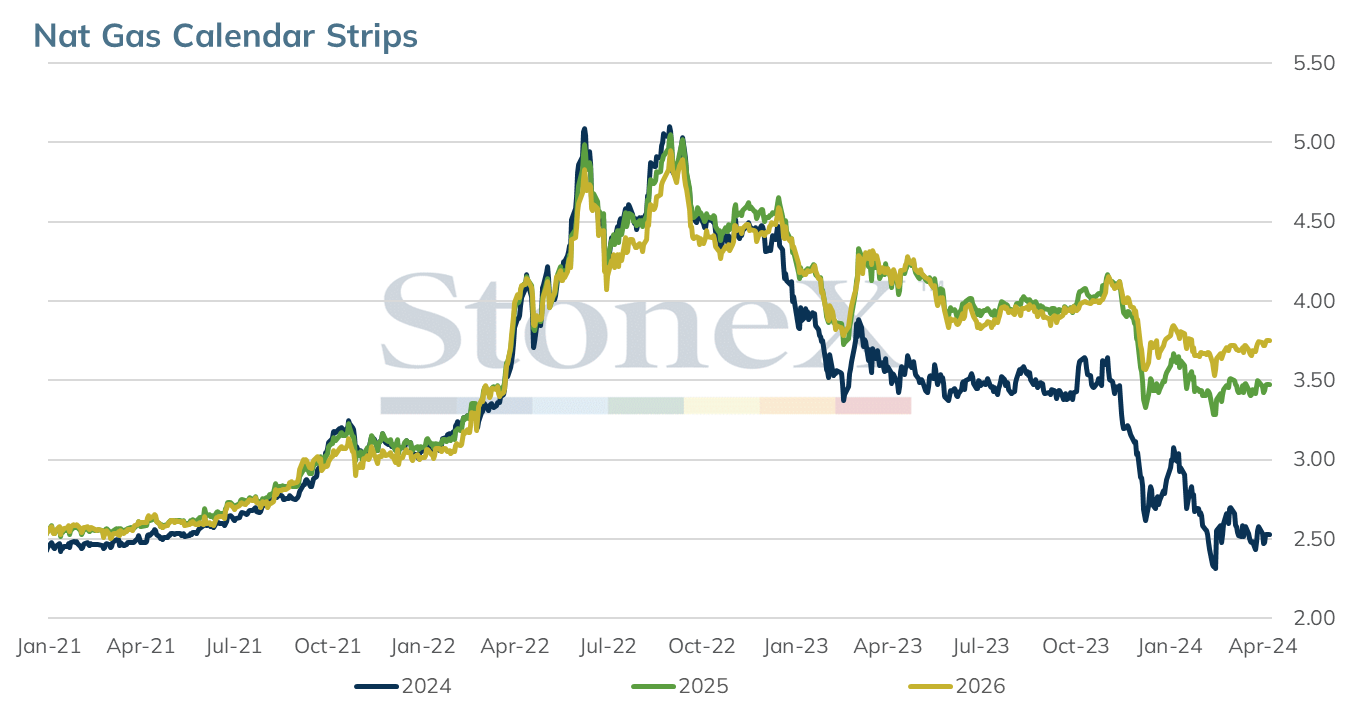
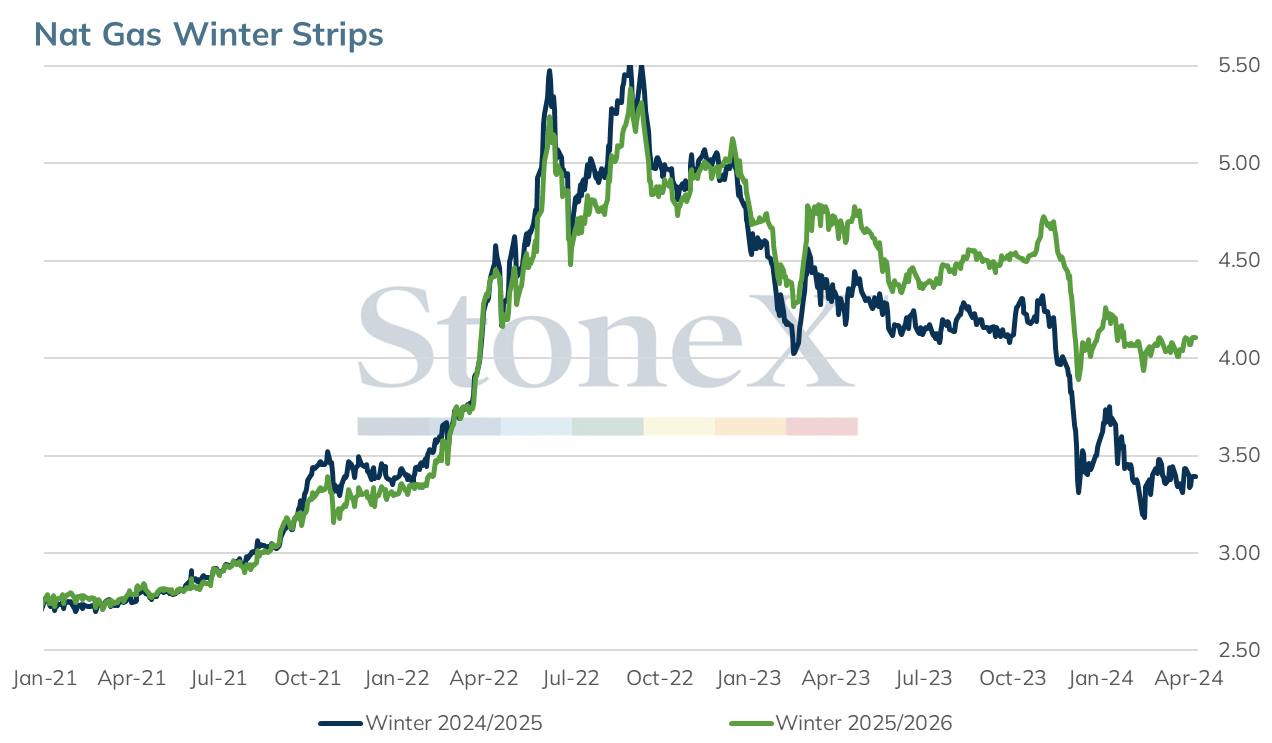
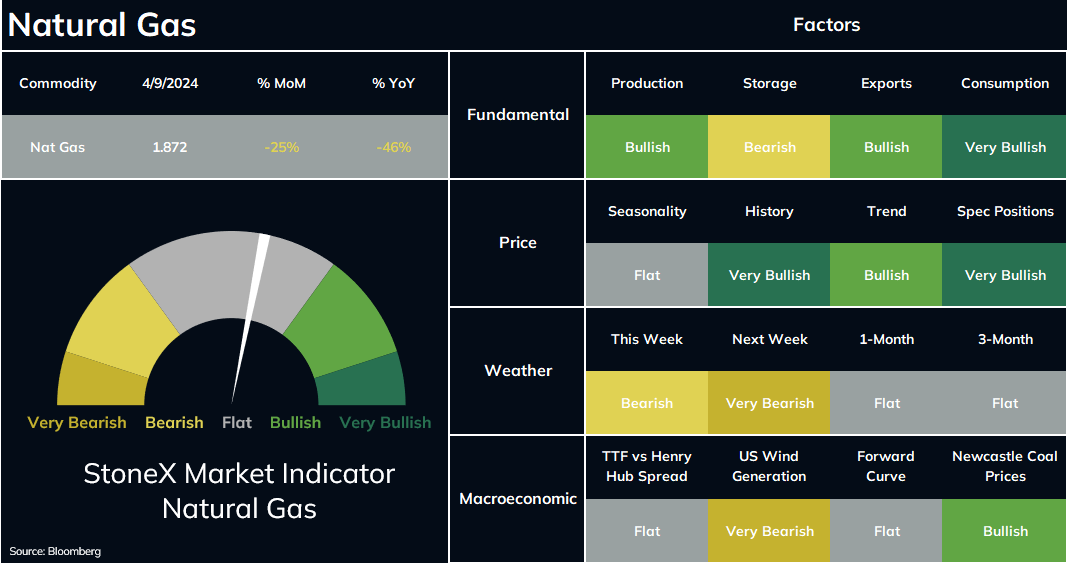
The StoneX Market Indicator provides an overall view of market sentiment for a commodity based on the quantification of fundamental, technical and historical market data related to that commodity. Each factor is quantified by comparing data for the current period versus last year, versus the previous period, versus its history and versus the yearly average. This quantification is converted to a number and summed together. The sum of all factors are reweighted by the 4-year decile of its history. The 4-year deciles redistribute the StoneX Market Indicator to obtain an equal share between the bullish and the bearish signals. The StoneX Market Indicator History graphically represents each day’s actual very bearish to very bullish signal. This history contains the sum of all factors, excluding weather forecasts.
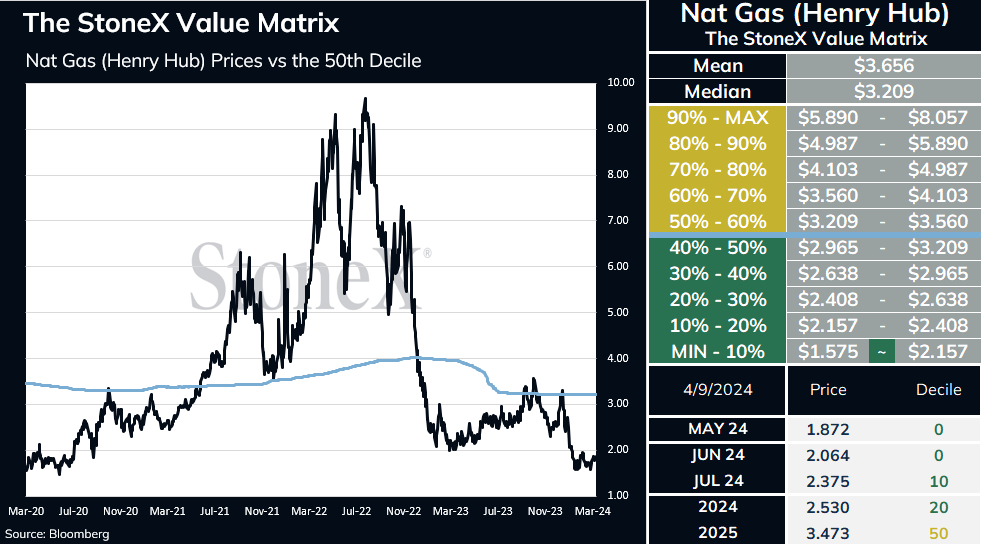
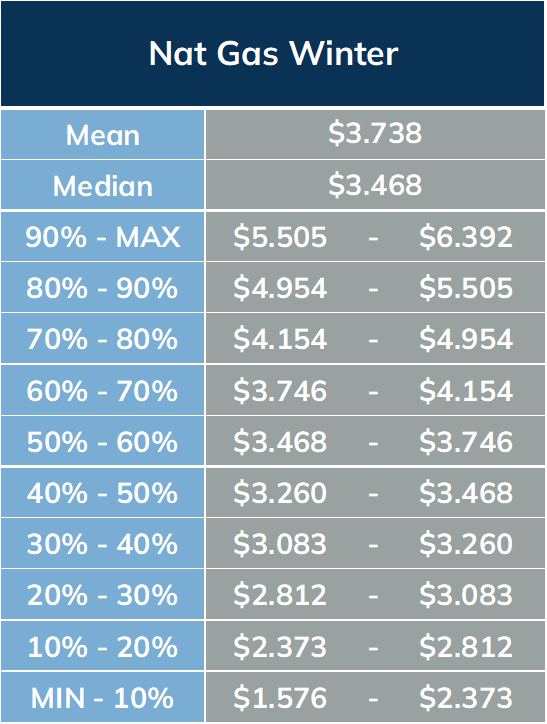
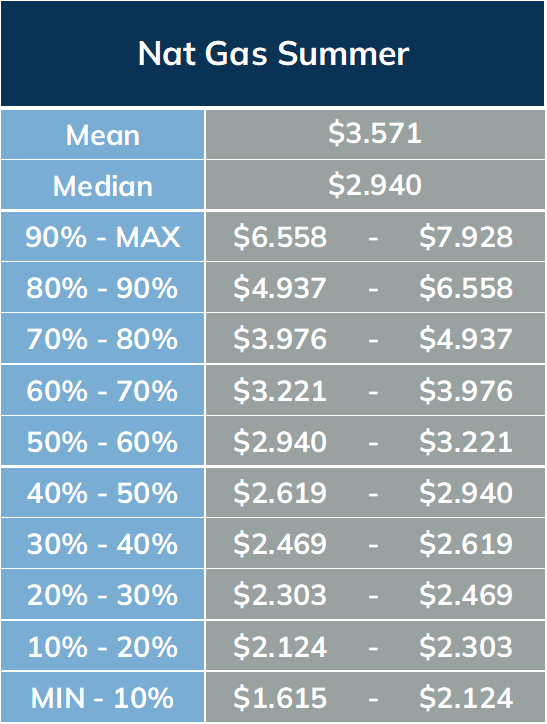
The StoneX Value Matrix provides a measure of historical value by analyzing 4 years historical price data distributed into 10 deciles. All of the years are weighted at 20% with the exception of the most recent year which is weighted at 40%. The prices are adjusted for inflation using the Producer Price Index (PPI).
Reproduction or use in any format without authorization is forbidden. © Copyright 2024. All rights reserved.