December Seasonality Key Points
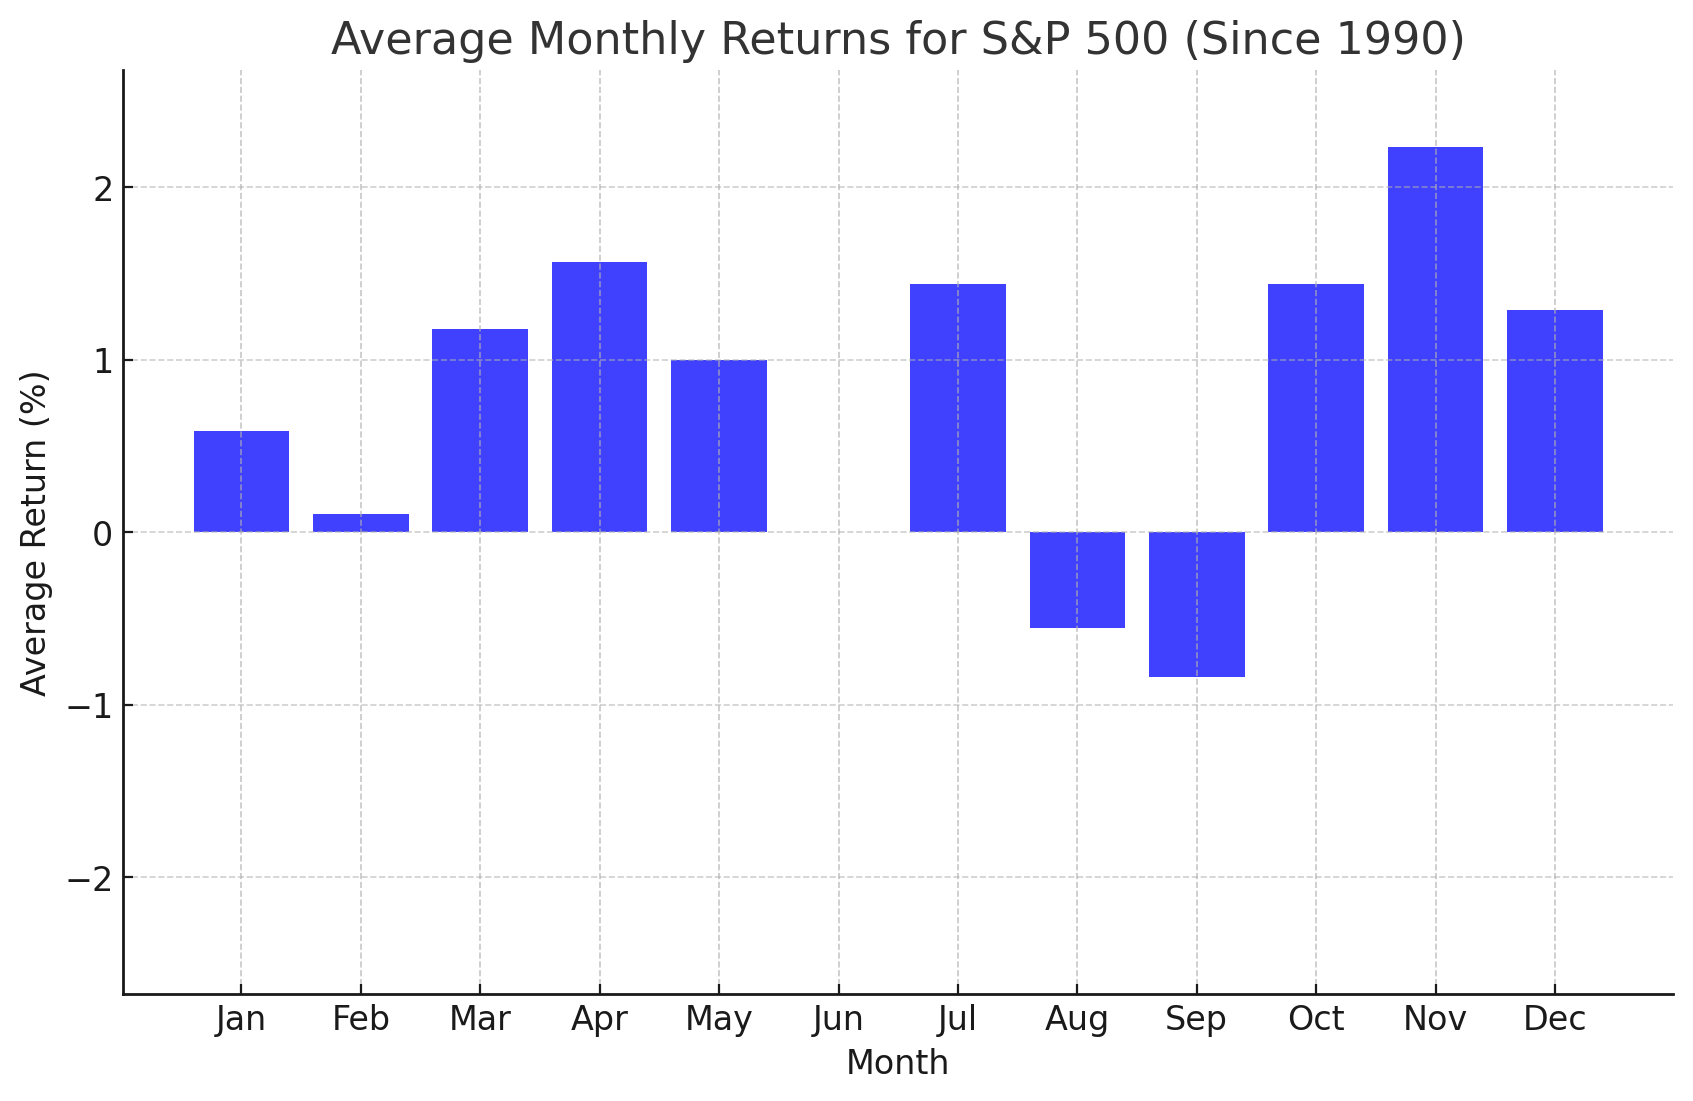
- Historically, December has been a strong month for US stocks, with the broad S&P 500 index sporting an average (price-only) return of +1.3% over the last 35 years.
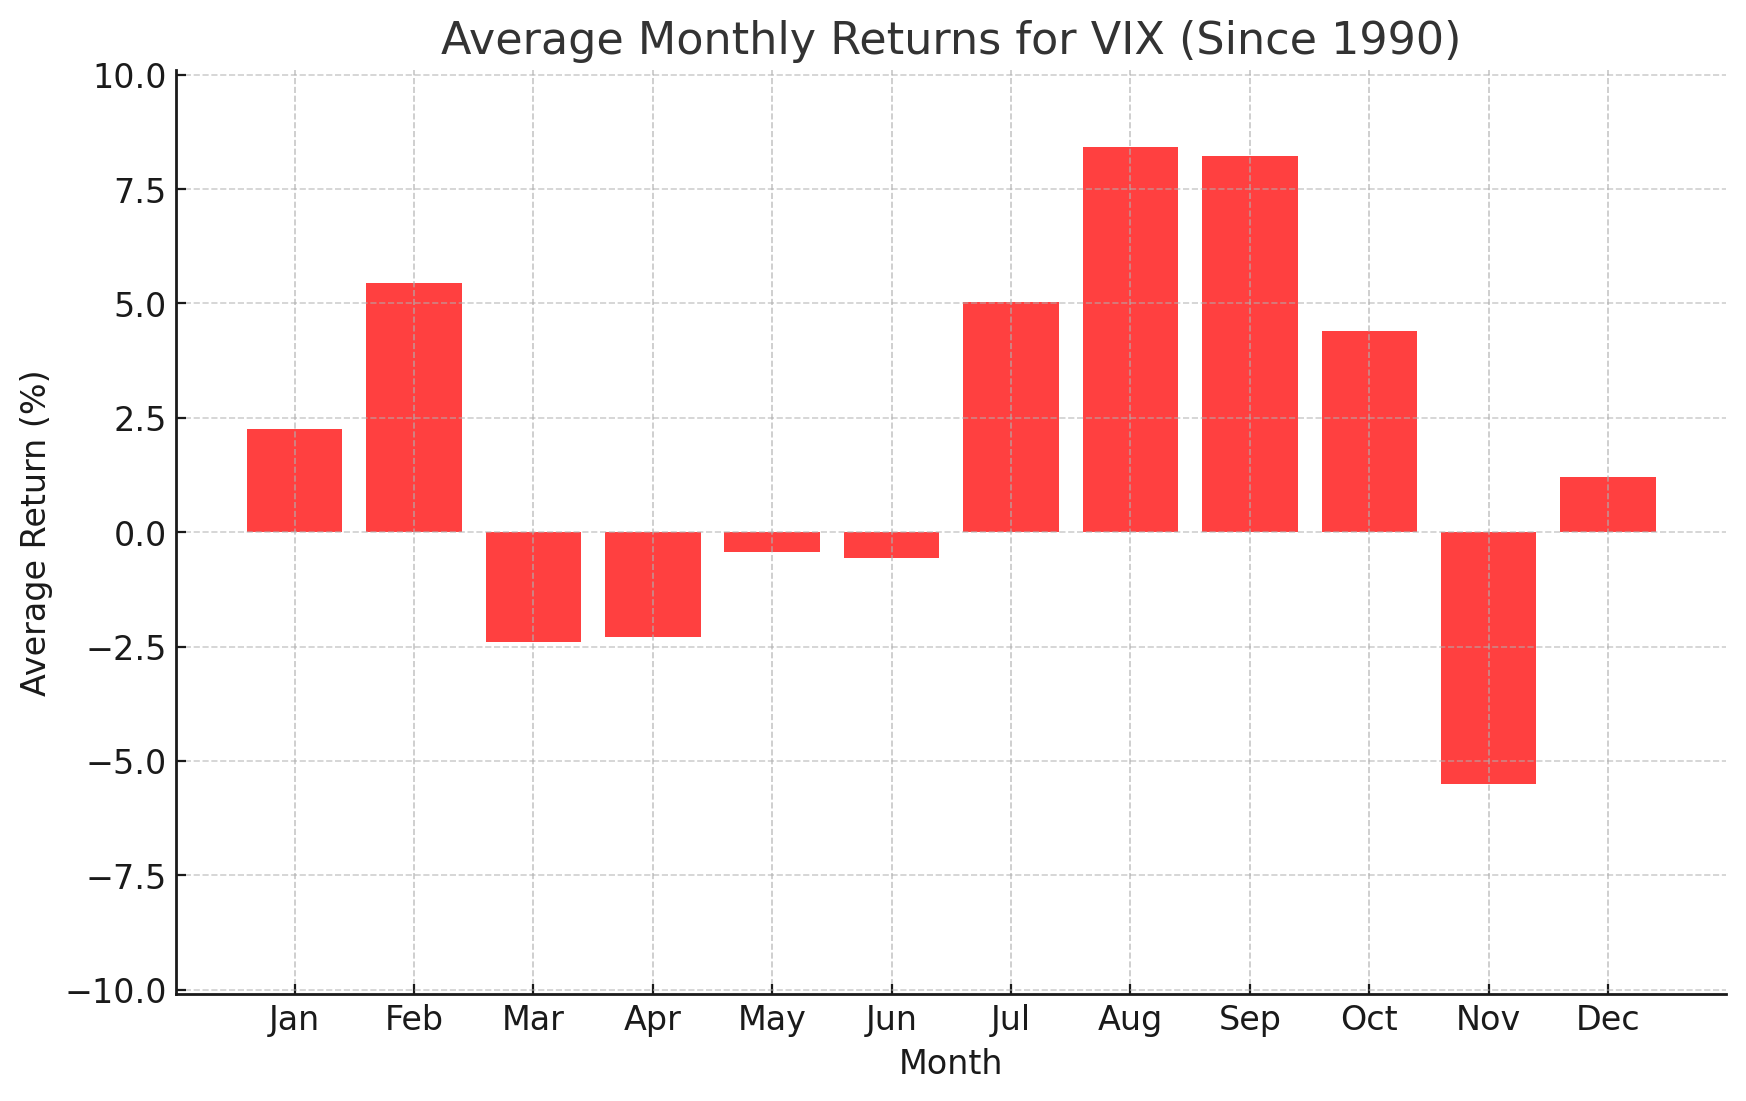
- December has historically been a month where stock market volatility edges higher, with the VIX index rising by an average of 1.2% since 1990.
- After a breakout from consolidation to start the month, the technical, fundamental and seasonal biases all point to the potential for more upside.
The beginning of a new month marks a good opportunity to review the seasonal patterns that have influenced the markets since 1990.
As always, these seasonal tendencies are just historical averages, and any individual month or year may vary from the historic average, so it’s important to complement these seasonal leans with alternative forms of analysis to create a long-term successful trading strategy. In other words, past performance is not necessarily indicative of future results.
S&P 500 Seasonality – S&P 500 (Price-Only) Chart
 Source: TradingView, StoneX. Please note that past performance is not necessarily indicative of future results.
Historically, December has been a strong month for US stocks, with the broad S&P 500 index sporting an average (price-only) return of +1.3% over the last 35 years. After a mid-month swoon, November finished essentially flat, keeping the post-Liberation Day uptrend intact heading into December. With little on the earnings front this month, the focus will be on (delayed) macroeconomic data and the FOMC meeting on December 10, where a 25bps interest rate cut is widely expected. One other factor to monitor is the potential for a “Santa Claus Rally,” a topic I recently discussed on the Trading Global Macro podcast with John Kicklighter.
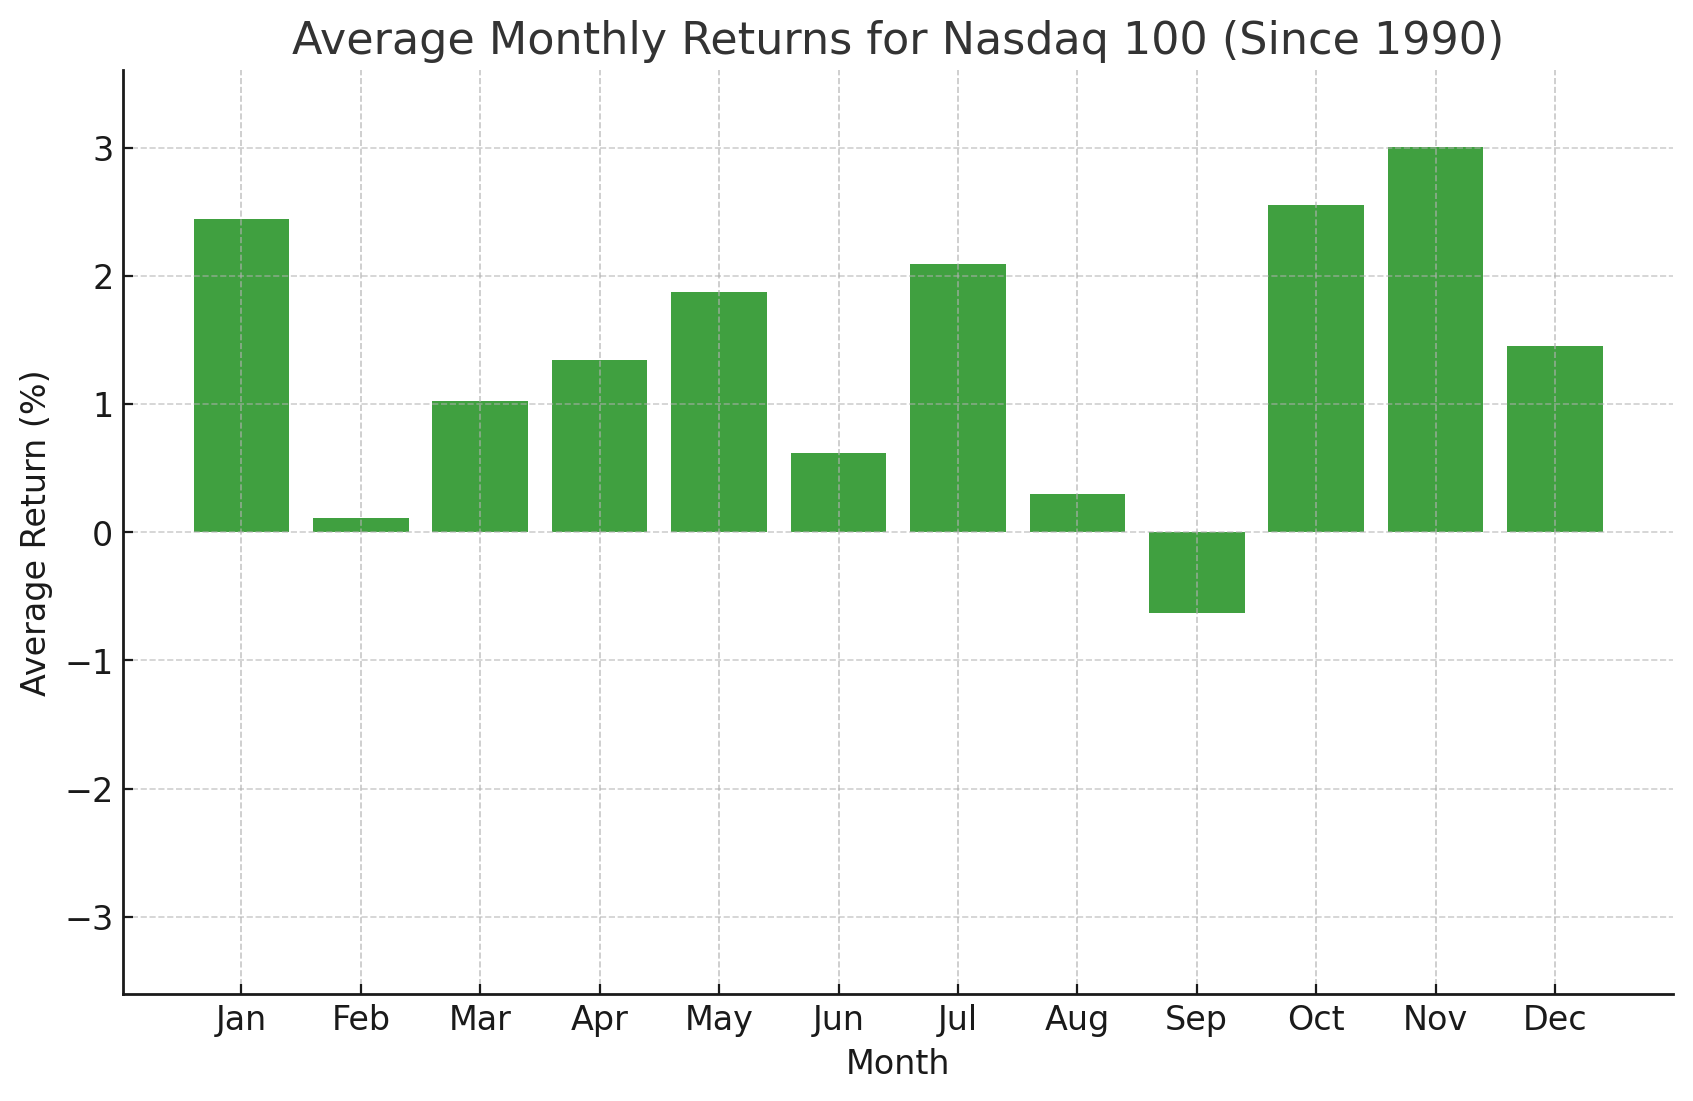
Nasdaq 100 Seasonality – NDX (Price-Only) Chart
Source: TradingView, StoneX. Please note that past performance is not necessarily indicative of future results.
Looking at the above chart, the Nasdaq 100 has historically seen solid performance in December, to the tune of an average gain of +1.5% since 1990. Like the S&P 500, the Nasdaq 100 saw an intra-month dip in November before rallying to close near unchanged levels. While AI standard bearer Nvidia pulled back sharply last month, other Magnificent 7 stocks like Apple and Google/Alphabet have picked up the slack in a leadership rotation within the same AI theme.
Volatility Index Seasonality – VIX Chart
Source: TradingView, StoneX. Please note that past performance is not necessarily indicative of future results.
December has historically been a month where stock market volatility edges higher, with the VIX index rising by an average of +1.2% since 1990. Similar to October, the VIX spiked to nearly 30 midway through November but quickly fell back toward its recent average in the mid-teens by the start of December. Looking ahead, the potential for a geopolitical-related spike in volatility remains ever-present, but markets have shown resilience in driving volatility back lower on any near-term surges, and until that dynamic changes, the VIX may remain at a generally low level.
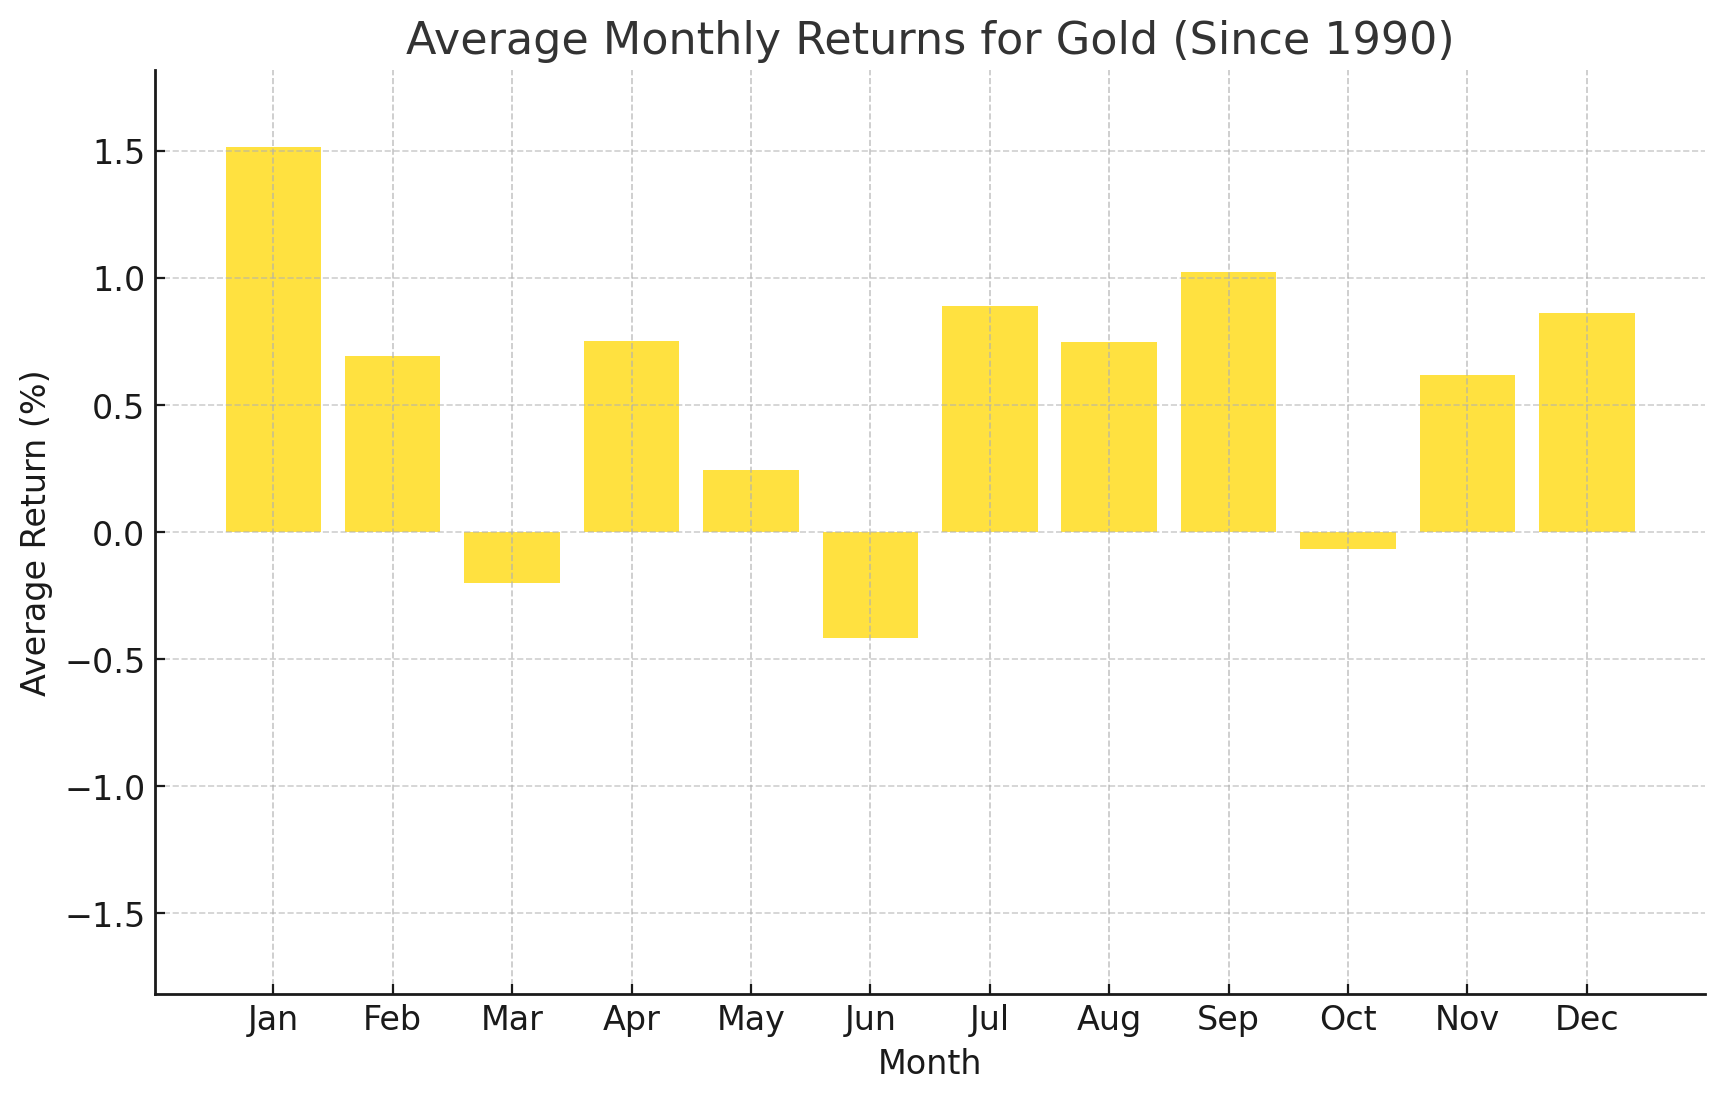
Gold Seasonality – XAU/USD Chart
Source: TradingView, StoneX. Please note that past performance is not necessarily indicative of future results.
Turning our attention to commodities, December has historically been a solid month for gold performance, with an average gain of +0.9% going back to 1990. Gold broke out of a symmetrical triangle consolidation pattern to start December, providing clear alignment between the technical, fundamental (central bank buying, “debasement” theme), and seasonal biases heading into the end of the year.
WTI Crude Oil Seasonality – WTI Chart
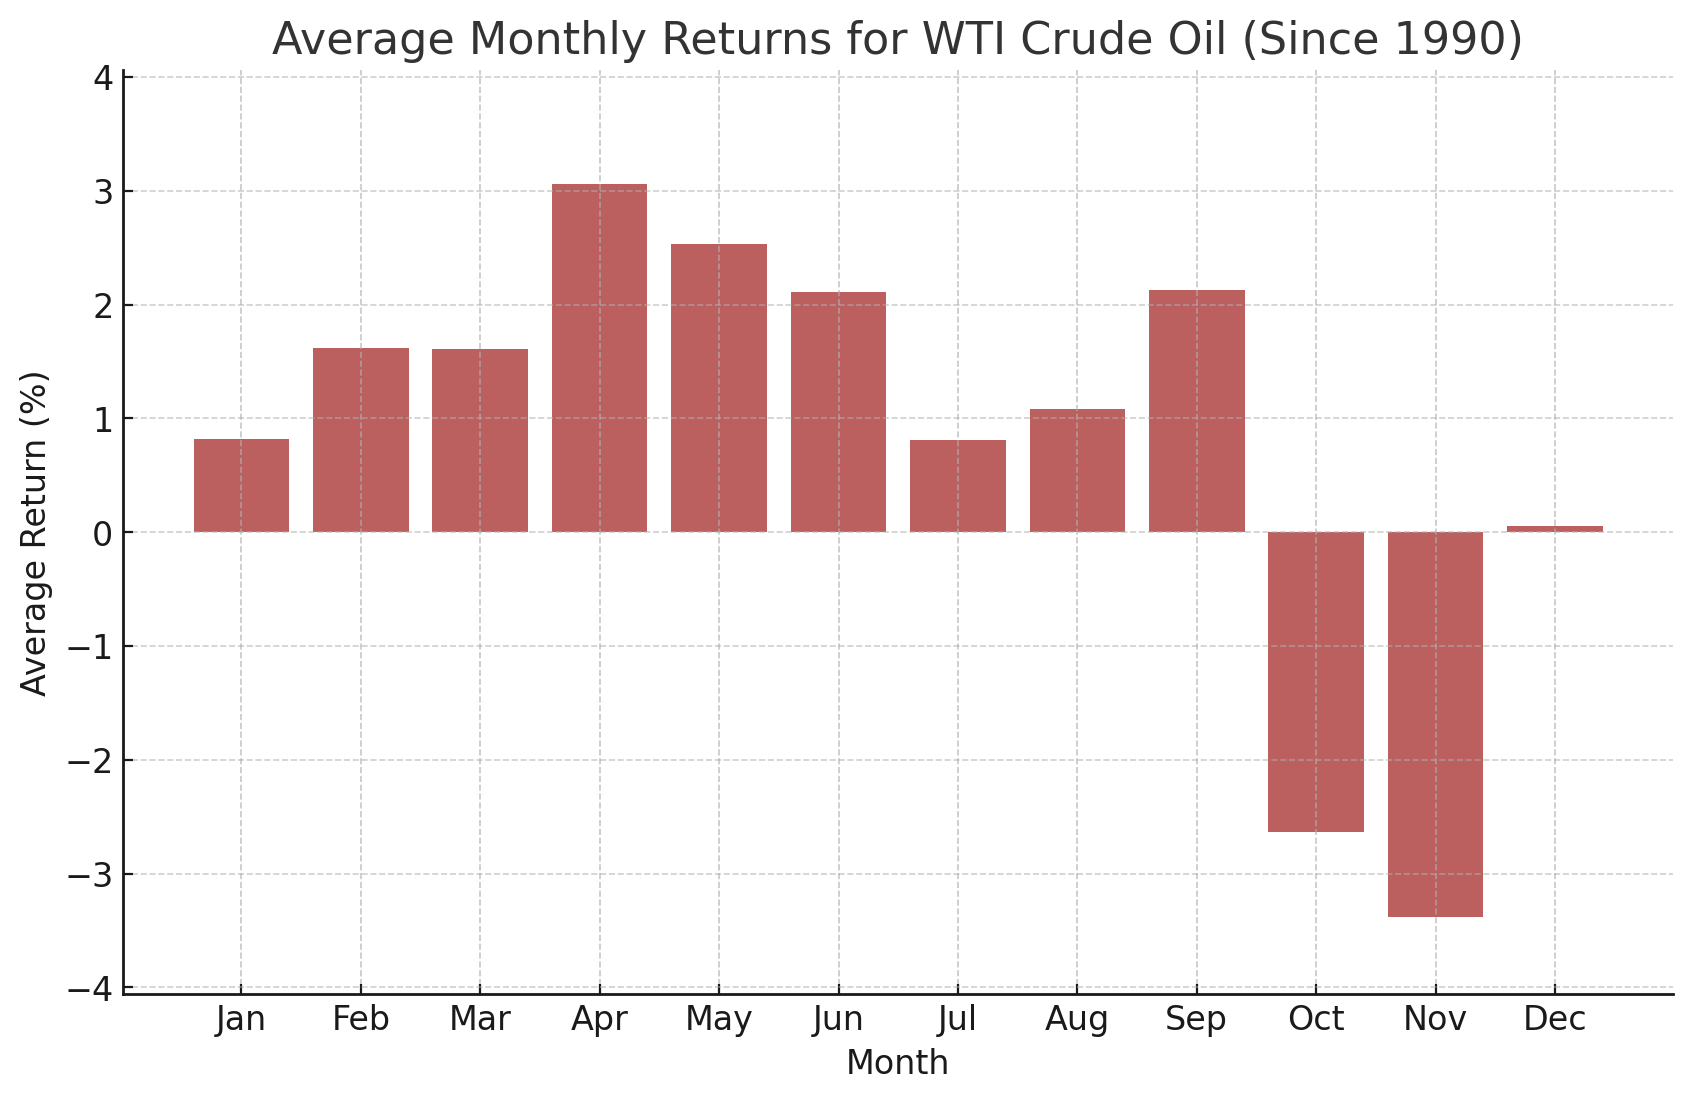
Source: TradingView, StoneX. Please note that past performance is not necessarily indicative of future results.
Last but not least, WTI Crude Oil has historically seen neutral performance in December, with an average gain of +0.1% over the last 35 years. Following its seasonal tendency, WTI fell meaningfully in November, leaving it just above the multi-year lows near the $57 handle. With oversupply expected throughout 2026, expect that level to be retested and potentially broken this month unless we see some substantial changes in the long-term supply/demand dynamics.
As always, we want to close this article by reminding readers that seasonal tendencies are not gospel so it’s important to complement this analysis with an examination of the current fundamental and technical backdrops for the major markets and the global economy.
-- Written by Matt Weller, Global Head of Research
Check out Matt’s Daily Market Update videos on YouTube and be sure to follow Matt on Twitter: @MWellerFX
The subsidiaries of StoneX Group Inc. provide financial products and services, including, but not limited to, physical commodities, securities, clearing, global payments, risk management, asset management, foreign exchange, and exchange-traded and over-the-counter derivatives. These financial products and services are offered in accordance with the applicable laws in the jurisdictions in which they are provided and are subject to specific terms, conditions, and restrictions contained in the terms of business applicable to each such offering. Not all products and services are available in all countries. The products and services offered by the StoneX Group of companies involve risk of loss and may not be suitable for all investors. Full Disclaimer. This content is not intended for residents of any particular country, and the information herein is not advice nor a recommendation to trade nor does it constitute an offer or solicitation to buy or sell any financial product or service, by any person or entity in any jurisdiction or country where such distribution or use would be contrary to local law or regulation. Please refer to the Regulatory Disclosure section for entity-specific disclosures. No part of this material may be copied, photocopied or duplicated in any form by any means or redistributed without the prior written consent of StoneX Group Inc. The information herein is provided for informational purposes only. This information is provided on an ‘as-is’ basis and may contain statements and opinions of the StoneX Group of companies as well as excerpts and/or information from public sources and third parties and no warranty, whether express or implied, is given as to its completeness or accuracy. Each company within the StoneX Group of companies (on its own behalf and on behalf of its directors, employees and agents) disclaims any and all liability as well as any third-party claim that may arise from the accuracy and/or completeness of the information detailed herein, as well as the use of or reliance on this information by the recipient, any member of its group or any third party.
© 2026 StoneX Group Inc. all rights reserved.