

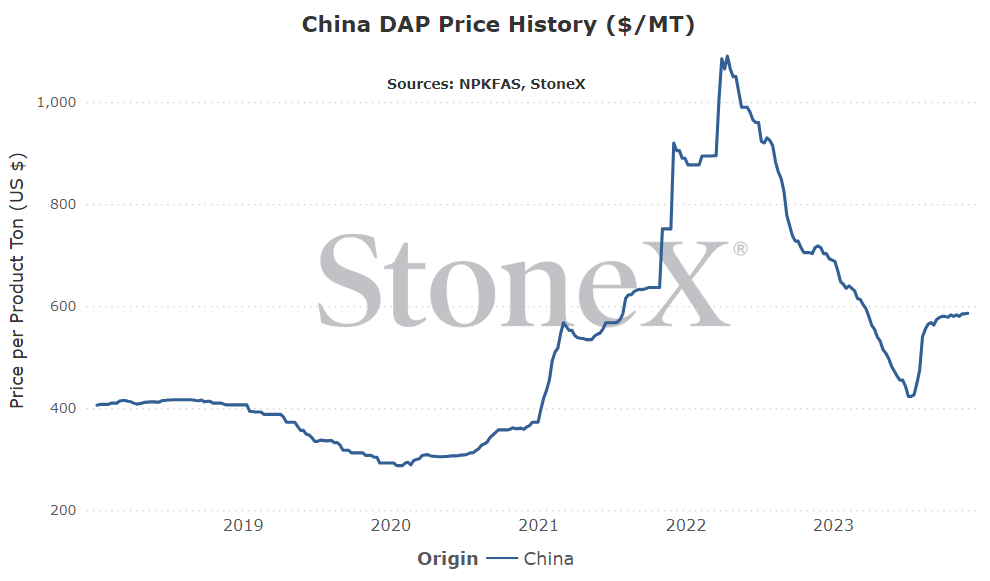
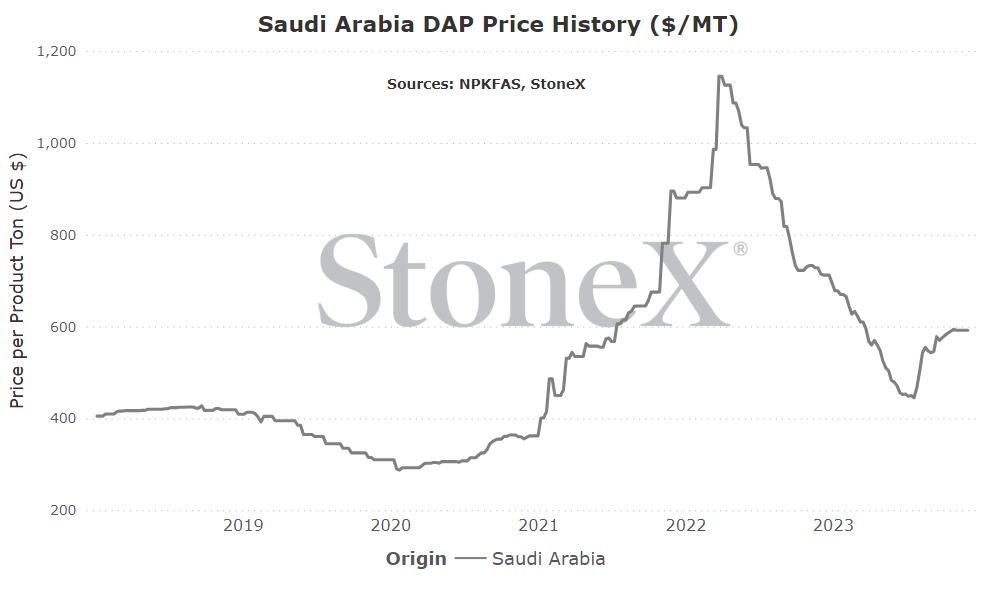
I will say this now and will say it going forward to eternity: these are the flat price graphs for each individual location. Your price where you are is going to be different. There are logistics. There is the cost of storage/interest/insurance/etc. These graphs should not be taken as "it shows the price at $700, why isn't my price $700". These graphs should be used to give an appreciation for price movements.
All values are in metric tons and USD currency.
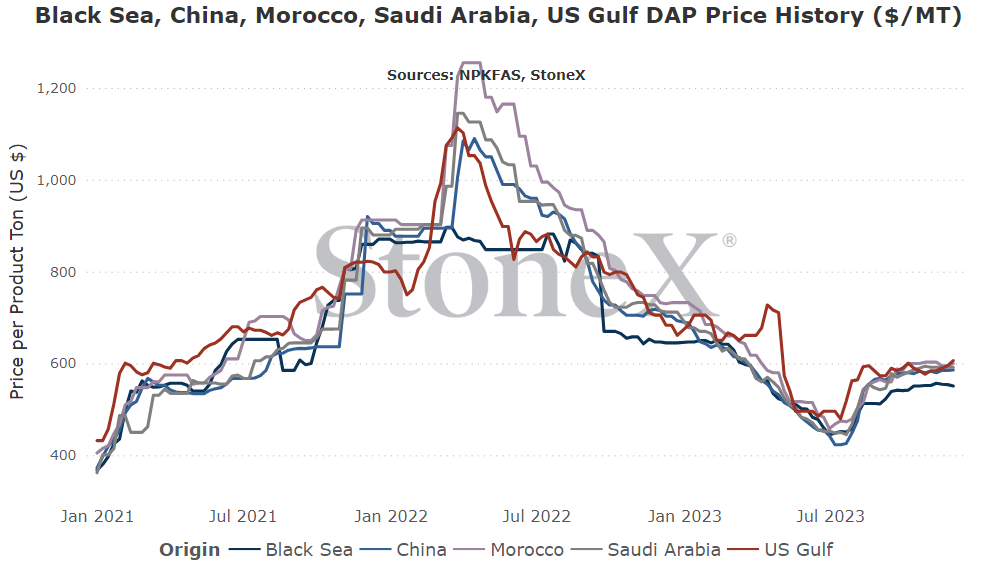
Global
I try to not do this very often but...it depends.
If we see the Chinese government leave phosphate exports alone and allow them to heal back to normal rates, I could see the global phosphate market start to drop. There is a lot of margin for manufacturers so it isn't as though a slight drop will cause them to shut down production. India demand could be in question following their ahead of average import pace for the last year plus and their government cutting phosphate subsidy rates. We could quickly see the scales tip bearish.
On the flip side, if restrictions by the government start being imposed, the S&D remains tight. There is a lot of demand coming that needs to prepare. Removing or reducing China would tighten the global S&D and put manufacturers in charge of price negotiations.
Given how high global values are right now, I still lean on the bearish side but it seems a toss up. Nothing like leaving a lot of the market direction in the hands of a government.
North America
I had to sit here for a few moments to make sure I was ok saying this: I lean bullish now thru spring.
Please know I hated writing that as much as you hated reading that.
- Current phosphate values are historically high.
- Current phosphate values are high vs most grains.
- North America is completing a solid fall run.
Unfortunately, I think the S&D remains very tight.
- I think we just lost Russian imports and didn't gain anything in its place.
- Low potash values will continue to help offset high phosphate values.
- Only 3 months to refill the system before March application begins.
- Exports are allowed to continue.
- Continues to feel as though there are a lot of year end/beginning dollars to be spent on fertilizer.
I sure hope this is one that I am wrong about.
While the fertilizer futures market is far from as liquid as its grain counterparts, it is still active and gives us an insight into what the market is thinking.
Please note that the values below can and will change daily. This is merely a look at where they are as of writing:
| NOLA DAP | |
| January '24 | $552.50 |
| February | $552.50 |
| March | $555.00 |
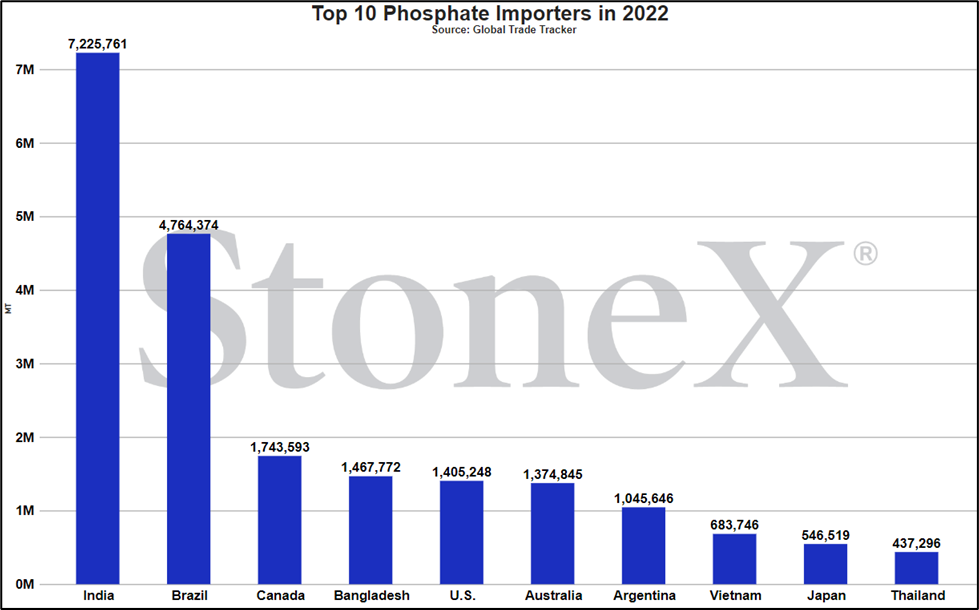
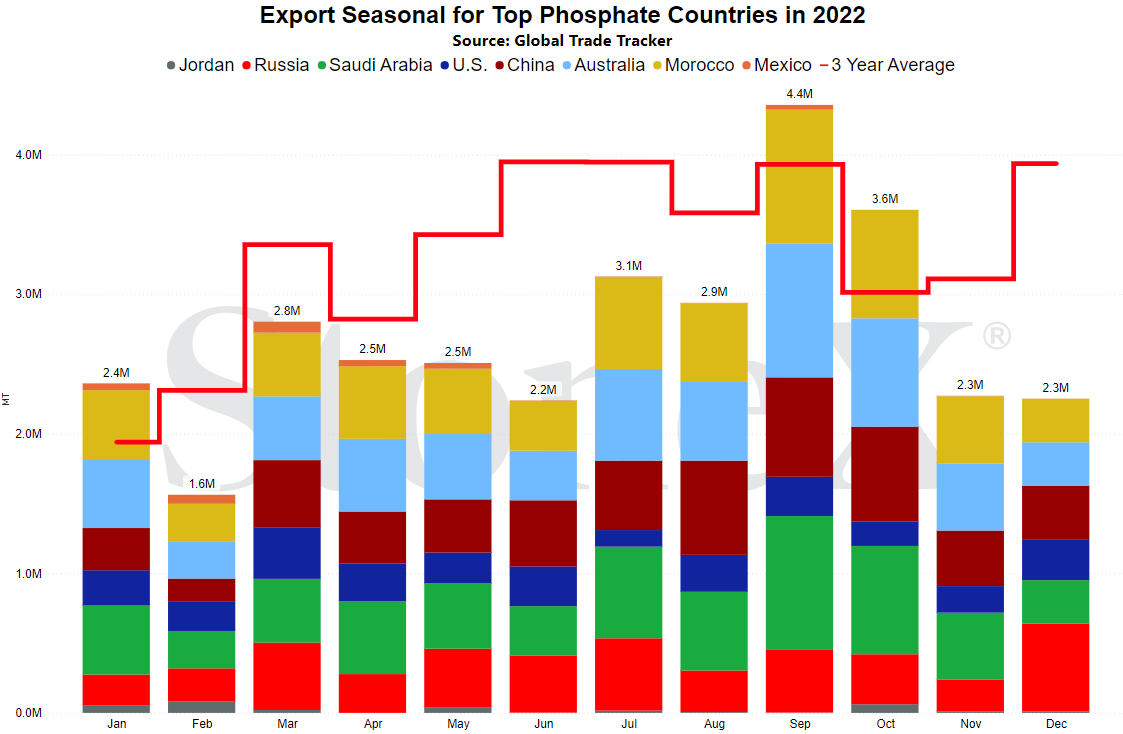
Chinese government taking hands on approach to fertilizers
This, so far, is much more of a urea story than it is a phosphate story...but that doesn't mean phosphate shouldn't be worried.
The Chinese government has started to step in and ultimately regulate the number of tons of urea that can be exported. Rather than letting free markets find equilibrium, they have decided to control the export pace in an attempt to maintain big supplies available to Chinese farmers at a discounted price. My interpretation is that they hope by stopping exports, they will flood Chinese urea stockpiles and force prices lower.
As mentioned, this has only been announced for urea but you do not have to make a lot of argument/points to say that phosphate could be next. Global phosphate values have done the least amount of work (especially when compared against urea) in terms of resetting from 2022 high's. If they can justify meddling in the urea export market, who is to say they will not do the same on phosphate and as the typical world's leader in DAP/MAP production and exports, that makes a difference.
I'll end with this. There HAS NOT been an announcement that they are restricting phosphate exports. This is merely a high priority watch point.
U.S. import duties change...outlook worsened
The U.S. countervailing duty saga continues to drag on for North America.
A very long story short:
- Summer of 2020, NOLA phosphate values dipped below cost of production for some N.A. manufacturers.
- In response, a U.S. based phosphate manufacturer applied for countervailing duty rates to be applied against Moroccan and Russian produced phosphate.
- They eventually won that case.
- Morocco stopped coming
- All but one Russian company stopped coming
There has been a fight ever since by the industry to remove these duties. Some have incorrectly argued that phosphate values skyrocketed directly as a result (global values rose as well). Others argued that production was not keeping up with demand but poor demand due to poor weather and high prices kept the S&D balanced.
Last spring and this fall, inventories got very tight and the call to drop has continued to grow. To a point, some of those hoping for change were rewarded with an annual review:
- Phosagro went from 9% to 26.5% which should effectively cut Russian supply routes
- Morocco went from 19.97% to a shocking 2.12% which many believed would "turn them on" again.
So if we are getting Moroccan flows back, why did the outlook worsen? This is due to our belief that Morocco will continue holding out for a 0% duty rate.
In the last 3-years, Morocco has developed demand relationships around the world after "losing" North America. Because the U.S. duty dropped to 2.12% does not mean those relationships were lost. Morocco has been arguing that the rate should be 0% and maintain that view. If the rate dropped and they suddenly start importing 500K in the next 4-months, how does that look? Not very good. The review bodies could say "well, they are bringing in a lot of stuff so the 2.12% rate works.". However, if they remain near zero, it continues the argument for nothing.
This could change. Keep in mind that my belief that they will not come is just that...my belief. Unfortunately, I'm not the only one in this camp.
Those that are hoping for phosphate price/availability relief before spring may be sorely disappointed. It seems as though N.A. supplies are going to remain very tight. I cannot stress this enough: talk to your retailer/supplier sooner than later. If this continues, spring could be tough.
North American fall season coming to close...indications of solid demand
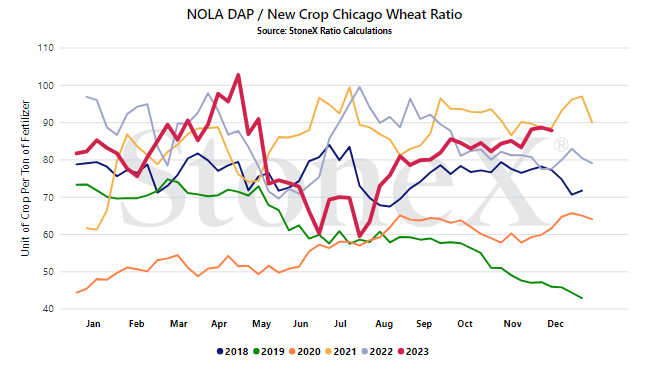
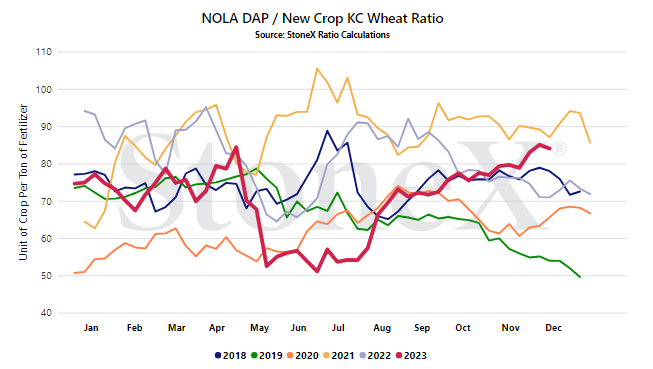
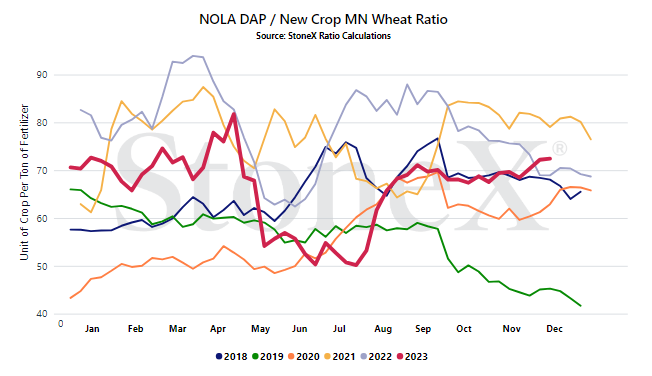
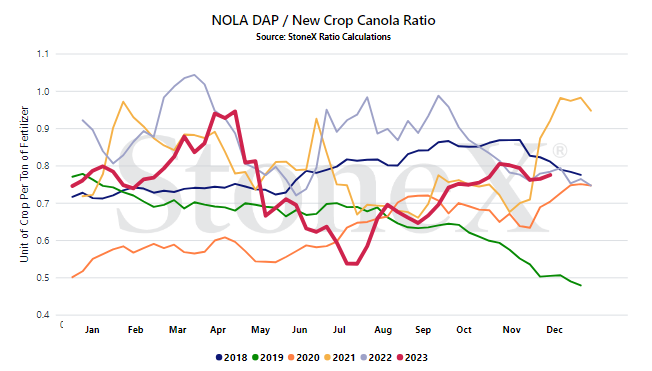
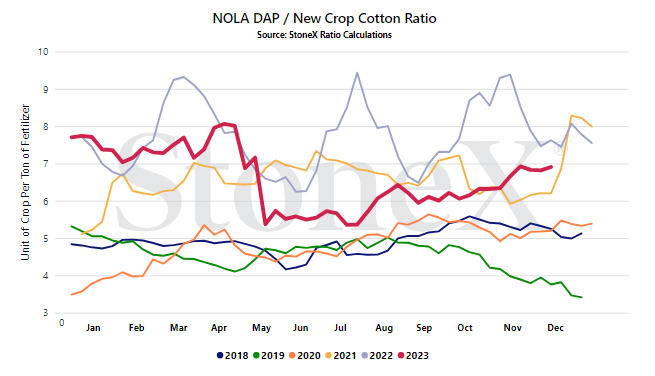
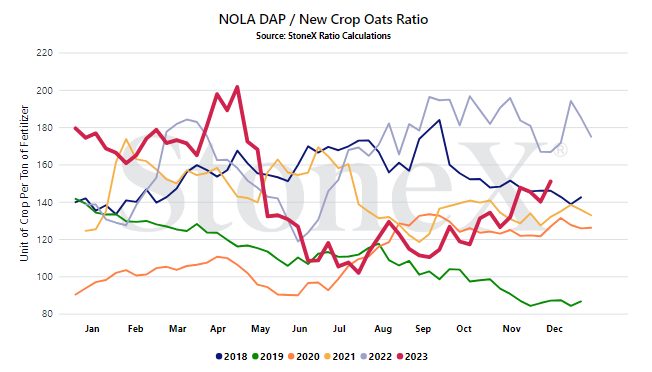
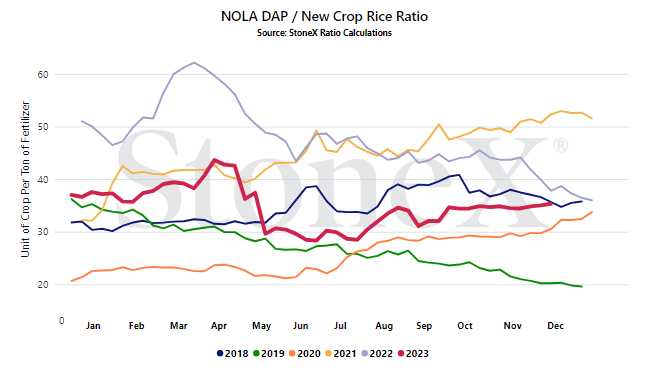
While it is far too soon to start calling the finishing touches on fall season, there are a lot of indications pointing to a really good run. That runs in the face of a phosphate market that is overpriced vs grains but we think potash had a lot to do with that. Phosphate on its own would likely have met a lot more resistance. Look below at all the ratio charts. They are in the middle to high end of the ranges. Perfect territory for demand to push back. However, a lot of farmers put on their phosphate along with their potash. Everyone is different but several that I know are not going to pay to apply potash now...and then pay to put another application of phosphate later! Potash values have remained attractive thru the fall. When looked at together, it was so so. Not too high for demand to push back. As a result of that and decent weather, it got done.
So now we have to look forward. If we emptied the system, we have to think about spring...and there isn't a lot of time between now and March. Only 3 months. Plenty of time for me to whine about the cold/snow/ice, but not much time to refill the phosphate system. The big fall run certainly helped to alleviate some of the stress of spring, there is still plenty of demand to come as we continue to expect 92M acres of corn.
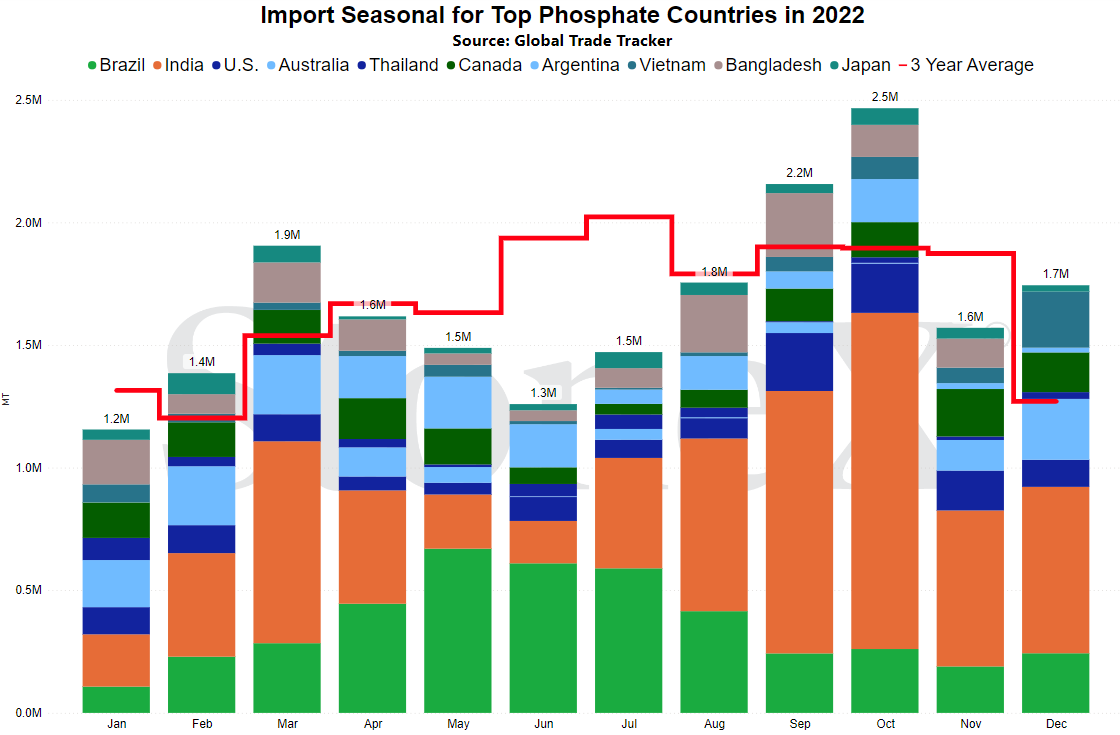
Hopefully we will see things loosen in the next month or two. Production in North America is doing better (reportedly) than it was this summer. Imports thru July/August/September were ahead of the 3-year average while exports were about 250K less (typically 750K) during the same period. This is far from solving the issue, but it doesn't help soften the blow.
Where is phosphate vs the summer low's?
Obviously there are a lot of different points around the world that we can do this comparison with. You can go below and get a sense for many of the export points. I'll focus on the demand side:
- Midwest U.S. DAP
- Summer low's - mid-July around $525
- Current values - approximately $635...and due to climb with today's barge trade
- 2022 high's - $1,025 March/April
- Brazil
- Summer low's - mid-July around $430
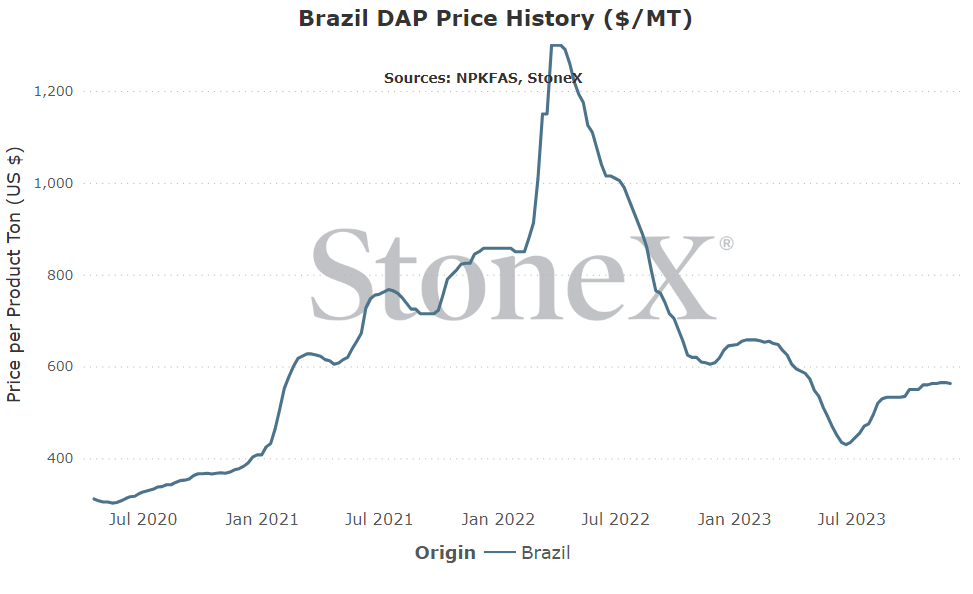
- Current values - approximately $560 - $565
- 2022 high's - $1,300 March/April
- India
- Summer low's - mid-July around mid-$430's
- Current values - near $600
- 2022 high's - $1,250 April
The interesting thing is that current values are still a shell of what they were in 2022. Still, the current ratios are not far from 2022. As we always talk about, this is why we talk about the input and output side of the ratio. When the high's of 2022 were being set, the next December corn price was anywhere from $6 to $6.75. Today, it is $5.10. You could have said that phosphate values were going to see prices tumble and had been absolutely correct...but the corn price hurt almost as bad.
I'm not going to say this is going to work for everyone but this is a strong example of why we think it is worth your consideration.
NOLA/New Orleans, Louisiana DAP price comparison
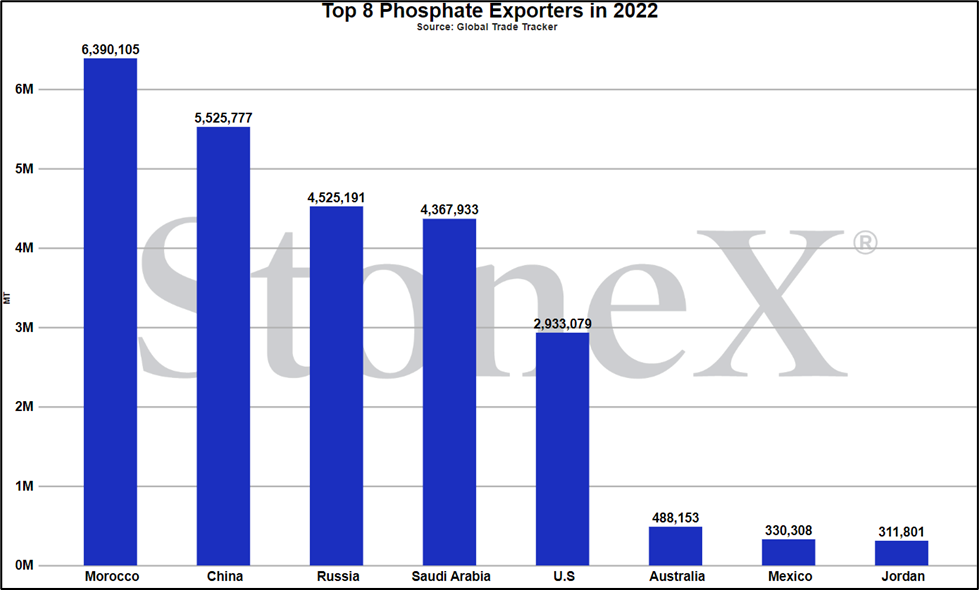
Number 5 global exporter in 2022
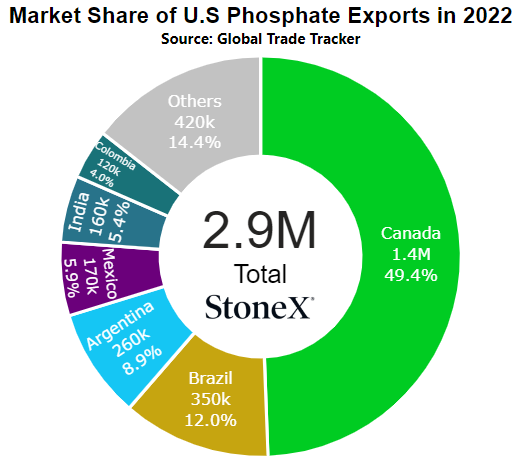
Price comparisons
Vs 30 days ago - +4% or approximately $20 higher
Vs 90 days ago - +6% or approximately $30 higher
Vs 6 months ago - +22% or approximately $100 higher
Vs 1 year ago - -14% or approximately $90 lower
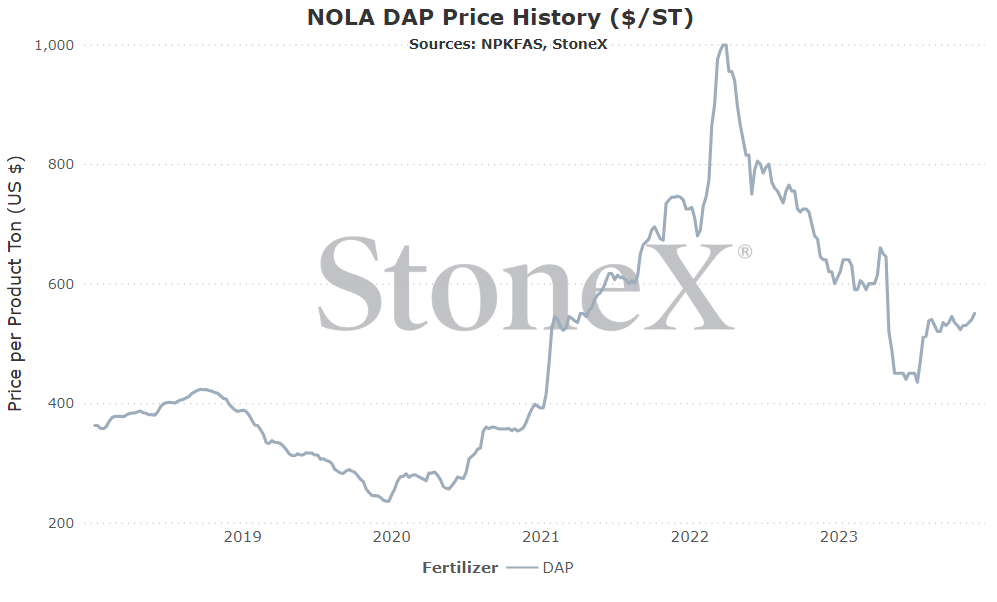
U.S. Midwest Average (using multiple points across Midwest) price comparison
Vs 30 days ago - -1% or approximately $8 lower
Vs 90 days ago - unchanged
Vs 6 months ago - -2% or approximately $13 lower
Vs 1 year ago - -17% or approximately $129 lower
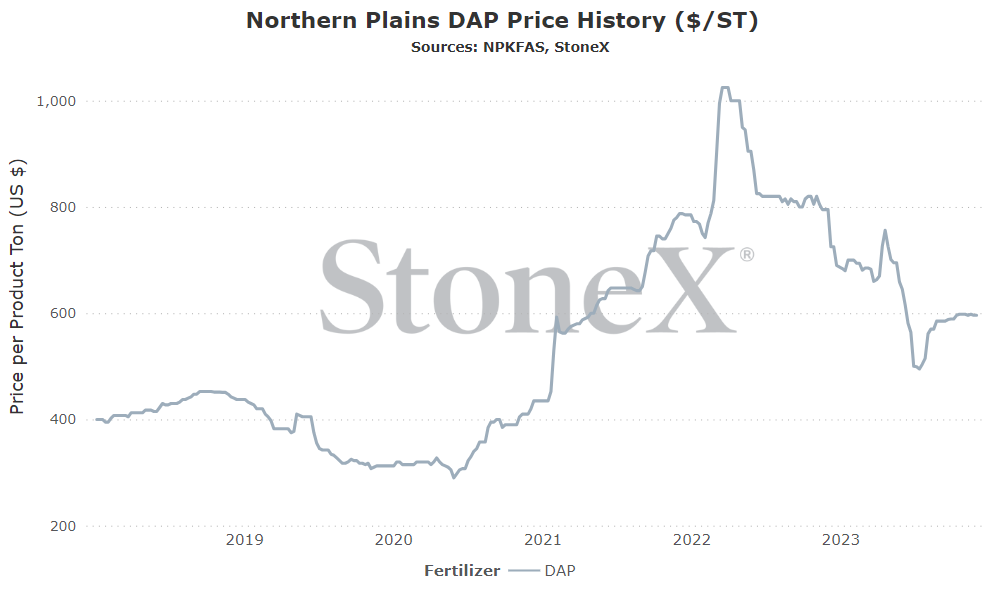
U.S. Northern Plains Average price comparison
Vs 30 days ago - unchanged
Vs 90 days ago - +2% or approximately $11 higher
Vs 6 months ago - -8% or approximately $49 lower
Vs 1 year ago - -25% or approximately $199 lower
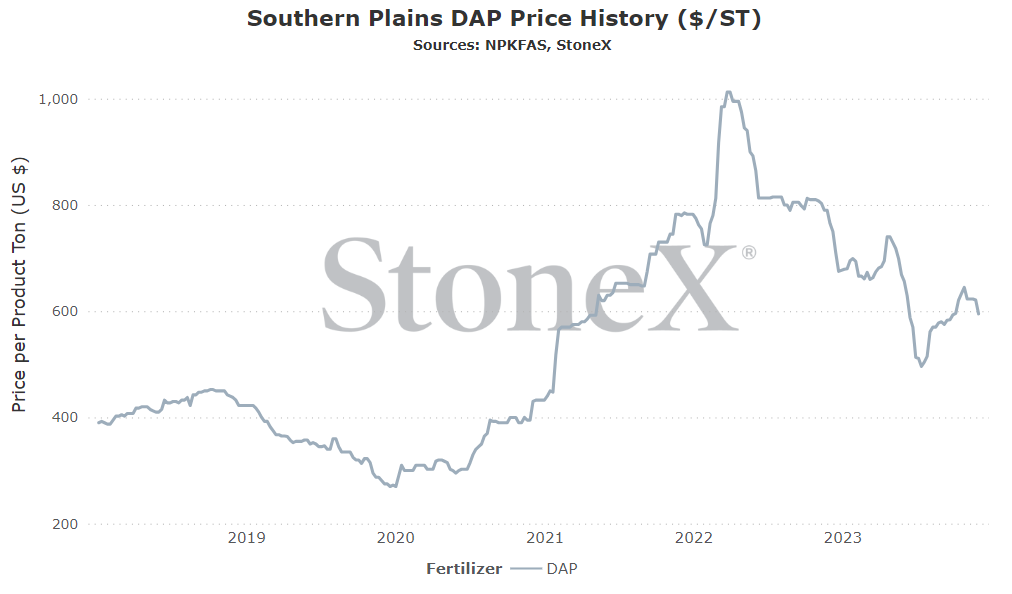
U.S. Southern Plains Average price comparison
Vs 30 days ago - -4% or approximately $28 lower
Vs 90 days ago - +3% or approximately $15 higher
Vs 6 months ago - -9% or approximately $61 lower
Vs 1 year ago - -22% or approximately $170 lower
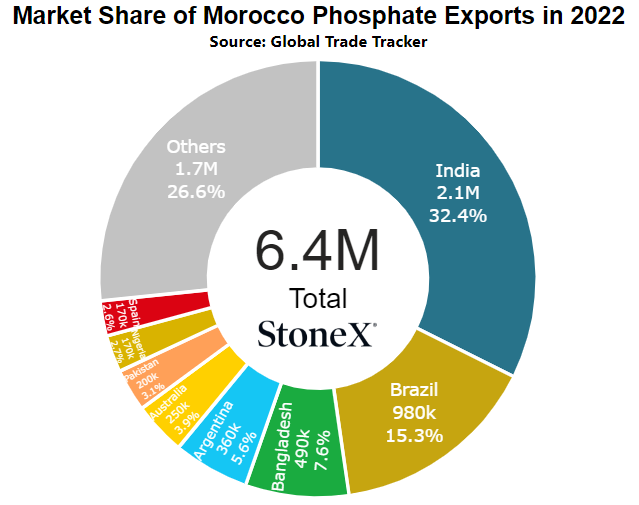
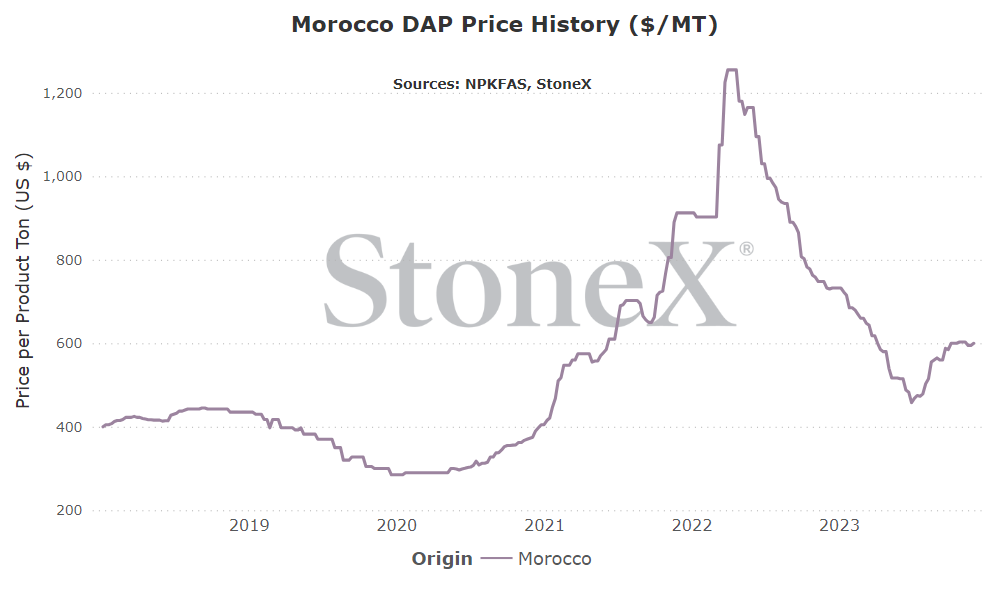
Morocco DAP price comparison
Number 1 global exporter in 2022
Price comparisons:
Vs 30 days ago - unchanged
Vs 90 days ago - +6% or approximately $35 higher
Vs 6 months ago - +17% or approximately $85 higher
Vs 1 year ago - -18% or approximately $133 lower
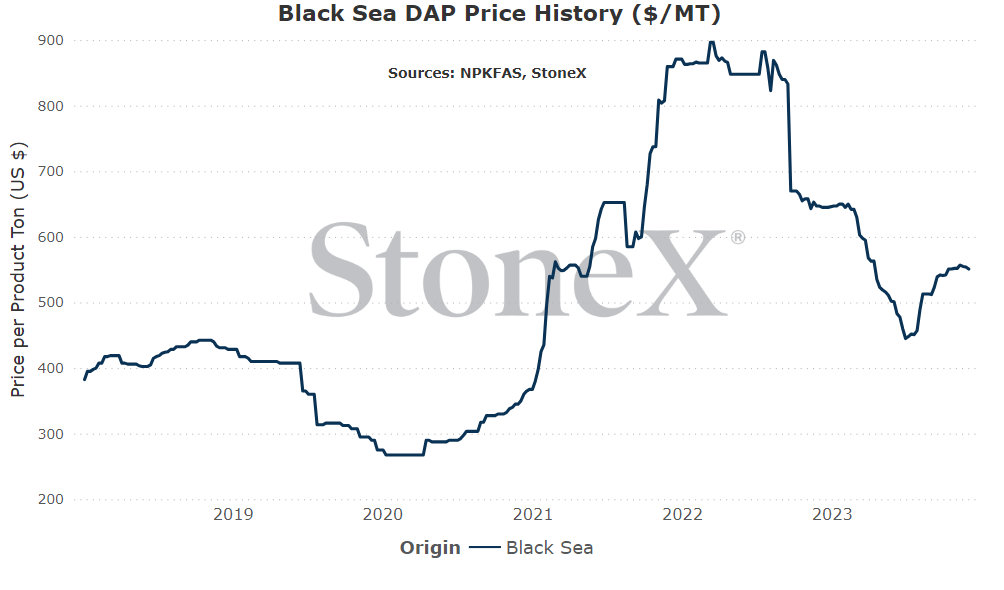
Black Sea DAP price comparison
Number 3 exporter of DAP/MAP in 2022
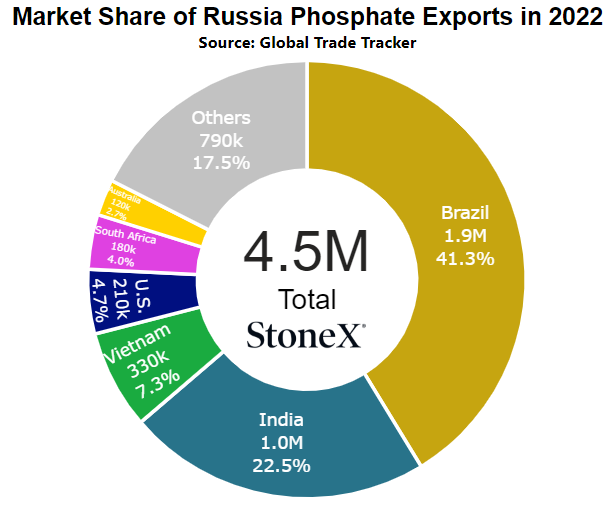
Price comparisons:
Vs 30 days ago - unchanged
Vs 90 days ago - +8% or approximately $39 higher
Vs 6 months ago - +10% or approximately $50 higher
Vs 1 year ago - -15% or approximately $96 lower
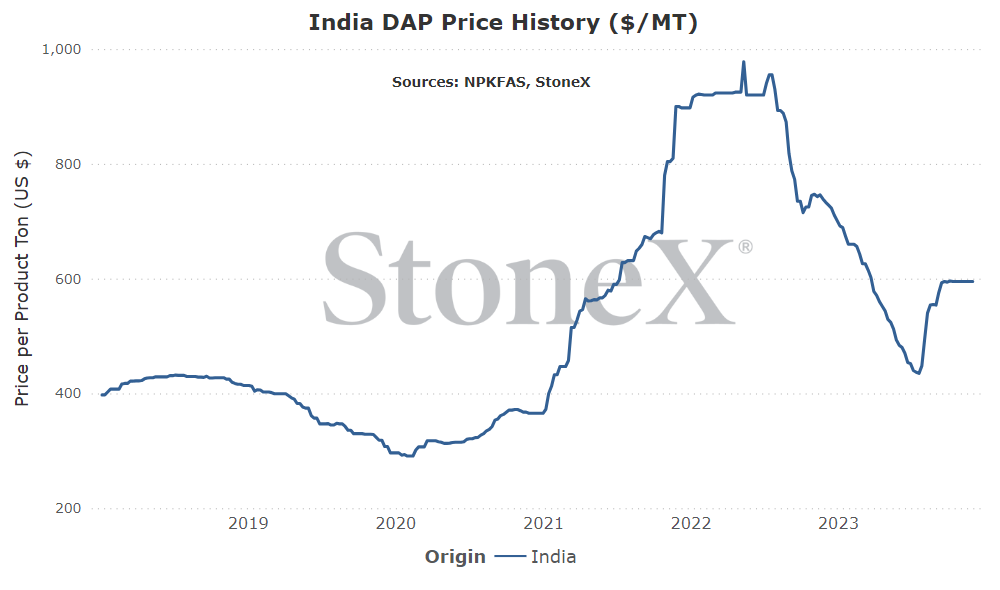
India DAP price comparison
Number 1 global importer in 2022
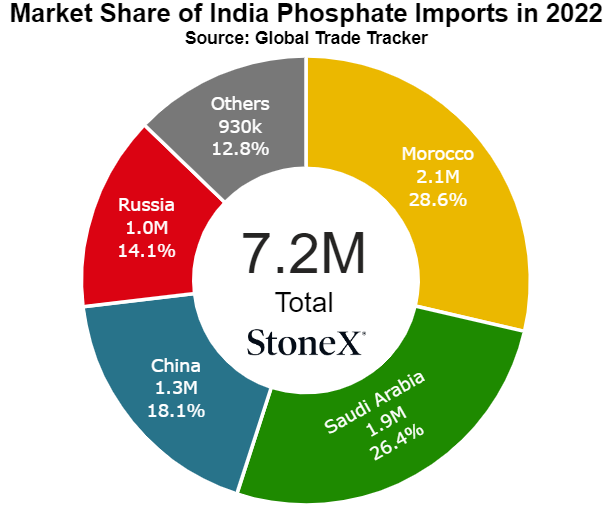
Price comparisons:
Vs 30 days ago - unchanged
Vs 90 days ago - +7% or approximately $41 higher
Vs 6 months ago - +23% or approximately $111 higher
Vs 1 year ago - -19% or approximately $138 lower
China DAP price comparison
Number 2 global exporter in 2022
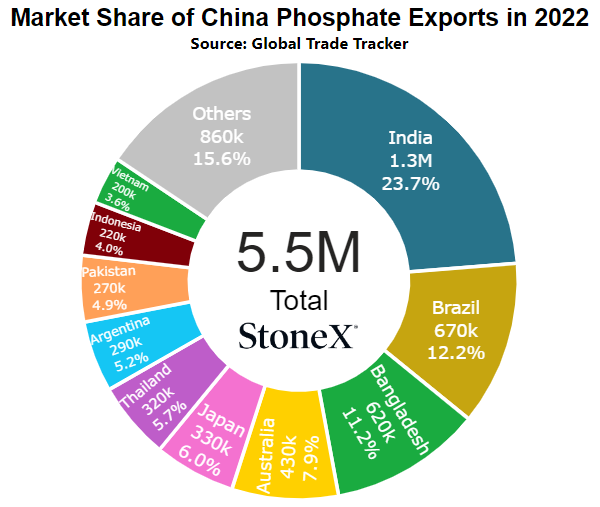
Price comparisons:
Vs 30 days ago - +1% or approximately $4 higher
Vs 90 days ago - +3% or approximately $19 higher
Vs 6 months ago - +24% or approximately $114 higher
Vs 1 year ago - -18% or approximately $129 lower
Saudi Arabia DAP price comparison
Number 4 global exporter in 2022
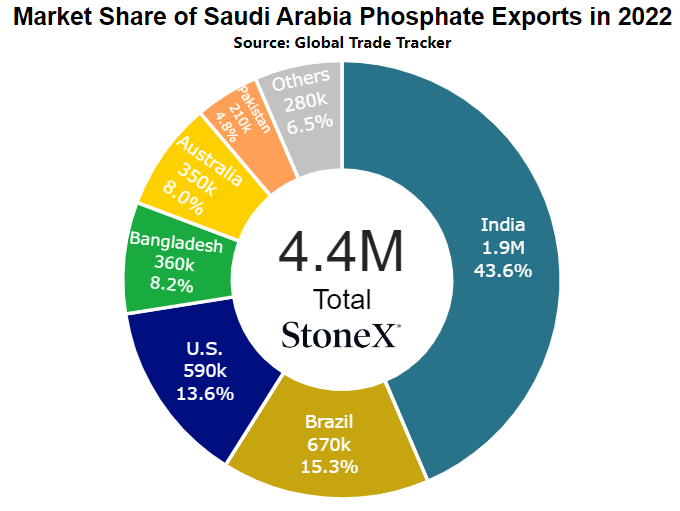
Price comparisons:
Vs 30 days ago - unchanged
Vs 90 days ago - +9% or approximately $49 higher
Vs 6 months ago - +24% or approximately $113 higher
Vs 1 year ago - -17% or approximately $123 lower
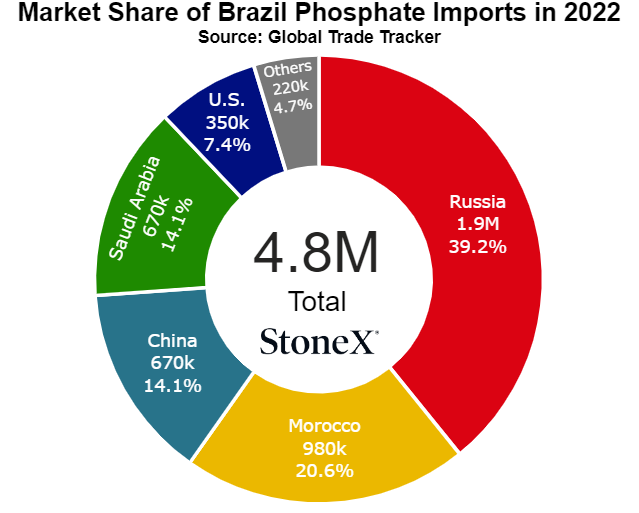
Brazil DAP price comparison
Number 2 global importer in 2022
Price comparisons
Vs 30 days ago - unchanged
Vs 90 days ago - +6% or approximately $30 higher
Vs 6 months ago - +20% or approximately $95 higher
Vs 1 year ago - -7% or approximately $45 lower
- Chinese government intervention – let's face it, most times any government in the world steps in to help...it rarely helps. When it steps in to "help" the world's largest phosphate exporter...you get the gist. If we see the central government impose restrictions like they are on urea, the world is going to get much tighter than it already is. I'm hoping this isn't the case but there is a reason I listed this one first.
- Big North American fall run – while not done, it does look like the fall was very good for North America. That should mean that warehouses are empty...and spring is just around the corner. The system will only have 3 months to get refilled in anticipation for that spring run. Not much need for suppliers/manufacturers to drop their prices.
- U.S. import duties hurt more than helped – what seemed positive has quickly turned negative from our perspective. The U.S. had been receiving phosphate from Russia with Phosagro's duty rate being sub-10%. Unfortunately, that was killed when they were moved to 26.5%. Many celebrated that we would see Morocco return with their rate dropping from 19.97% to a new low of only 2.12%. There is still a chance they return, but we are not expecting it to happen. They have plenty of sales opportunities around the world, especially with China struggling. Expect them to play for a 0% duty rate. That means imports have suffered.
- Current phosphate values are high vs grains – buyers/applicators of phosphate have to be thinking twice about phosphate at current values. At best, the grain ratios are middle of the road but most are on the very high side. At what point do farmers say enough is enough and push back by not spending money?
- Fears of next summer resets could have long positions nervous – of all the fertilizer products, phosphate has done the least to reset following March/April 2022 high's...and it looks like it is trying to push higher. I can tell you first hand that participants have a little voice in the back of their heads telling them do not wait to sell too long. Many were a part of the markets that fell apart in 2008 and again in the early 2010's. If one starts to break, others could follow.
- Perhaps Morocco comes to N.A. after all? – in the bull factors, I mentioned that we think Morocco largely ignores the N.A. market until the U.S. rate hits 0%. I've been wrong before. If they go ahead and start coming here, we could see participants get nervous and start selling hard to offload long positions.
We believe that only looking at the flat price of either grains or fertilizer can be misleading:
-
Only selling grain can hurt you if fertilizer prices rise substantially
-
Only buying fertilizer can hurt you if grain prices fall
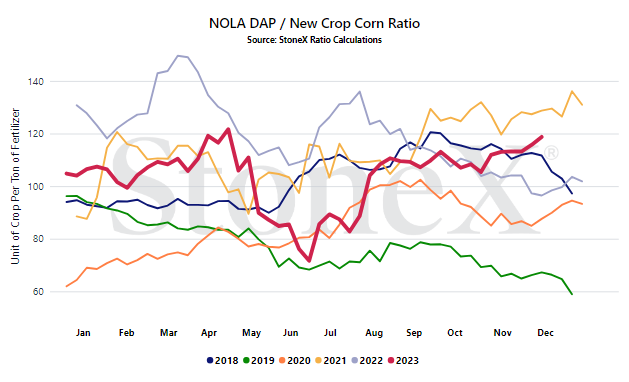
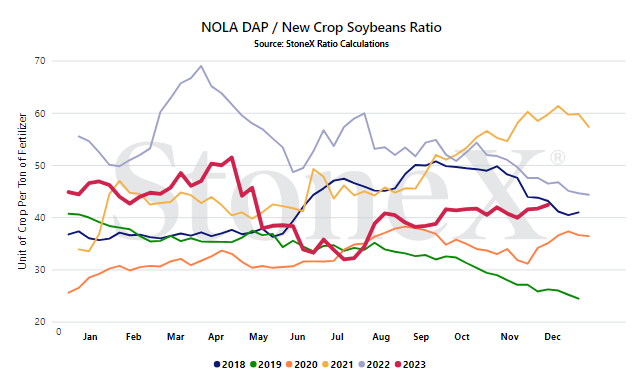
We look at the ratio "value" to get a better indication of where we are or how many bushels of X does it take to pay for 1 ton of fertilizer.
Would you rather:
-
Spend 150 bushels to pay for 1 ton of DAP
-
Spend 80 bushels to pay for 1 ton of DAP
When we compare the current ratio value against recent years, we start to see if we are high or low.
YOUR VALUES WILL LOOK DIFFERENT
This graph looks at the NOLA DAP price vs the flat grain price. There are no logistics on either product. Your location will look different due to fertilizer logistical costs, grain basis, etc.
- Chinese government possible intervention- as we have seen in the urea sector, the Chinese government can quickly swoop in and fundamentally change a fertilizer market...and can make changes when they see fit. While we haven't seen a definitive announcement regarding phosphate exports, it doesn't take much work to think one could be in the cards. If they start mandating lower export volumes, the world could remain tightly supplied.
- North American inventories - all accounts are pointing to a pretty darned good fall application run. That "should" mean that inventories are very low headed into December. That means logistics will be that much more stressed because we only have a 3-month period to get things refilled before March gets here.
- High phosphate price vs grains = possible demand destruction? - overall demand needs to continue to be discussed/watched. At least for North America, the price was not high enough to back off demand. However, that might have had more to do with the fact that potash values were solid and helped to offset phosphates high price. Other points around the world may not have the potash luxury. I'm not saying demand is going to get hurt...but it needs to be considered.
- Indian demand going forward - India has been ahead of their average for a while now in an attempt to rebuild domestic warehouses. We have been a believer that they would get full...eventually. Quickly found out that demand was staying ahead of the game as well. Could this be coming to an end? It sounds like the Indian government phosphate subsidy rate is getting cut, making it harder for farmers there to justify the price. If we see their demand cut back, it will have global effects.
StoneX Ratio Calculation
The ratio calculation is derived from Bloomberg historical grains values as well as fertilizer values from StoneX, NPKFAS, and Argus.
The calculation is simply dividing the fertilizer price by each grain price.
All data was sourced from StoneX unless otherwise noted.
This material should be construed as market commentary, merely observing economic, political and/or market conditions, and not intended to refer to any particular trading strategy, promotional element or quality of service provided by the FCM Division of StoneX Financial Inc. (“SFI”), StoneX Financial (Canada) Inc. (“SFFC”) or StoneX Markets LLC (“SXM”). SFI, SFFC and SXM are not responsible for any redistribution of this material by third parties, or any trading decisions taken by persons not intended to view this material. Information contained herein was obtained from sources believed to be reliable, but is not guaranteed as to its accuracy. Contact designated personnel from SFI, SFFC or SXM for specific trading advice to meet your trading preferences. These materials represent the opinions and viewpoints of the author, and do not necessarily reflect the viewpoints and trading strategies employed by SFI, SFFC or SXM. The FCM Division of StoneX Financial Inc., a subsidiary of StoneX Group Inc., is a member of the National Futures Association (“NFA”) and registered with the U.S. Commodity Futures Trading Commission (“CFTC”) as a futures commission merchant and commodity trading advisor. StoneX Financial (Canada) Inc. is currently registered as a Futures Commission Merchant or equivalent in all provinces of Canada and is a member of the Investment Industry Regulatory Organization of Canada.




