Key points for the Euro 2026 H2 outlook
- Euro EUR/USD enters the second half of 2026 testing a major multi-year support zone after failing at key resistance into the start of the year.
- The Federal Reserve's & ECB have turned more hawkish, but weaker growth prospects in the Eurozone may leave the policy outlook tilted in favor of the USD.
- EUR/USD is testing a critical technical inflection point that could determine whether the broader correction stabilizes or extends into H2.
- A sustained break below support would confirm a larger downtrend, while a successful defense could mark the beginning of a more meaningful recovery.
EUR/USD heads into the second half of 2026 at a critical crossroads, with the pair testing a major multi-year support zone just as the Federal Reserve adopts a more hawkish policy stance. Chair Kevin Warsh's first meetings have reinforced the Committee's commitment to restoring price stability, while markets continue to raise expectations for additional tightening later this year. Although the European Central Bank has also shifted in a more hawkish direction, the policy outlook continues to favor the U.S. Dollar, leaving EUR/USD at a pivotal technical and fundamental inflection point heading into H2.
Federal Reserve in the Spotlight
FOMC Summary of Economic Projections
Source: FOMC
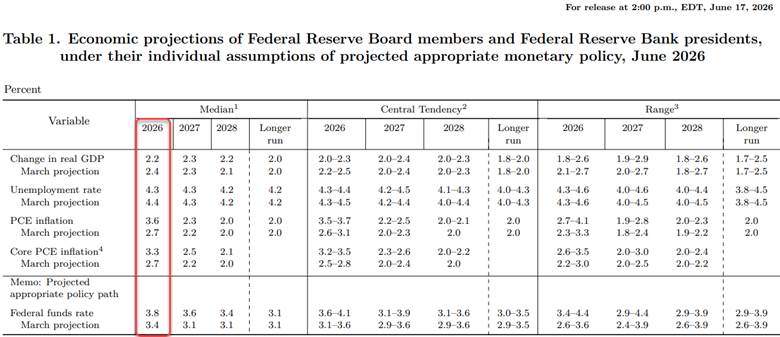
In June, the Federal Reserve left interest rates unchanged in a 12-0 vote, with newly appointed Chair Kevin Warsh unequivocally reaffirming the Committee's commitment to restoring inflation to its 2% target. The message comes as inflationary pressures continue to build, with core Personal Consumption Expenditures (PCE) rising to 3.4% y/y in May—the highest reading since October 2023. The Fed's latest Summary of Economic Projections (SEP) also included an upward revision to its inflation forecasts, suggesting policymakers view price pressures as more persistent than a temporary response to higher energy costs. Although the Committee downgraded its outlook for economic growth, a resilient labor market coupled with elevated inflation could ultimately force the central bank to resume its tightening cycle. The Fed’s median projected federal funds rate for year-end 2026 was revised to 3.8%, versus 3.4% in March and with inflation projected to remain above target for a fifth consecutive year, policymakers appear increasingly willing to prioritize price stability over concerns about slowing growth.
FOMC Interest Rate Dot Plot
Source: FOMC
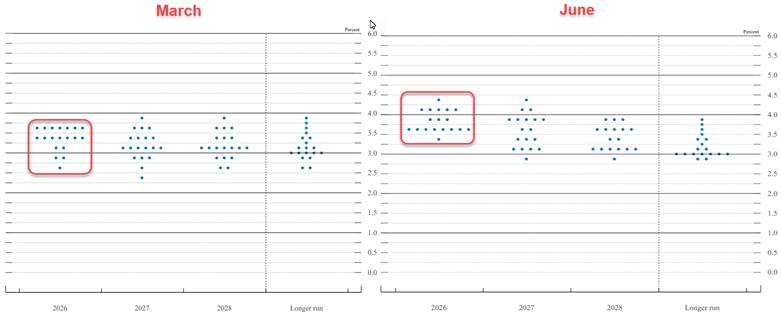
The updated interest rate dot-plot further reinforces this notion with six-members now expecting rates to be above 4% into the close of the year. Despite the narrative that President Trump’s appointee will lean dovish, the reality of the current market conditions and Warsh’s comments at the latest meeting suggest the central bank’s next move will be to raise rates. This hawkish shift in the monetary policy outlook has been a strong tailwind for the U.S. Dollar and keeps the inflation side of the mandate central focus for the USD bulls in the months ahead.
In his inaugural address to the markets, Chair Warsh also highlighted potential changes coming to the Fed with five new task forces created to examine central bank communications, the balance sheet, the use & reliance on existing data sources, productivity in the ear of AI transformation, and the Fed’s inflation frameworks. The removal of forward guidance and the shift to a shorter, more streamlined policy statement reflect Chair Warsh's effort to reduce the market's reliance on Fed communication and return monetary policy to a more data-dependent framework. By making policy decisions less predictable, the strategy seeks to restore the Fed's credibility following criticism of its communication during the last inflationary cycle.
Fed Fund Futures- FedWatch Tool
Source: CME
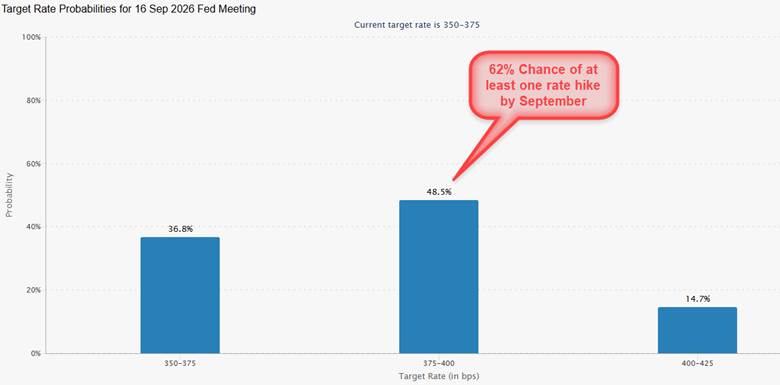
As such, markets are now pricing a 62% probability that the Fed will hike rates by at least 25 basis points by September. With the central bank policy statement clearly emphasizing, “The Committee will deliver price stability,” it seems tolerance for higher prices may finally be fading. The U.S. Dollar has been a beneficiary to the shifting rate outlook and the biggest risk for the bulls would be a batch of disinflationary reports. If prices stabilize at a faster clip than expected, the greenback could come under some pressure (EUR/USD could find a low) as expectations for higher rates ease.
More Hikes to Come From the ECB?
The European Central Bank raised interest rates for the first time since 2023 last month, reflecting growing concern over persistent inflationary pressures. While policymakers continue to emphasize a data-dependent approach and have avoided pre-committing to a specific policy path, recent communication has taken on a more hawkish tone. The Governing Council has acknowledged that upside risks to inflation have increased, even as downside risks to economic growth continue to build. Europe remains particularly exposed to energy price shocks and, although progress toward a U.S.-Iran agreement have eased oil prices, the potential for second-round inflationary effects have yet to be fully assessed.
While the hawkish shift in the both central banks have been on of necessity, the ECB may be in a more difficult position amid weaker growth prospects, and the interest rate outlook may continue to favor the USD in the medium-term. That said, the technical backdrop puts EUR/USD at a major inflection zone into the close June, and the focus is on whether the bulls can stabilize this recent decline heading into H2.
Euro Technical Outlook: EUR/USD Correction Tests Make-or-Break Support
Euro Price Chart – EUR/USD Monthly
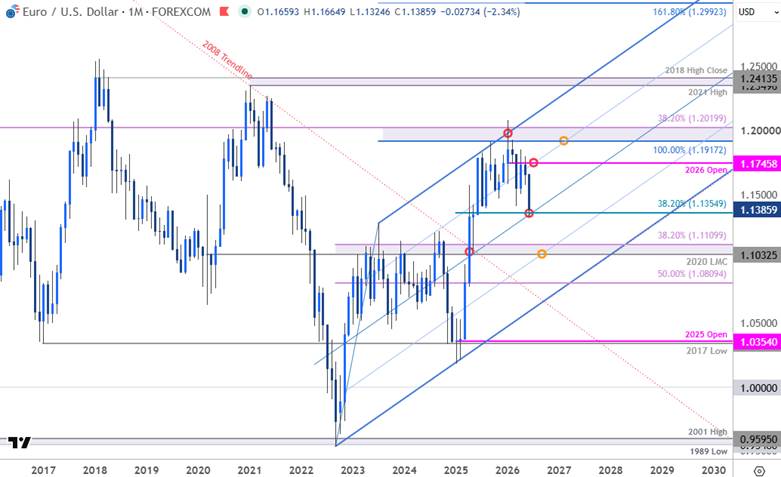
Chart Prepared by Michael Boutros, Sr. Technical Strategist; EUR/USD on TradingView
In our 2026 EUR/USD Q2 Outlook, we noted that Euro was, “in correction within the multi-year uptrend, and the outlook remains weighted to the downside heading into Q2. That said, the focus is on identifying a potential exhaustion low in the months ahead. From a trading standpoint, rallies should be limited to the 1.1775 IF price is heading lower on this stretch with a close below 1.1355 needed to fuel the next leg of the decline.” A 3.8% rally off the March lows briefly registered an intraday high at 1.1849 but could not secure a close above 1.1775. The subsequent reversal plunged to fresh yearly lows in June with the decline extending more than 4.4% off the April high.
The bears are testing confluent support into the close of Q2 at 1.1355/94- a region defined by the 38.2% retracement of the 2025 advance, the 2025 April high close, and the July low. Note that the median line converges on this threshold into the start of July and a break / weekly close below this slope would be needed to fuel the next leg lower / mark resumption of the 2026 downtrend.
Euro Price Chart – EUR/USD Weekly
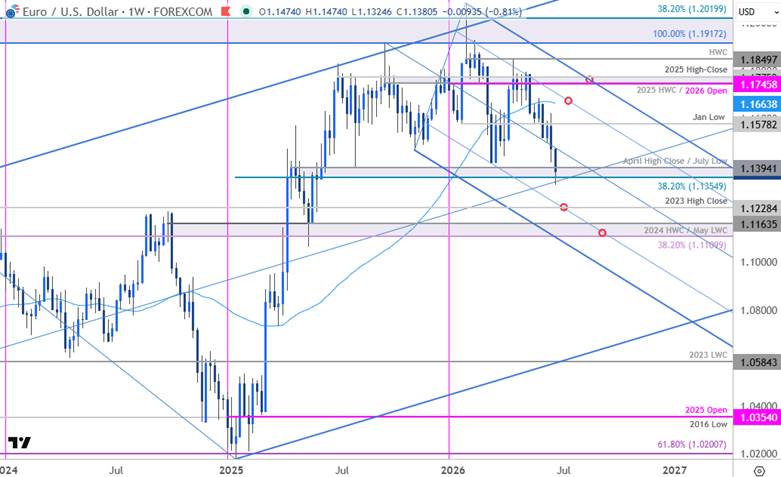
Chart Prepared by Michael Boutros, Sr. Technical Strategist; EUR/USD on TradingView
A closer look at the weekly chart shows EUR/USD continuing to trade within the confines of a descending pitchfork extending off the yearly high. Note that weekly momentum has fallen to the lowest levels of the year with RSI trading near 38. A break below this key pivot in price would threaten another bout of accelerated losses towards subsequent support objectives at the 2023 high close at 1.1228 and 1.1110/64- a region defined by the 38.2% retracement of the broader 2022 advance, the 2024 high-week close (HWC), and the 2025 May low-week close (LWC). Look for a larger reaction there IF reached.
Initial resistance is now eyed back at the January low at 1.1578 and is backed by the 52-week moving average near ~1.1664. Note that the 61.8% parallel converges on the yearly moving average next month and a breach / close above this slope would be needed to suggest a more significant low is in place and a larger recovery is underway. Ultimately, the bulls would need to clear the yearly open, the 2025 HWC and the 2025 high close at 1.1745/75 to reassert the long bias.
Bottom Line: The Euro correction is now testing confluent support at the median line of a multi-year uptrend. The risk / focus is on possible inflection off this zone into the start of Q3. From a trading standpoint, a good zone to reduce portions of short-exposure / lower protective stops- rallies should be limited to 1.1578 IF price is heading lower on this stretch with a close below 1.1355 needed to fuel the next major leg of the decline.
Inflation data will remain the key macro catalyst in the months ahead. For now, the outlook remains tilted in favor of continued U.S. dollar strength as markets price a more restrictive Fed. However, a sustained / surprise moderation in the pace of price growth could reduce the need for further policy tightening and a shift in the interest rate outlook could ultimately cap further USD gains. Simply put, an improving inflationary outlook will be the greatest threat for the U.S. Dollar bulls in the months ahead- stay nimble into the open of Q3 and watch the weekly closes for guidance.
--- Written by Michael Boutros, Senior Market Analyst
Follow Michael on X @MBForex