

The intention of the below graphs are not to use to say "my price should be X based on this graph". These prices are derived from an FOB price point average. The intent is to show major global price movement trends. Your values will likely have significant basis difference (similar to your local grain price being different than the traded market price).
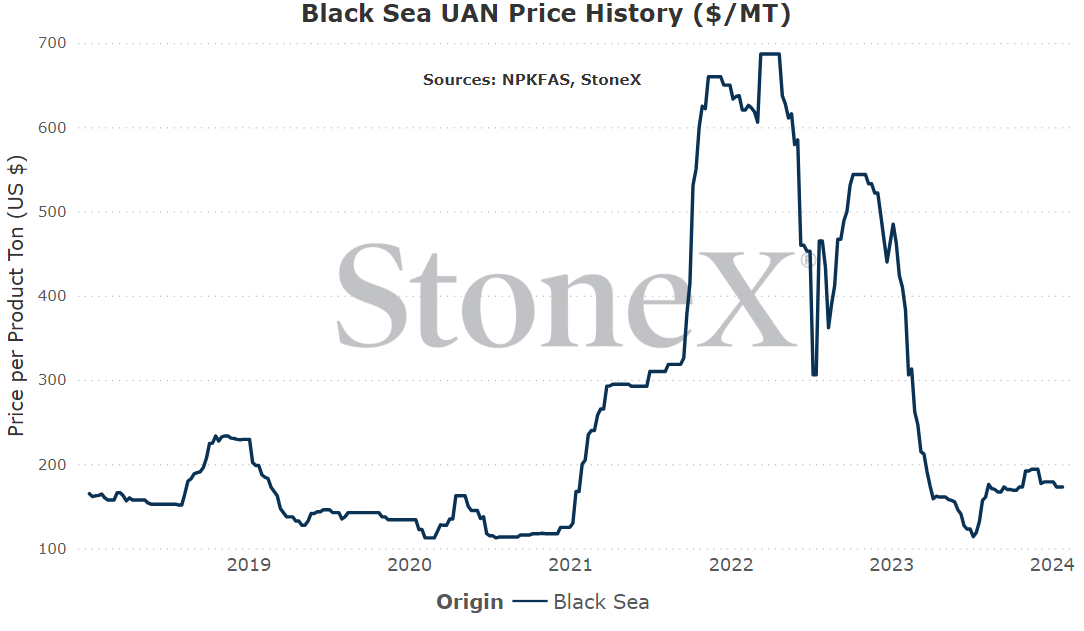
This graph is labeled as MT in USD currency.
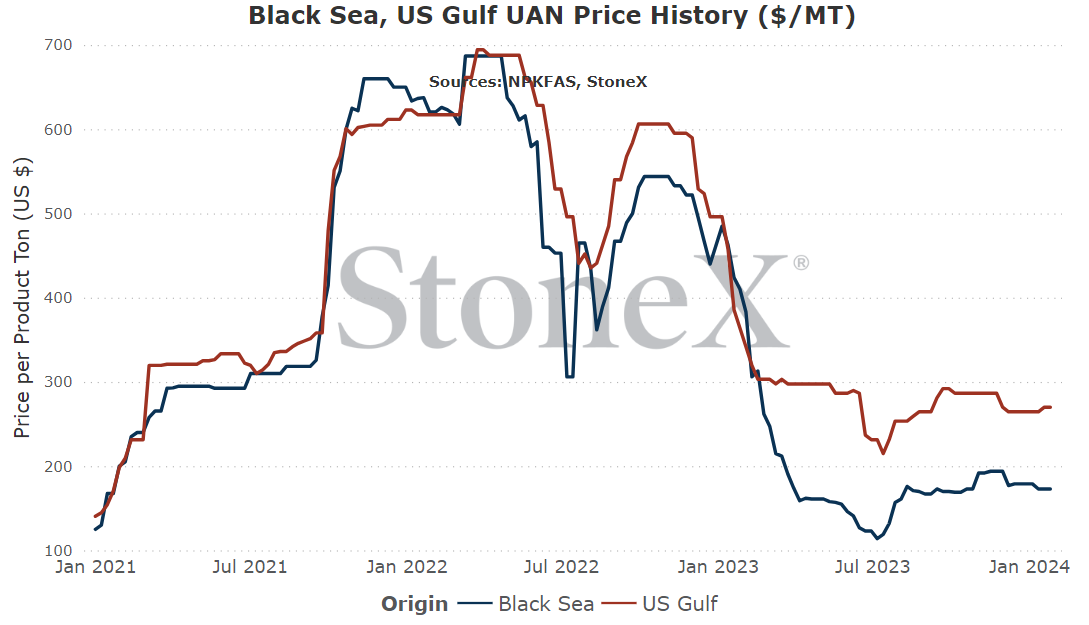
With global UAN values having been so boring the last month, it is really hard to be convicted to either the bull or bear side. However, there is a growing chance we see the rest of European nitrogen production restart which would reduce global demand/raise global supplies. On the flip side, we have application demand coming in a big wave that could/should lend price support.
There shouldn't be a lot of reasons for global values to change thru February but there should be price support moving into March/April/etc.
If nothing else, it is nice to see stability in the markets again.
Europe remains in focus
An update on the story that continues!
Dutch TTF values have remained under pressure and have now settled nicely into single digit territory! In recent weeks, winter months have settled in the $8 - $9MMbtu range. Far cry from the $103 that was set August 2022.
So offline nitrogen plants are looking at substantially lower input costs, but there has also been improvements on the output side of the equation. Urea values around the world have been hot with some areas up $50 - $100 from their year end/beginning lows. UAN values have not moved substantially. This is a great combo for the outlook...but we haven't seen definitive restarts.
Will we?
What I mean is that it isn't in the best interest of offline plants to "brag" about being online. Think about if you are a buyer around that facility. All of a sudden, the plant is churning out tons every hour of the day. There is more supply available than what you expected. Are you as willing to pay the higher price that was there before the plant started? Probably not.
Because of this, we expect the majority of plants, if they restart, to stay quiet as possible about it.
Still, there are growing rumors that at least a couple plants are eyeing restarts. Not hard to draw conclusions that others may not be far behind.
Unfortunately for those hoping this craters the market before spring, that likely isn't the case. The window between now and spring is getting closed. If this happens, it is more likely a late spring/summer story.
Still, I'll take the good news where I can get it.
NOLA/New Orleans, Louisiana
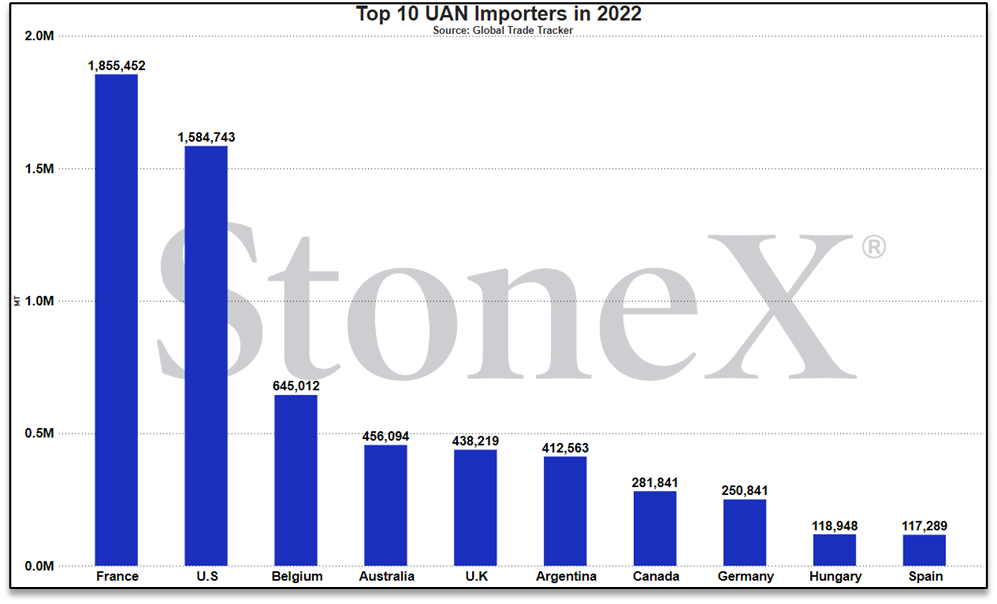
Number 2 global importer in 2022
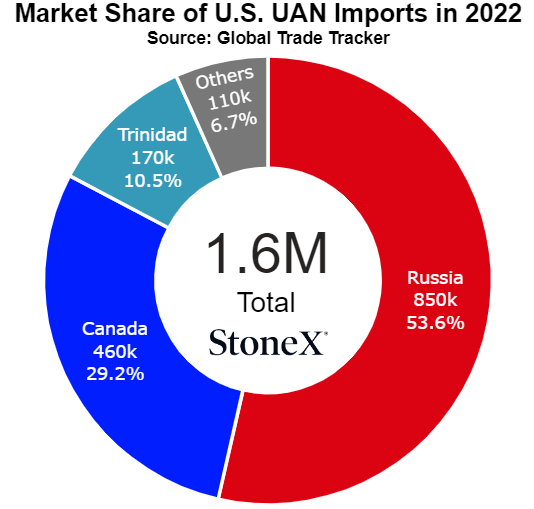
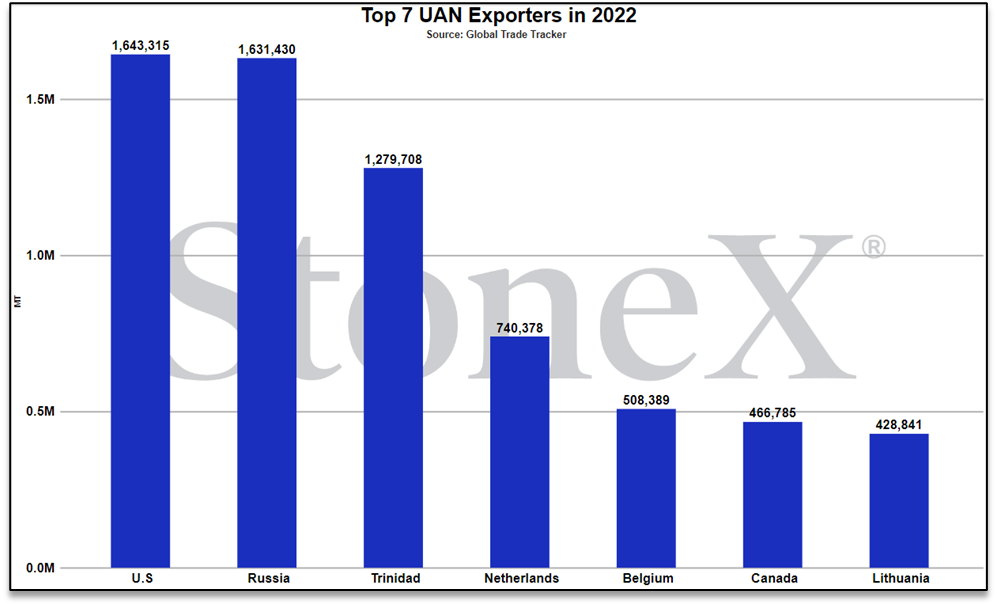
Number 1 global exporter in 2022
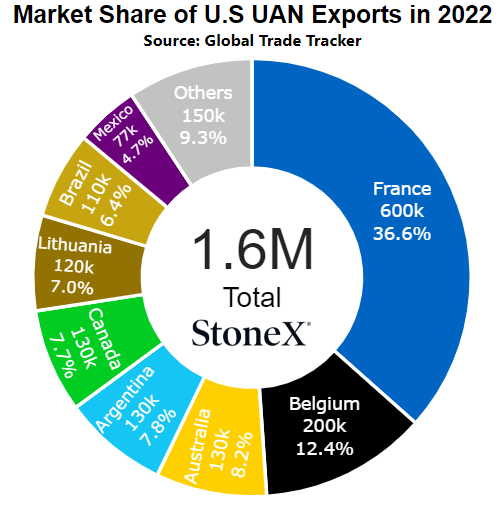
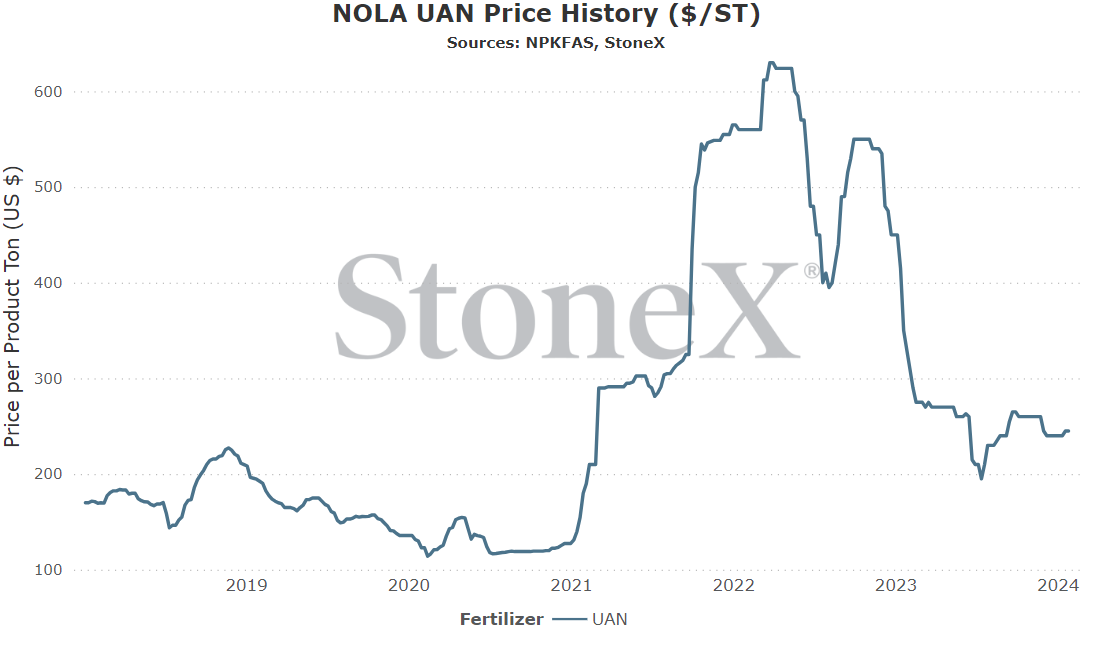
Price comparisons
Vs 30 days ago - +2% or approximately $5 higher
Vs 90 days ago - -6% or approximately $15 lower
Vs 6 months ago - +17% or approximately $35 higher
Vs 1 year ago - -26% or approximately $85 lower
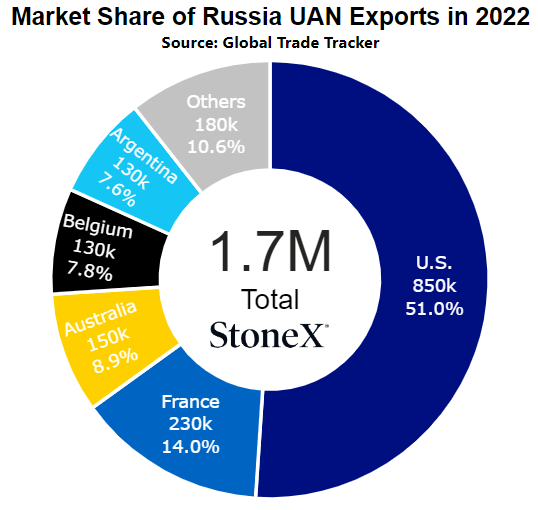
Black Sea (Russia)
Number 2 global exporter in 2022
Price comparisons:
Vs 30 days ago - -3% or approximately $6 lower
Vs 90 days ago - unchanged vs 3 months earlier
Vs 6 months ago - +31% or approximately $41 higher
Vs 1 year ago - -58% or approximately $237 lower
- Urea market strength – urea markets around the world have been strong to start 2024. If this continues, UAN is sure to take note and follow to a certain extent.
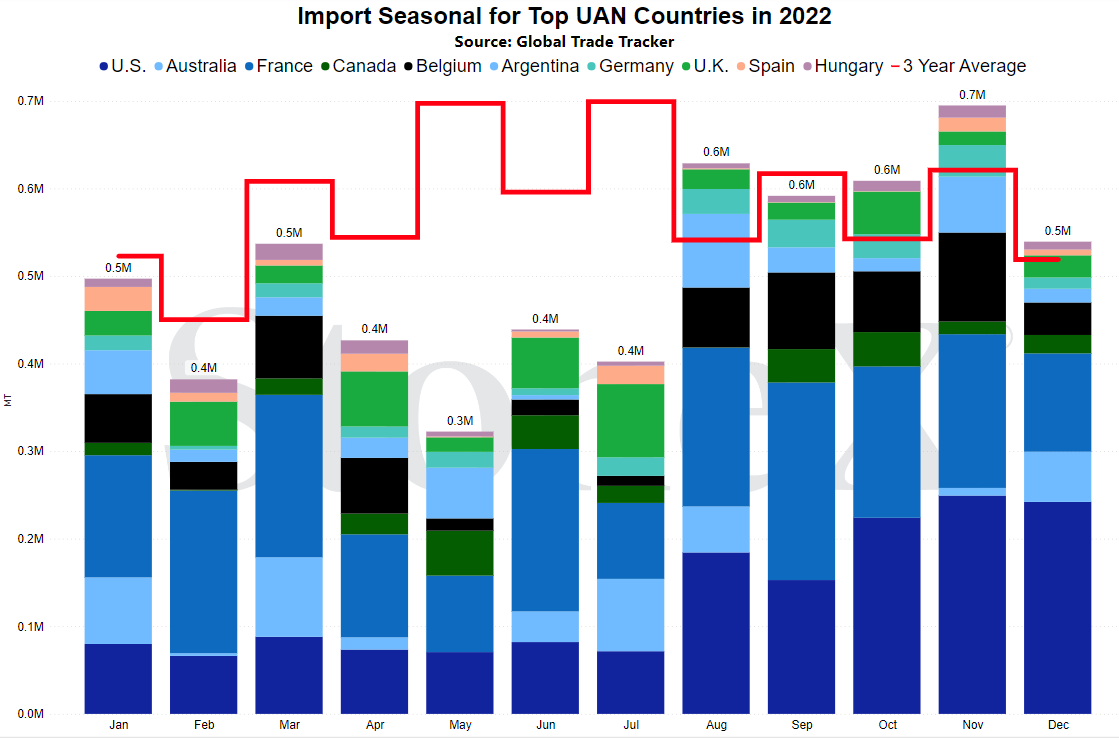
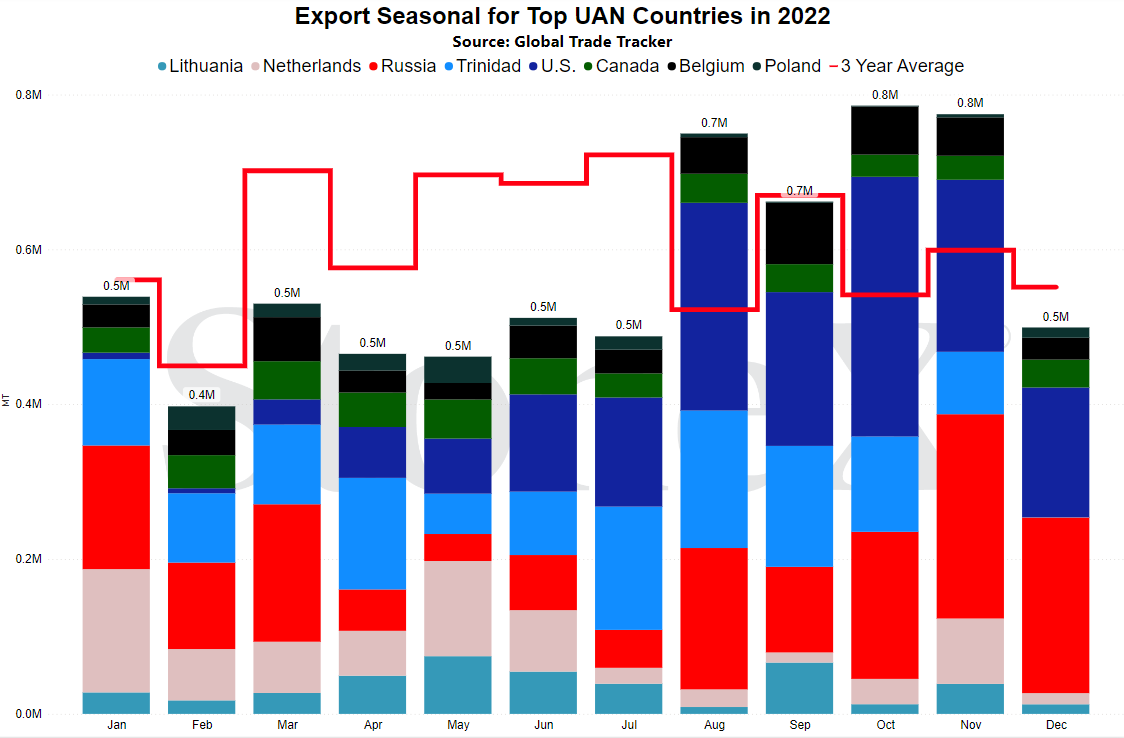
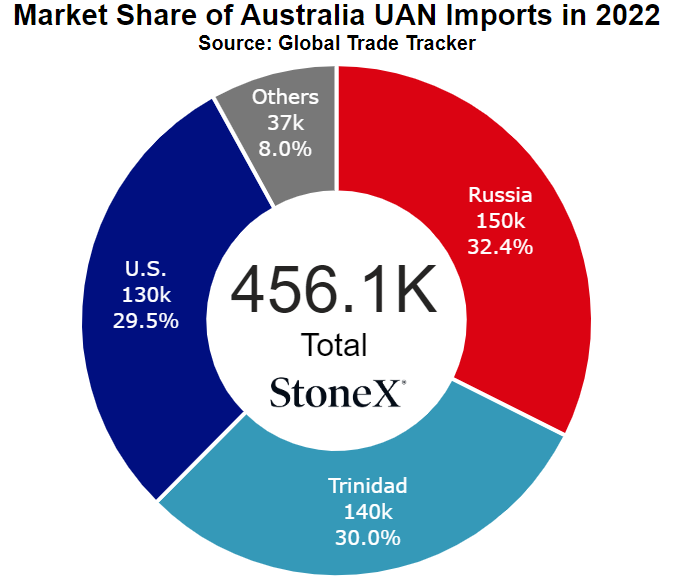
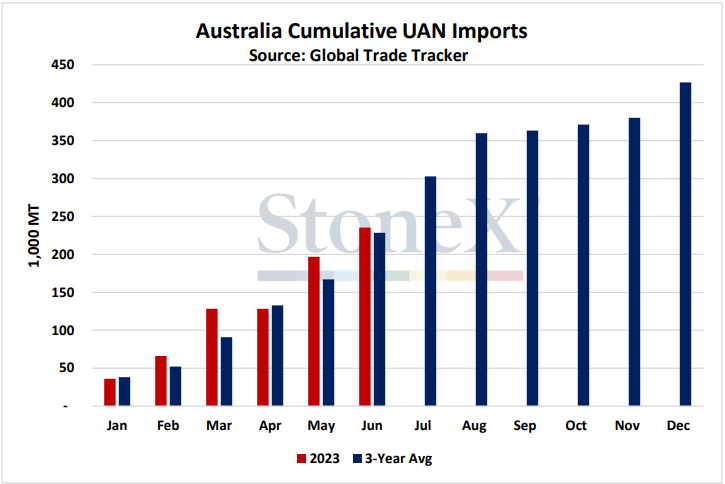
- U.S. markets get tight and rally - if Australia has become dependent on U.S. for UAN supplies, it makes sense that what happens there largely happens here. With spring season in the crosshairs and urea values firm, that is becoming a looming issue.
- Government continuing to block Russian product - the global UAN isn't exactly the most diversified manufactured product out there. With Russia blocked by sanctions, the list gets very narrow, very quickly. What's worse is that the few remaining origin points available to Australia know this...and likely factor that into some pricing.
- The restart of remaining offline European nitrogen plants – Dutch TTF values continue to fall while nitrogen markets (at least urea) have rallied. That increases the chance of the remaining offline European nitrogen plants to restart. If this starts to happen, tons that have become reliant on shipping to Europe will be pushed back and forced to compete in a new area. Typically, that fight breeds lower pricing. This would likely become a N.A. story.
- Urea values fall – the UAN market seems to have learned its lesson from fertilizer year 2023. UAN moved to a huge premium vs urea in the North American space. As a result, many farmers switched to urea and forced the UAN price to plummet. Amazing how demand can have its say!! That said, that lesson is still fresh and the UAN market shows no signs of allowing urea to "get away" this time around. If urea were to fall again heading into spring, high chance that UAN moves to meet the price change to keep its demand.
- N.A. has a stellar NH3 application run/lower corn acreage - if the N.A. market has another great spring run, that will negatively impact UAN demand. Also, there are some rising questions on U.S. corn acreage. We continue to forecast 92M acres...but acre profitability in the less than optimal areas seems to have farmers questioning their approach. If it suddenly finds that corn acres are being cut, there isn't as much demand for nitrogen. What both of these scenarios are saying is that if demand is cut, there is excess supply available which tends to weigh on price ideas.
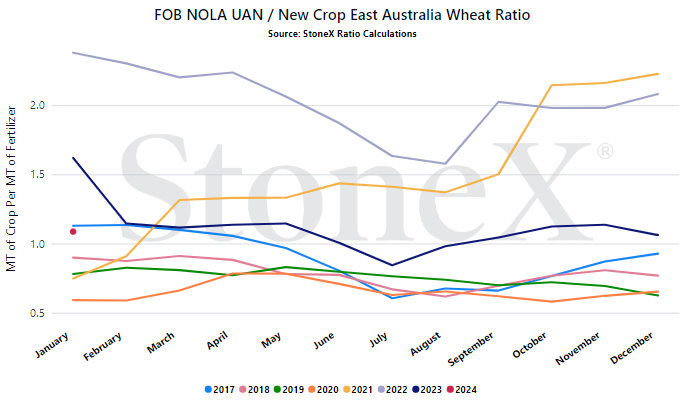
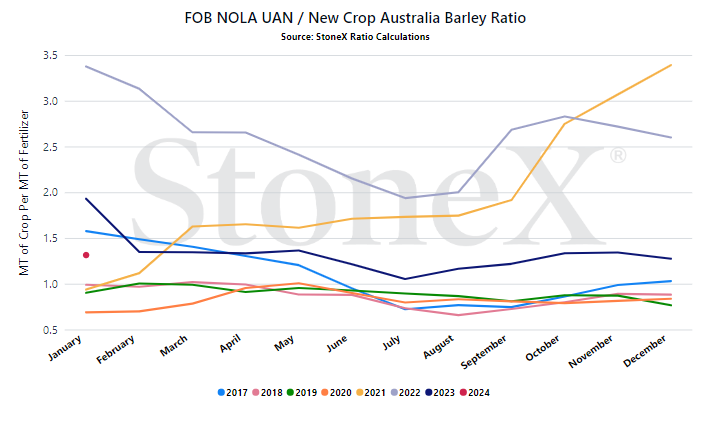
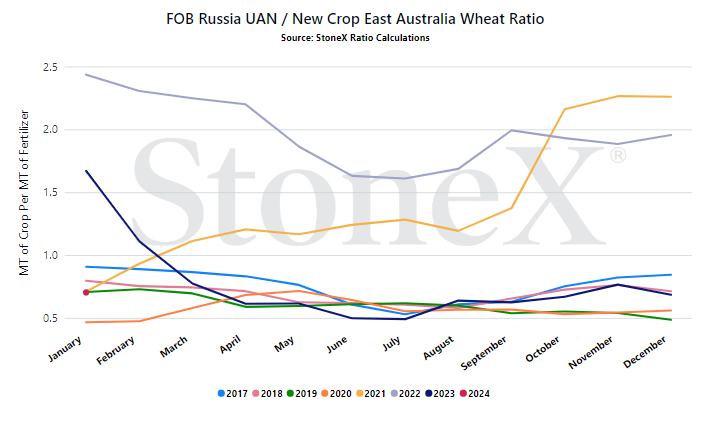
We believe that only looking at the flat price of either grains or fertilizer can be misleading:
-
Only selling grain can hurt you if fertilizer prices rise substantially
-
Only buying fertilizer can hurt you if grain prices fall
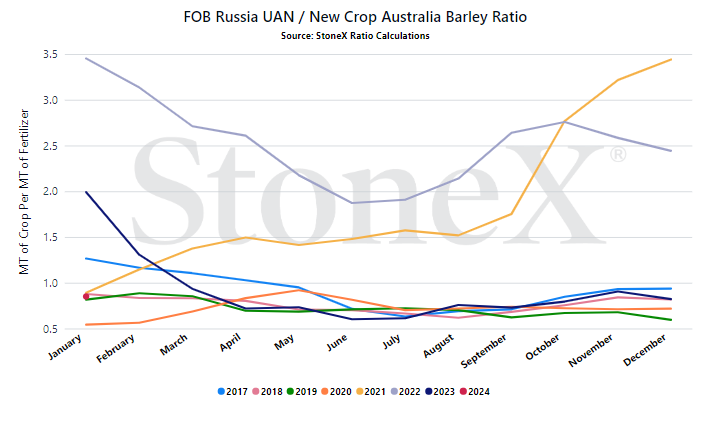
We look at the ratio "value" to get a better indication of where we are or how many bushels of X does it take to pay for 1 ton of fertilizer.
Would you rather:
-
Spend 100 bushels to pay for 1 ton of UAN
-
Spend 60 bushels to pay for 1 ton of UAN
When we compare the current ratio value against recent years, we start to see if we are high or low.
YOUR VALUES MAY LOOK DIFFERENT
This graph looks at the NOLA UAN price vs the flat grain price. There are no logistics on either product. Your location will look different due to fertilizer logistical costs, grain basis, etc.
- European production/Dutch TTF values - Europe needs to remain our focal point for UAN markets. We have seen Dutch TTF values far lower than most anyone would have imagined back in 2022. However, nitrogen values are also down from that period. But today, things are changing. Dutch TTF is in single values while urea markets are bullish. Input values down + output values up = higher chance offline plants restart. If those plants do restart, it pushes exports away and makes the market long (i.e. bearish).
- U.S. spring successful/failure - if Australia is dependent on the U.S. for supplies, Australia needs to be tracking how good or bad their spring season is. If the spring is poor and there are excess inventories, Australia could be the beneficiary of aggressive sales. Unfortunately, a solid spring means the opposite.
StoneX Ratio Calculation
The ratio calculation is derived from Bloomberg historical grains values as well as fertilizer values from StoneX, NPKFAS, and Argus.
The calculation is simply dividing the fertilizer price by each grain price.
All data was sourced from StoneX unless otherwise noted.




