January '26 UREA
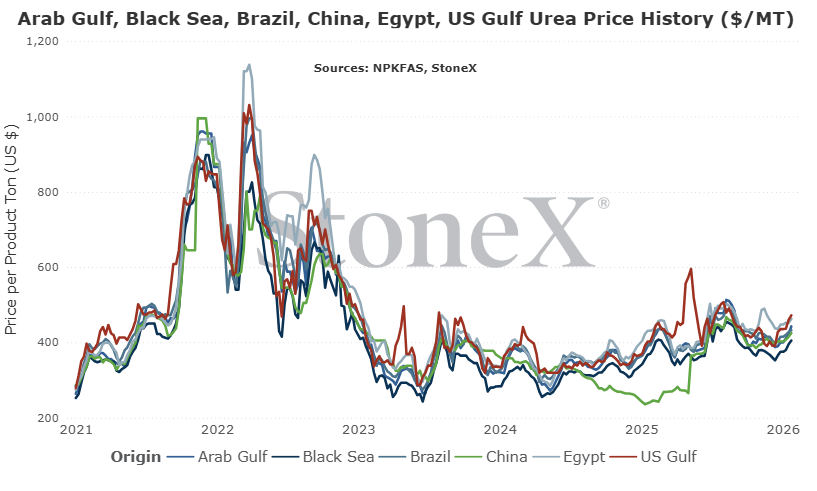
Major Global Urea Export Location Price Graphs
The intention of the below graphs are not to use to say "my price should be X based on this graph". These prices are derived from an FOB price point average. The intent is to show major global price movement trends. Your values will likely have significant basis difference (similar to your local grain price being different than the traded market price).
This graph is labeled as MT in USD currency.
What everyone wants to know first, what do we think will happen going forward
GLOBAL
If I am continuously wrong week after week, month after month, and I just keep saying "softer" and "weaker", I'll be correct eventually, right?
...right?
Well, another swing and miss on the urea outlook last month. There continues to be just enough demand almost daily to keep the bulls in charge. Not only that, there are things still working against the market right now for those wanting lower prices:
- India is still expected sometime soon to announce another purchase tender
- Northern hemisphere spring demand, some southern hemisphere demand is just around the corner
- Iran production has not solved itself and continues to struggle with tight gas supplies
- European production is still stifled at 75% of normal rates
If demand can continue, India step in to purchase, and manufacturers continue feeling good (well sold), then there is little chance of values falling.
However, I am still struggling behind the "why" of the current premium over same time last year. It feels like a market that is more than content to follow the charge higher...but what happens when the music stops?
NORTH AMERICA
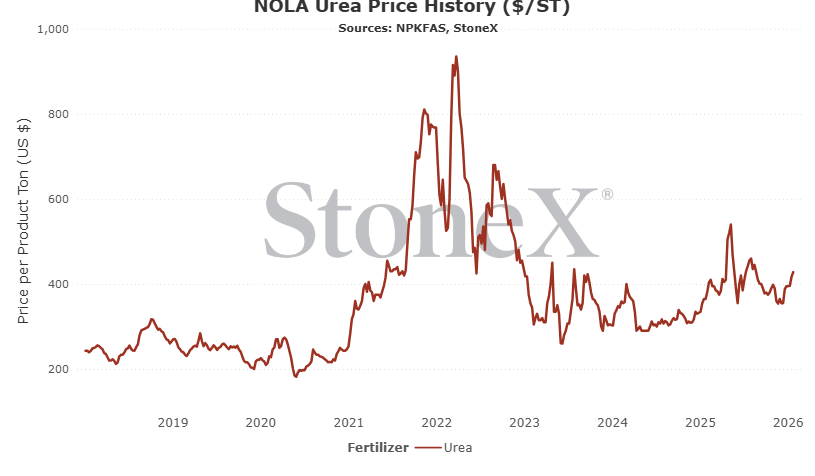
Current NOLA urea values are just shy of 20% higher than a year ago as I write this.
Farmer profitability feels worse.
Grain values are lower.
Corn acreage forecasts are lower than USDA final numbers for 2025 by a decent margin.
There is nothing that stands out screaming "we are short product that is either here or coming".
All of that, and yet the market continues to be firm as it follows global prices higher. As bad as it currently is, it could get worse:
- NOLA values tend to start pushing to a premium vs the world in the next few weeks as it calls on spring imports.
- Inland fill continues to feel "behind" as demand remains low which could blow out NOLA/inland basis levels.
Even if global values were to start sliding, NOLA may hold value to create the premium vs the world. Even if NOLA values start to fall, inland values may push higher as just in time demand for spring needs more than outweighs any NOLA savings.
I am still struggling with the current premium price vs a year ago, but my confusion/frustration means absolutely nothing to the market. Global values continue to feel like they will ride the emotional bullish wave which means NOLA needs to follow. Even if global values turn around, it will still take a lot of work to get NOLA/inland values lower.
All to say the path continues to look more bullish than bearish...but there is something in the back of my head/my gut that is trying to warn me that a turn is coming.
General Global Urea Information
What has happened in the last 30 days?
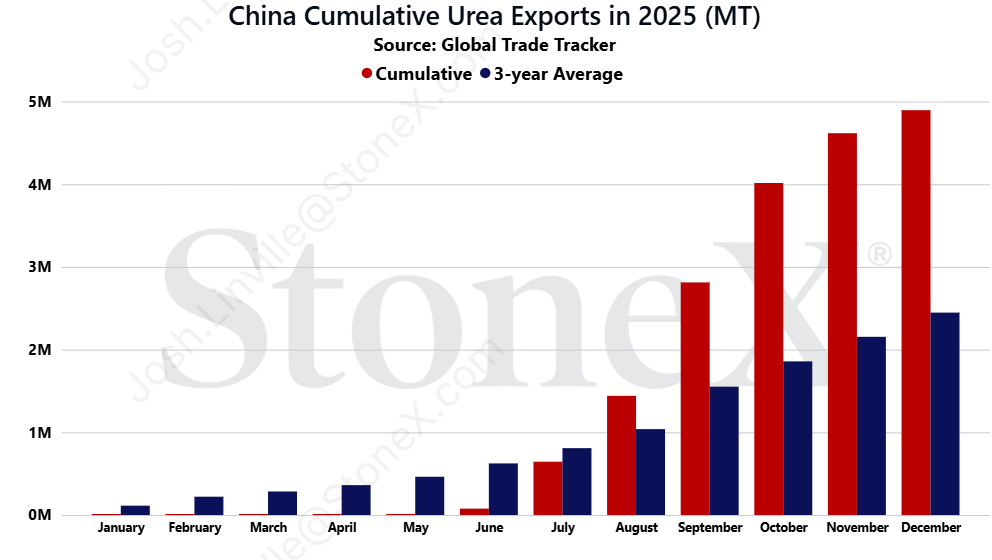
China/Russia 2025 urea exports very strong, boosts global supplies
One of the biggest highlights for me in 2025 has been the surge in urea exports from both China and Russia. Just wish it could have been a big enough highlight to pressure global urea values lower.
For those that are new, some context.
China has historically been a major urea exporter. In recent history, their normal export flows have been between 5 to 5.5M tons per year. That used to be normal. It is not any longer. When global values skyrocketed and inventories became tight in late 2021/early 2022, the Chinese government saw an issue. Chinese exports of urea had the potential to explode higher, leaving few to no tons remaining for Chinese farmers. Rather than allow this risk, they intervened and started to constrict export flows. They had two goals: ensure adequate domestic supplies and provide lower domestic urea values vs the rest of the world. Fortunately for Chinese farmers, this plan worked.
Unfortunately for the rest of the world, this plan worked.
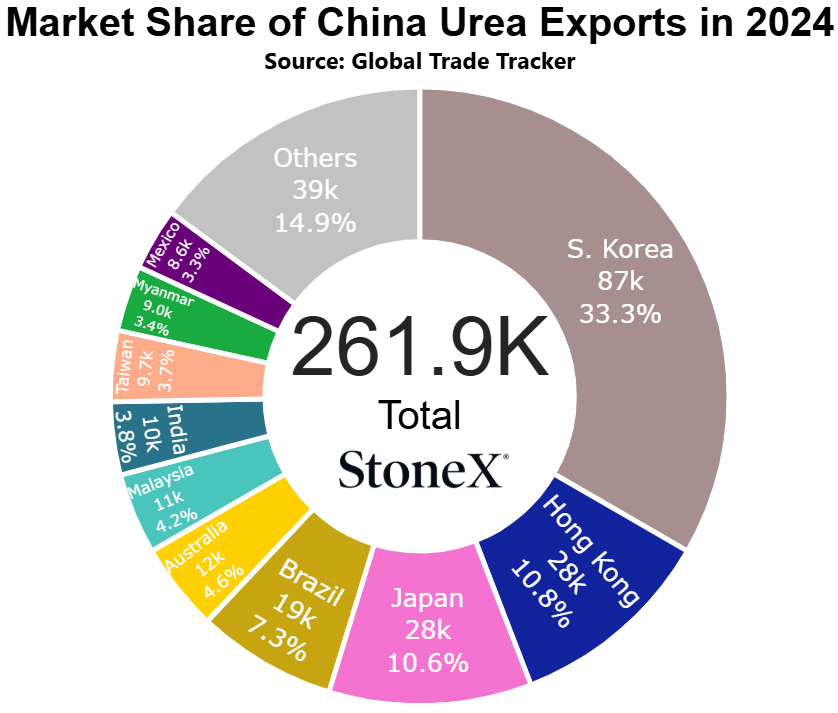
This all came to a head in 2024. Export restrictions were severe enough that cumulative totals only reached 262K. A far cry from the 5 to 5.5M ton normal range. 2025 did not start off with a bang. Export totals from January to May struggled to reach 77K tons. Then a shift. Exports started to be allowed and by the time we received their December data, the yearly total reached just shy of 5M tons!
As of today, we do not know what to think for what will happen in 2026, and that lack of knowledge is likely playing a big part in pushing prices higher. There is fear that the urea export program will follow phosphate in that no exports will be allowed until August. However, there is a rumor that we will get a better clarification after the Chinese New Year. For now, all we can do is sit and wait.
Then there is Russia who has been blowing the doors of their normal export flows. Historically speaking, we generally expect Russia to export around 7M tons. However, that has been growing in recent years. Part of the increase is a push to produce more. Wars are expensive. The other is lower UAN production that allows more urea to be produced. For 2025, we had been expecting their exports to reach around 9M tons We still do not know 2025 officially, but there have been rumors that shipments to export facilities were north of 10M tons! If that is true, combined with China, that would be a massive supply boost.
For a global urea market that generally has few to no positive stories, this is a welcome change. We can hope that these big export flows will continue in 2026 which would likely help correct urea values...but hope is rarely a good strategy.

Iran uprising further complicates nitrogen production levels
As tends to be the case, when tensions begin to rise in the Middle East, the global urea market needs to take notice.
The Iranian people have once again begun protesting the current government in an attempt to pressure them from their positions. This protest felt different. This felt like it had a lot more behind it and we finally saw real pressure being placed on the government...which is likely why we saw the response that we did.
While actual figures are still vague given that the government shut down the internet to control communications, it has been heard/reported that the number of protestors killed/jailed could easily reach into the thousands or tens of thousands. This story has been met with harsh responses by many global leaders.
Among them, President Trump who we all know does not take half measures.
Rather than sit back and speak strong words, it appears that President Trump is placing very real pressure on the government. The USS Abraham Lincoln carrier strike force has been redirected to the region so that if the decision is made to strike, not only would it not take long but the fleet would be in place to protect surrounding nations, assets, and vessel traffic.
That last one, vessel traffic, is one of our large worries. In recent days, traffic in the Persian Gulf has slowed tremendously as owners and crews decide it is better to sit and wait to see how this plays out rather than risk being attacked while sailing the Straight of Hormuz. Most of the world will be focusing on the effects of the oil markets...but we care about fertilizer and urea will certainly be included.
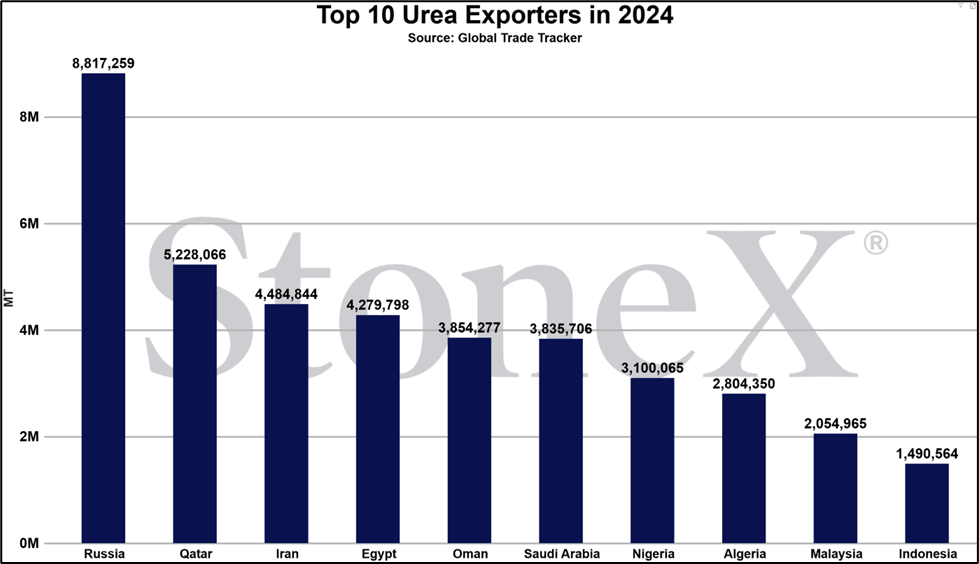
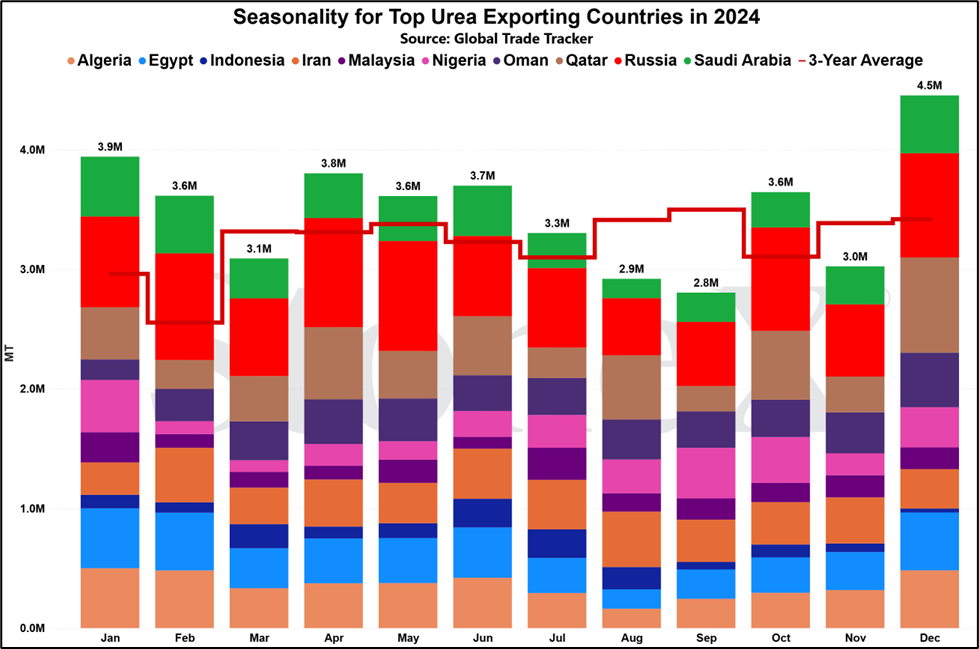
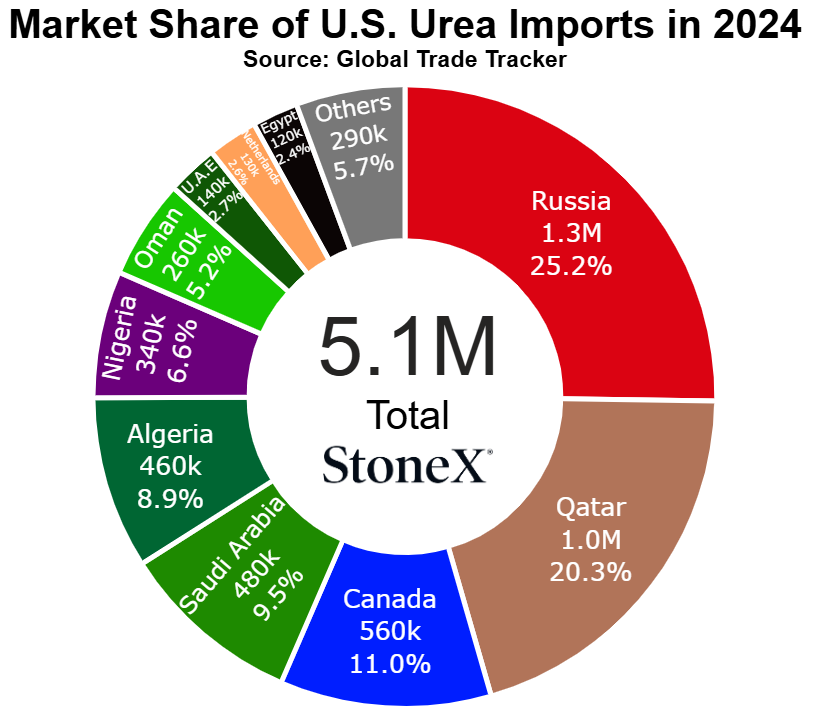
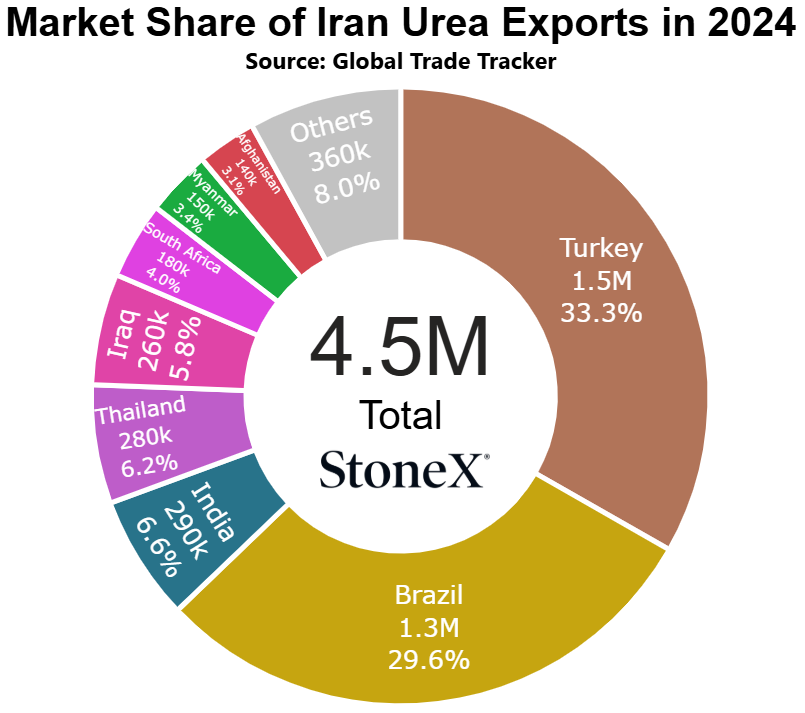
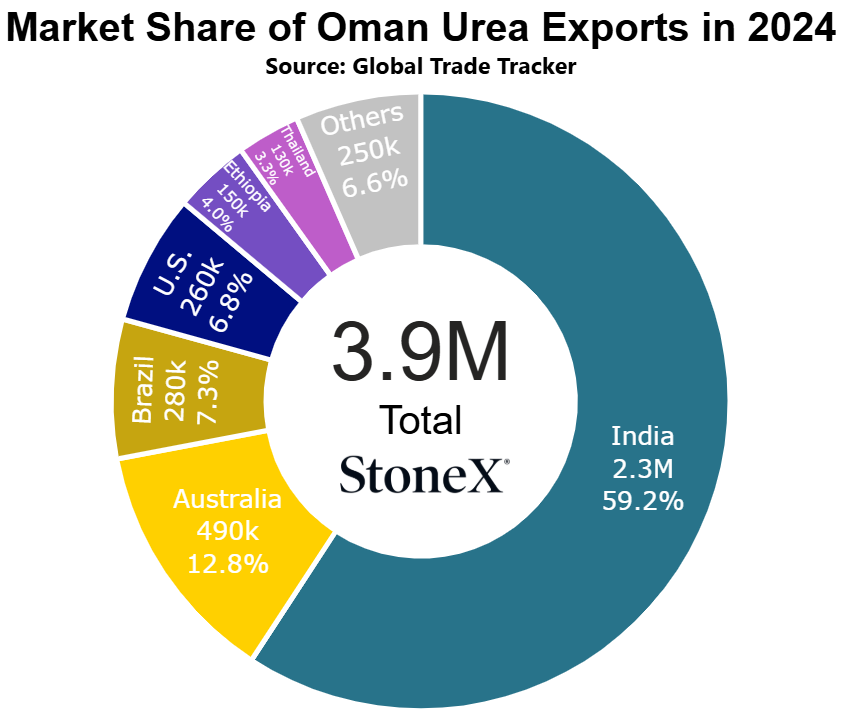
If you look at the map below, the 4 countries with yellow stars denote the nations that are among the top 10 urea exporters in the world:
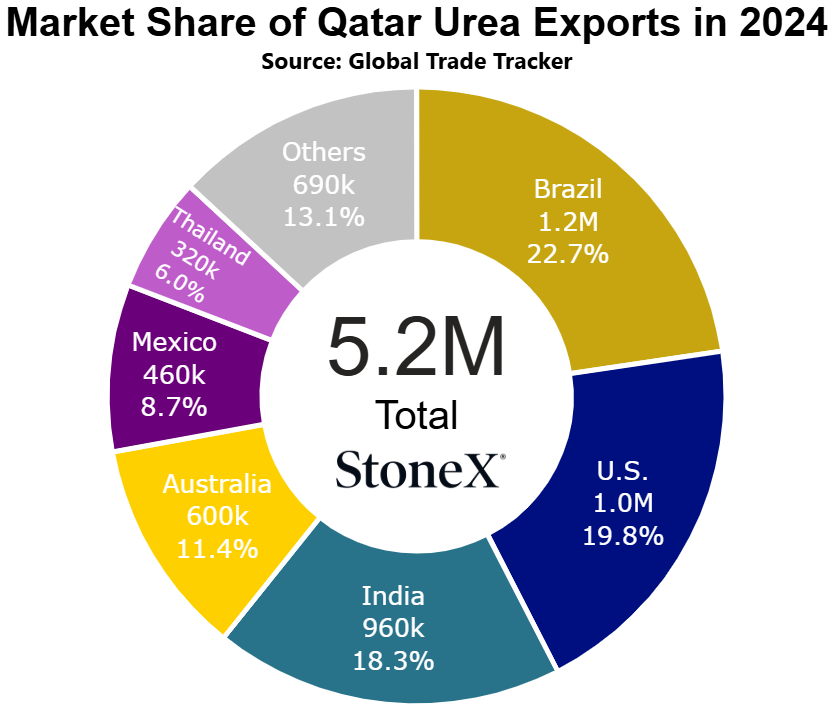
- Qatar - 5.2M in 2024
- Iran - 4.5M in 2024
- Oman - 3.8M in 2024
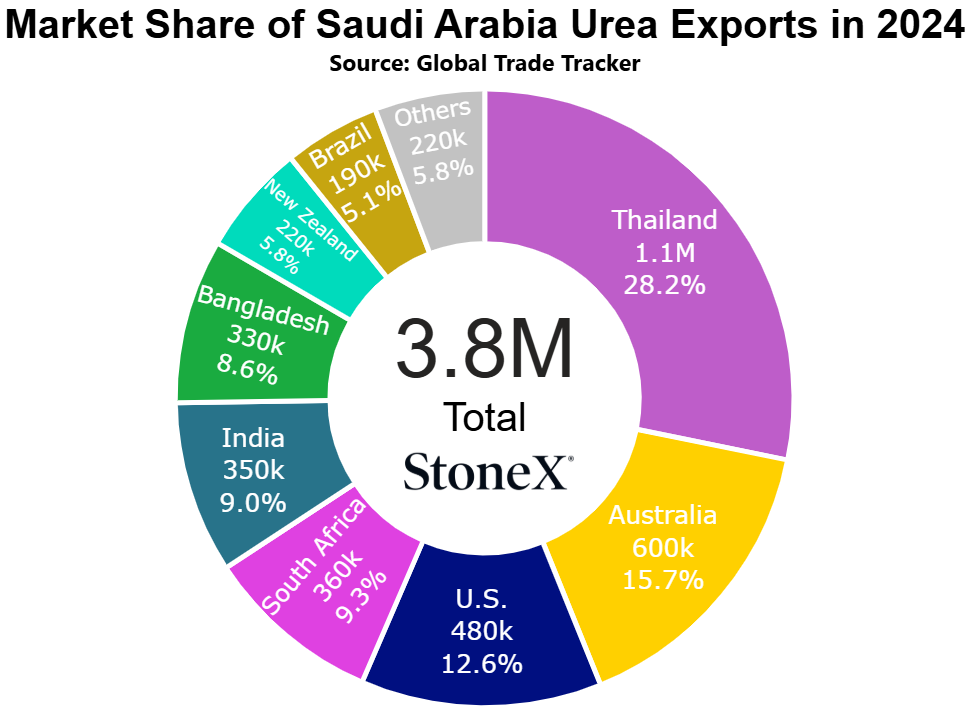
- Saudi Arabia - 3.8M in 2024
That is a pretty good "who's who" list for urea. If traffic is ground to a halt, that means a fair amount of urea transit will stop. Not a great sign with Northern Hemisphere spring demand just around the corner.
The other major event we need to watch for is an actual attack on Iran by U.S. forces. Put yourself in President Trump's shoes. If you want to attack the government in order to support the people, what do you do? Does it make sense to attack the electrical grid/water supplies/other resources needed by the general population? No. Do that and you turn the population against you. You want to starve the government and what does every government run on? Money. Where does Iranian money come from? Oil. Gas.
Fertilizer.
If the U.S. decides to attack, it is very likely that they will target military assets and gas/oil assets. Those attacks would further degrade gas availability and essentially shut down nitrogen/urea fertilizer production until repairs are made...and it would not be likely that those repairs be made quickly
Ultimately, this is all still a guessing game. We do not know what will happen or how it plays out. By March, it could be a non-story...or it could be the loss of the 3rd largest urea exporter in the world.
All to say that farmers around the world need to watch the Iran situation closely. There is never a good time to fear losing the 3rd largest urea exporter but losing them right before northern hemisphere spring seasons begin probably couldn't not be worse.
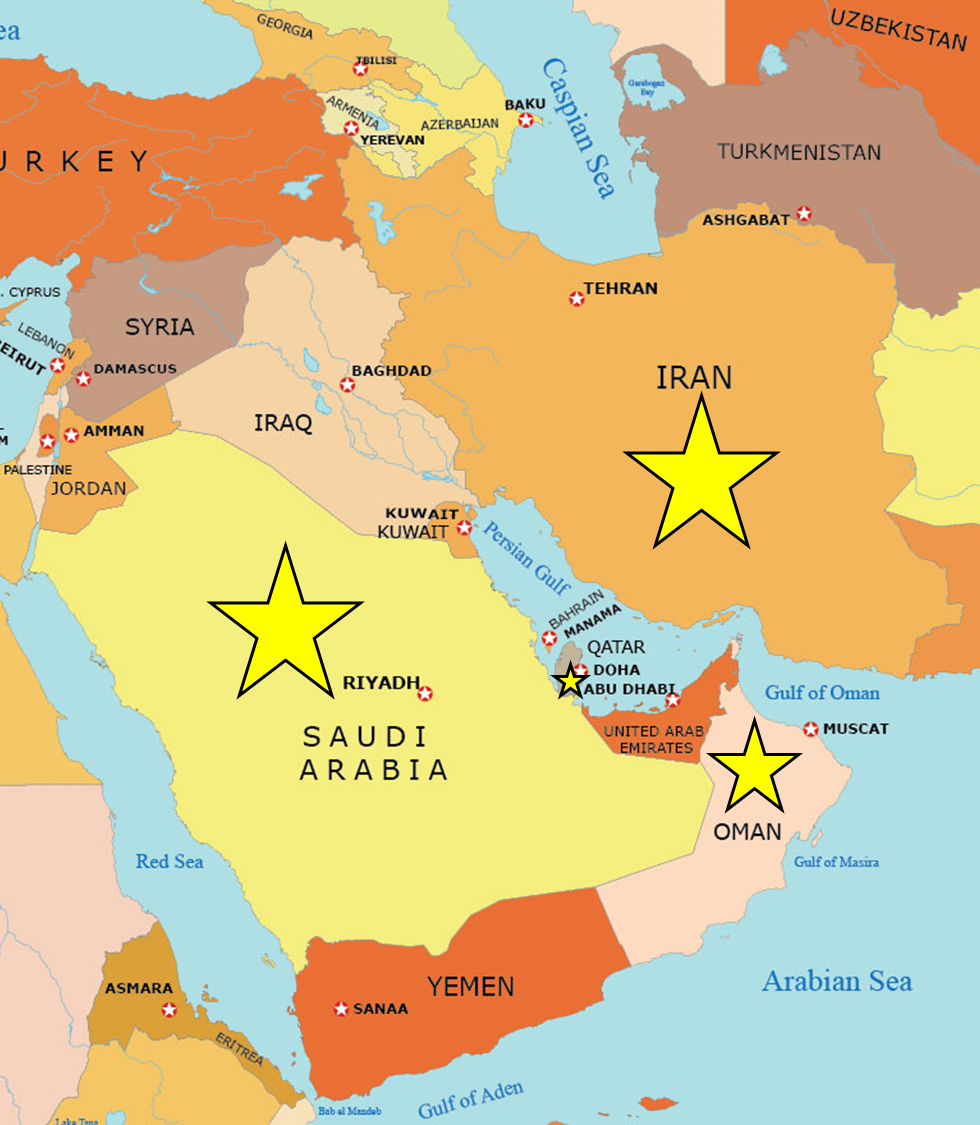
Source: www.gisgeography.com
European production outlook hopes fade
Hope giveth.
Hope taketh away.
Hence why I rarely allow myself to hope!!!
Last month, I talked about the hope (albeit small hope) that we could be on a road that leads to Europe restarting their offline nitrogen production facilities.
Well, that is almost entirely gone now.
In the last month, two things have happened to cut that hope:
1. Uncertainty continues to reign around the CBAM (carbon border adjustment mechanism) - it looked almost guaranteed that European domestic nitrogen values were going to skyrocket as a result of this program. However, today we are still unsure of how it will roll out. This has been a big win for European farmers, but for anyone hoping that higher domestic values would help restart the plants, it was a loss.
2. Gas values in Europe rallied once again - last month, Dutch TTF values had continued to fall and were starting to settle in the upper $8/lower $9MMbtu price range. While still higher than historic norms, it at least was a major correction for where it had been trading ($10 - $14). Well, winter temps and demand appear to have "fixed" the lower prices. Today, nearby months are trading in the $13MMbtu range while further out months maintain double digits. That means a much higher cost of production for plants that were even considering restarts.
In case you are wondering why this matters for the world it is due to the size of Europe. With around 25% of nitrogen production offline, that means over 3M tons of urea are not being produced every year. It isn't as though European farmers will just do without. Instead, they go to the rest of the world to replace what they do not produce. That not only lower global supplies but it builds global demand. A very bullish one-two punch. My hope had been the opposite. If production restarted, supplies would grow and demand would fall and we could see prices starting to slide
Today, it is incredibly hard to see a path that leads to restarting those plants. Not impossible, just incredibly hard.
Global values continue to firm even on weaker sales books
- NOLA Urea - $440 today vs $374 last year
- Middle East Urea - $450 vs $412.50 last year
- Brazil Urea - $437.50 vs $407.50 last year
I could keep going but the point I am trying to make is that global urea values continue to trade at a solid premium to the same time last year. Unfortunately for buyers, the list of reasons "why" prices could continue to push higher is not short:
- European production remains around 75% of normal
- Still a lot of uncertainty surrounding China's export program for 2026
- Iranian production continues to struggle with insufficient gas supplies
- Spring/demand is just around the corner meaning manufacturers do not need to sell "a lot", they just need to sell "enough"
- India is expected back to buy relatively soon.
However, even with all those events, we started 2026 with global manufacturers not as well sold as they have been in recent years. January started with there still being January tons to ship. Now, as we begin February, we have just started to see manufacturers reporting March shipment sales. To me, this is not indicative of a strong sales book.
Why is that?
My two biggest reasons why continues to be China and Russia. China, after a dismal 2024 export year of only 262K tons, rebounded last year with nearly 5M tons exported. For Russia, we do not have 2025 data, but reports indicate that urea shipments to export facilities may have breached 10M. Not bad for a country that used to "only" export 7M tons before the Ukraine invasion.
The reason I continue to harp on this subject is that feels like a market that is a bit more hollow than normal on this bull run. My fear is that if/when the buying stops, it puts the bullishness in a more delicate situation. Without a longer term sales book, we can see unsold inventories start to build much quicker which typically puts pressure on price ideas.
There are plenty of reasons why prices are going higher (even though farmers are not seeing any sort of reward in the grain space). It just feels like a market that could turn around much quicker than we have become used to in recent years.
N.A. markets take a hit with prolonged cold temps hitting gas values/supplies
This is a story...that really isn't that much of a story.
Years ago (2021, I think), there was a massive cold weather system that pushed deep freezing temperatures all the way south to the U.S. / Mexico border. Public demand for gas skyrocketed as people fought to heat their homes at least to the point that the pipes didn't burst. As that demand spiked, so too did gas values.
This had an effect on nitrogen fertilizer producers.
No doubt most of the plants had purchased cheaper gas earlier in the winter to ensure stable production rates. Suddenly, as the public demand started to rise, so too did the gas price which left manufacturers with a decision:
A. Continue to produce fertilizer at current profits
B. Slow or stop production and sell the gas contracts back at a massive profit
For companies looking to make money, the decision was not a hard one.
For any company who had been operating by securing only spot needs for gas, it simply no longer made sense to pay the astronomical price of gas as the price of the finished fertilizer good did not justify it. They too slowed/stopped their production rates.
As a result, nitrogen values started to rise and the market learned a lesson to watch for in the future.
That brings us to today.
Recent artic temperatures have been pushing far into the southern U.S. Demand has jumped which has caused gas values to jump as well. There have been some rumors/reports (not all companies have to provide this type of information so a lot of guesswork) that some plants slowed their production rates and even one plant in Texas may have gone offline for a few days.
However, based on the lack of market price movement, it does not appear today that much was lost.
Now, values have risen, but that has more to do with keeping pace with global price increases. We have not seen NOLA values climb in comparison to the world.
Still, this serves as a warning that markets can change quickly. We dodged a bullet this time.
Where are current values in relation to the past
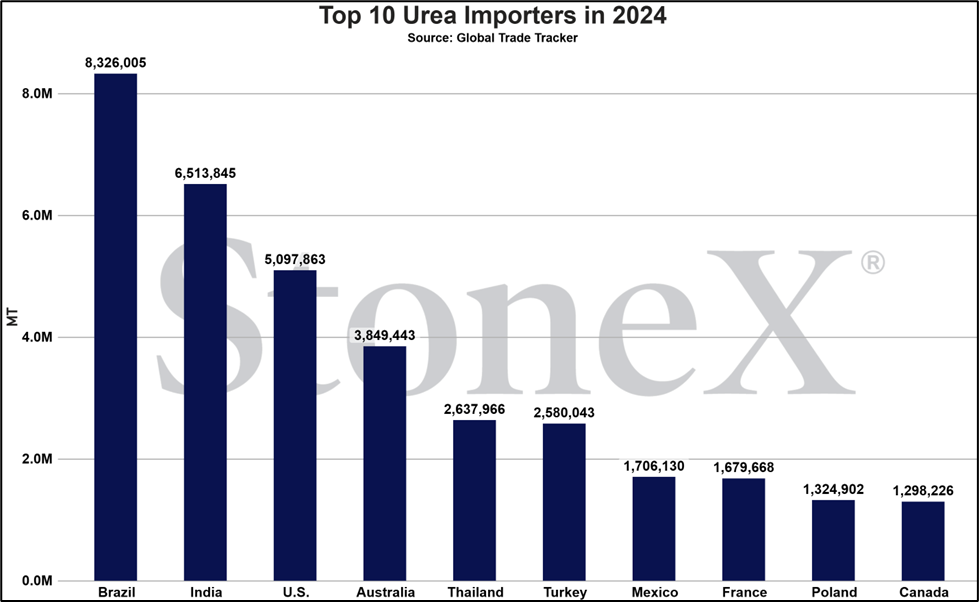
NOLA/New Orleans, Louisiana
Number 3 global importer in 2024
Price comparisons
Vs 30 days ago - 8% or approximately $33 higher
Vs 90 days ago - 10% or approximately $38 higher
Vs 6 months ago - -6% or approximately $27 lower
Vs 1 year ago - 12% or approximately $46 higher
U.S. Midwest Average
Vs 30 days ago - 7% or approximately $31 higher
Vs 90 days ago - 10% or approximately $45 higher
Vs 6 months ago - -4% or approximately $20 lower
Vs 1 year ago - 9% or approximately $39 higher
U.S. Southern Plains Average
Vs 30 days ago - 6% or approximately $28 higher
Vs 90 days ago - 10% or approximately $45 higher
Vs 6 months ago - -1% or approximately $5 lower
Vs 1 year ago - 9% or approximately $40 higher
U.S. Northern Plains Average
Vs 30 days ago - 8% or approximately $34 higher
Vs 90 days ago - 11% or approximately $48 higher
Vs 6 months ago - -4% or approximately $23 lower
Vs 1 year ago - 4% or approximately $18 higher
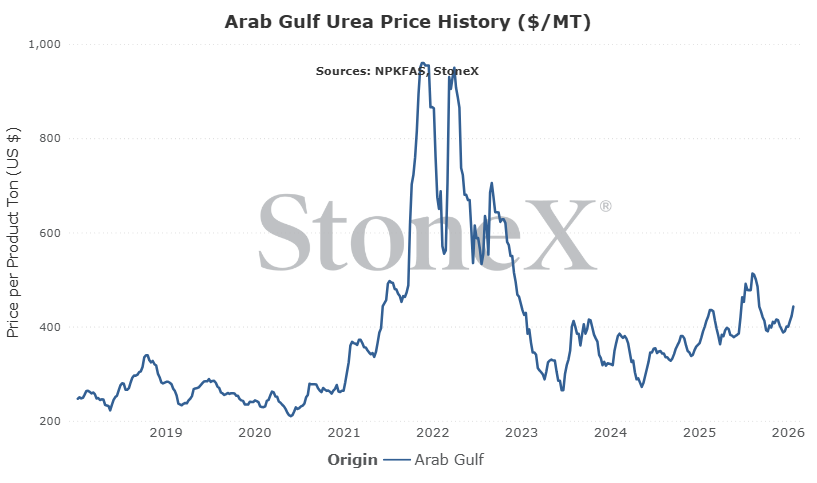
Middle East
Number 1 exporter (as a region, not as individual nations)
Vs 30 days ago - 11% or approximately $43 higher
Vs 90 days ago - 11% or approximately $45 higher
Vs 6 months ago - -7% or approximately $35 lower
Vs 1 year ago - 7% or approximately $30 higher
Egypt
Number 4 global exporter in 2024
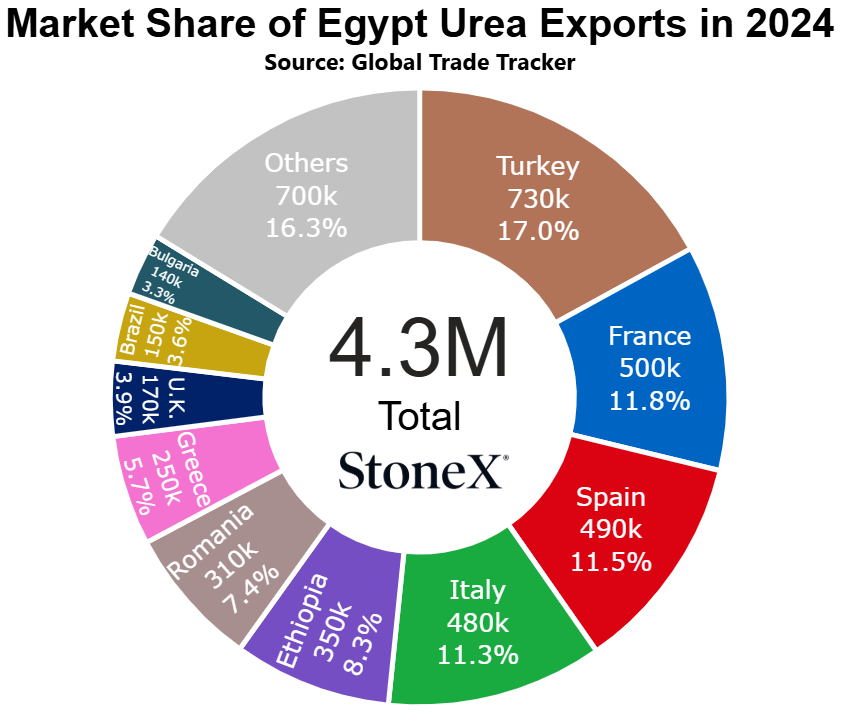
Price comparisons
Vs 30 days ago - 3% or approximately $15 higher
Vs 90 days ago - 8% or approximately $34 higher
Vs 6 months ago - -6% or approximately $28 lower
Vs 1 year ago - 7% or approximately $29 higher
Black Sea
Number 1 global exporter in 2024
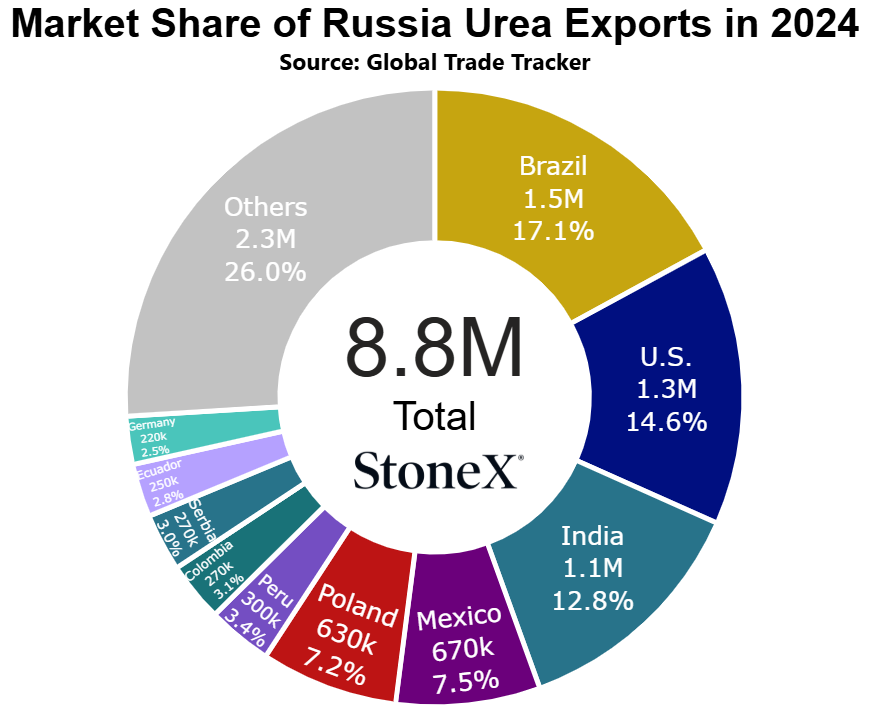
Price comparisons
Vs 30 days ago - 8% or approximately $30 higher
Vs 90 days ago - 11% or approximately $40 higher
Vs 6 months ago - -6% or approximately $25 lower
Vs 1 year ago - 6% or approximately $23 higher
China
Number 5 global exporter in 2023, did not make the top 10 in 2024
Price comparisons
Vs 30 days ago - 6% or approximately $23 higher
Vs 90 days ago - 10% or approximately $40 higher
Vs 6 months ago - -4% or approximately $18 lower
Vs 1 year ago - 73% or approximately $179 higher
Brazil
Number 1 global importer in 2024
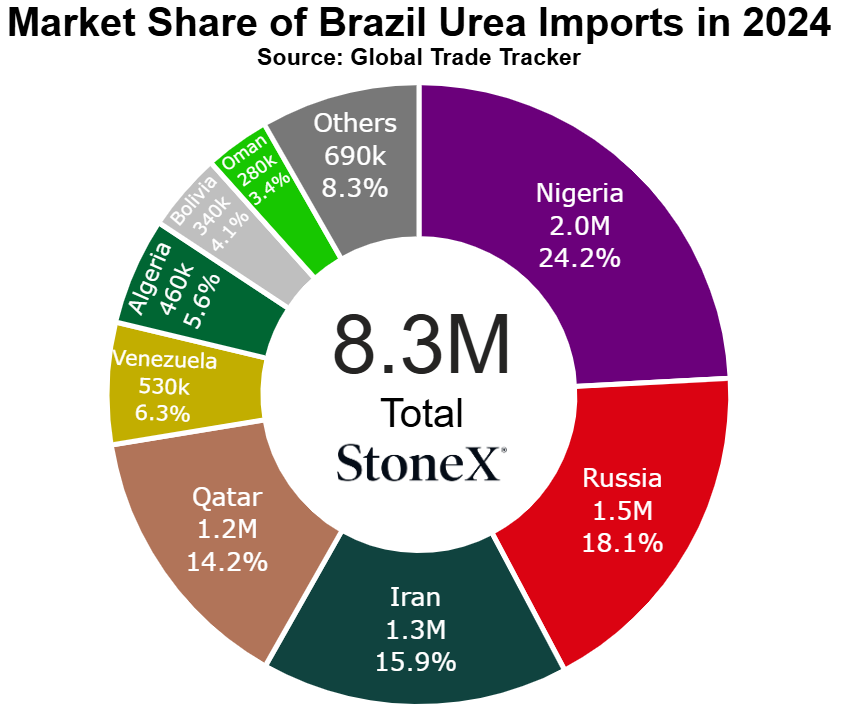
Price comparisons
Vs 30 days ago - 4% or approximately $18 higher
Vs 90 days ago - 5% or approximately $23 higher
Vs 6 months ago - -6% or approximately $30 lower
Vs 1 year ago - 6% or approximately $25 higher
Bull/Bear Factors
Because no market is ever guaranteed to go higher/lower, we try to consider the factors that can sway values so that we are able to act when they occur rather than react.
- Bullish Factors
- Russian vs world relations - one of the bright spots for global supplies remains Russia. Their exports have continued to outpace their historical normal volumes. Partly due to increased production overall. Partly due to an absence of normal UAN production. All of it combines for more tons being available for the global S&D. However, we are seeing more and more of Russia's oil "shadow fleet" being stopped. If that program starts getting expanded to fertilizer ships (or anything else that slows their export flows), then the global urea market is looking at a scenario where it reduces its largest provider.
- Iranian uprising, outside "assistance" - it appears the Iranian government has been mostly successful in tamping down the uprising...for now. For a minute, it looked like the revolt was going to be successful. The next round, with the world watching closely, very well might be. If that is the case, we need to be weary of what it might mean for Iranian gas/nitrogen production. It may mean nothing...or it may mean something. With Iran being the 3rd largest urea exporter in 2024, what happens there happens everywhere..
- Demand continues to support - while global manufacturers may not have sales into March (as I write this), it may not matter. There continues to be enough daily demand support to keep supporting price ideas. We could very well see a situation this demand continues until India announces their next purchase tender. Then, they will have enough runway to keep the party going until spring demand is forced to step forward. I hope this isn't the case, but it is becoming more and more likely.
- Bearish Factors
- China exported near 5M tons in 2025, if they target similar for 2026... - today, urea values are anywhere from 15 - 20% higher than the same time last year which is interesting. Chinese exports for all of 2024 (which would have set the stage for the beginning of 2025) were significantly lower than today. 2025 Chinese exports were nearly normal, yet today's values are a premium. If we start to find out that 2026 exports will also be healthy, we could see this market tumble quickly.
- Russian urea exports continue to climb - Russia's economy runs almost entirely natural resource exports and they have a war to pay for. While Ukraine is getting better at attacking some Russian nitrogen production facilities that produce other goods for artillery and the sort, Russia's production continues to be solid. If they need more income to keep the war going, it makes sense to try and boost production further.
- Current fundamentals continue to tell a different story - listen, I've believed this since mid-December when urea hit its low and I have been wrong every day/week since. I keep thinking through it and I keep coming back to the belief that the current S&D is improved, even though prices remain a premium. Russia's exports remain large. China's exports were large last year and could be large again. Europe is unchanged. Iran is a question mark but would expect it to resume normal in the coming weeks. If the fundamentals start to come out, we could see values falling.
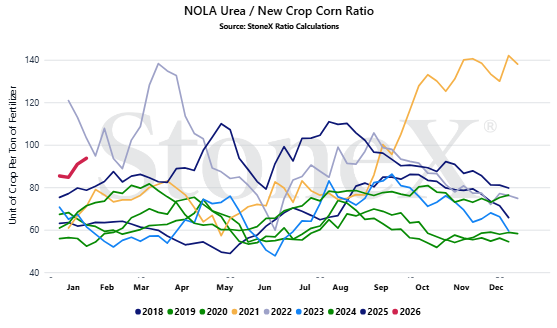
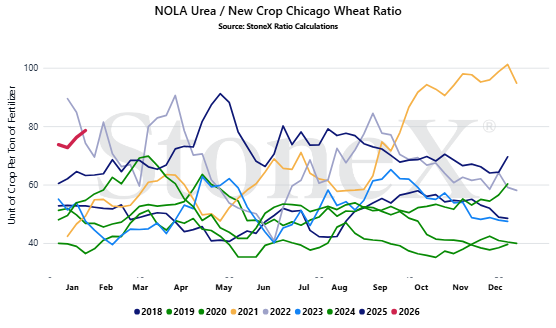
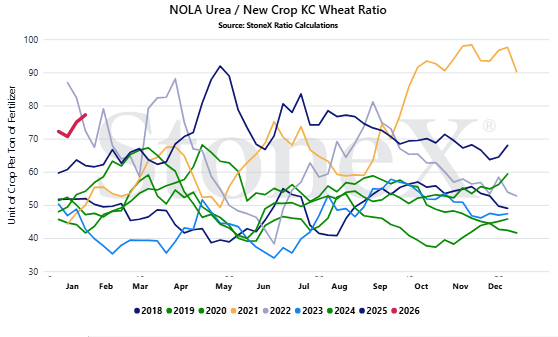
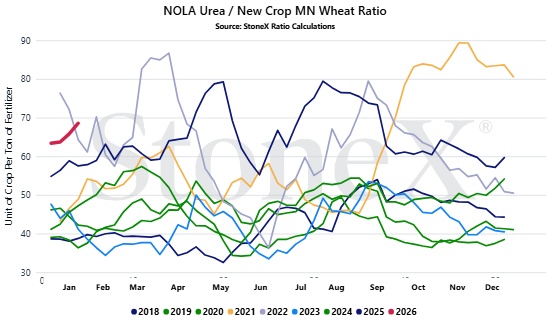
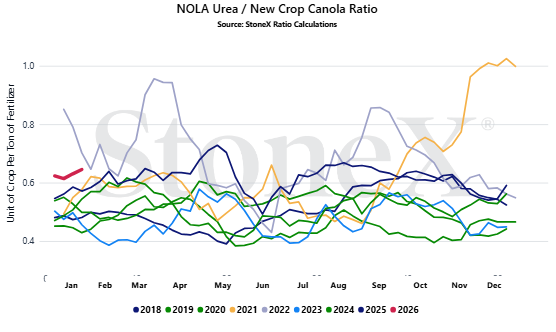
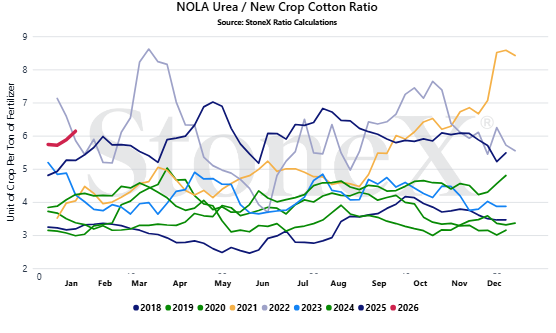
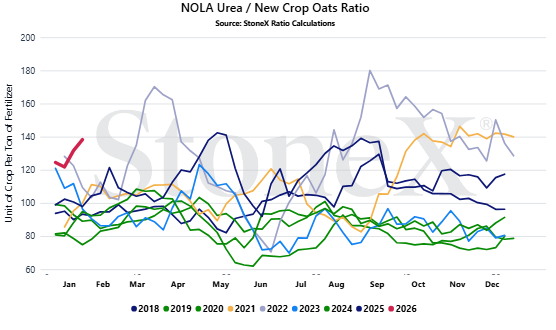
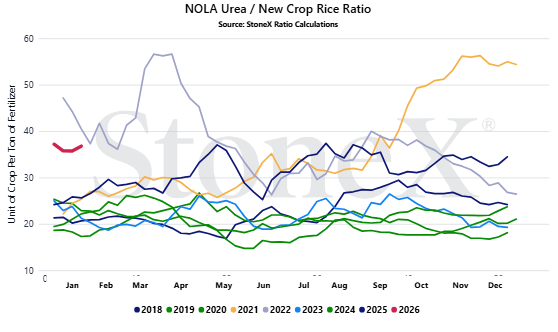
Where are the current urea/grain ratio values today
We believe that only looking at the flat price of either grains or fertilizer can be misleading:
- Only selling grain can hurt you if fertilizer prices rise substantially
- Only buying fertilizer can hurt you if grain prices fall
We look at the ratio "value" to get a better indication of where we are or how many bushels of X does it take to pay for 1 ton of fertilizer.
Would you rather:
- Spend 135 bushels to pay for 1 ton of urea
- Spend 55 bushels to pay for 1 ton of urea
When we compare the current ratio value against recent years, we start to see if we are high or low.
YOUR VALUES WILL LOOK DIFFERENT
This graph looks at the NOLA urea price vs the flat grain price. There are no logistics on either product. Your location will look different due to fertilizer logistical costs, grain basis, etc.
- Josh Linville’s Focal Points
- Russia's ability to export / access to global free markets - Russia remains the world's largest urea supplier...for now. The longer the war with Ukraine continues, the higher global tensions against Russia. This could escalate to a point where Russia has to slow/stop their urea exports because the world refuses trade. It is an extremely low likelihood as countries like India and Brazil have commonly shown little interest in following western trade guidelines...especially when it comes to goods like fertilizer. However, even a small reduction in the current global urea market would have bullish effects.
- The Iranian uprising and what it means for production - why does Iran matter? A lot of the world either cannot or will not do business with the nation as it stands today. Well, it matters because Iran is still the world's 3rd largest exporter (according to 2024 values). If production continues to suffer due to gas shortages or worse, due to their domestic uprising against the current regime, that hurts the world as it reduces supplies. Please trust me when I say Iran matters whether you live in a country that does business with them or not.
- India's approach to buying - the world has learned that it can take advantage of India. I mean, why not? They are paying for urea using government money and if their stockpiles get too low, their own people will rise up. Of India's last 10 tenders, only twice have they gotten the tons they wanted. Every other time they have fallen short and watched global prices rally as a result. India fell short in their last tender. Will they reapproach the market in the coming weeks and provide even more bullishness before the Northern Hemisphere spring? Or will they drag their feet, hoping to put pressure on values before they buy? India matters.
- How does China approach exporting in 2026 after a very healthy 2025 - historically speaking, China normally exports 5 to 5.5M tons per year. In 2024, they exported a paltry 262K tons. However, we just received December 2025 data for China and they came just short of 5M tons. That is a HUGE increase from the year prior. Now the question is what they do for 2026. Will they stop exports until August/October like they are threatening for phosphate? Will the Chinese New Year see another large volume promised to the world? If China remains at bay, the market bulls will have all they need/want to push prices higher.
StoneX Ratio Calculation
The ratio calculation is derived from Bloomberg historical grains values as well as fertilizer values from StoneX, NPKFAS, and Argus.
The calculation is simply dividing the fertilizer price by each grain price.
All data was sourced from StoneX unless otherwise noted.