StoneX logo

Grains Weekly Analysis

By: StoneX Intelligence Brazil, StoneX Intelligence Brazil

Soybean acreage may increase over corn in the US 2022/23 crop 
 
Ana Luiza Lodi
Marcelo Bonifácio
João Pedro Lopes
  Luigi Bezzon
RATIOS BETWEEN SOYBEAN AND CORN CONTRACTS HAVE RISEN AND THERE ARE CONCERNS ABOUT FERTILIZER COSTS
Although crop losses in south america are currently in the spotlight, the planning of the us spring crop, which will start to be planted in april, is also on the market's radar.
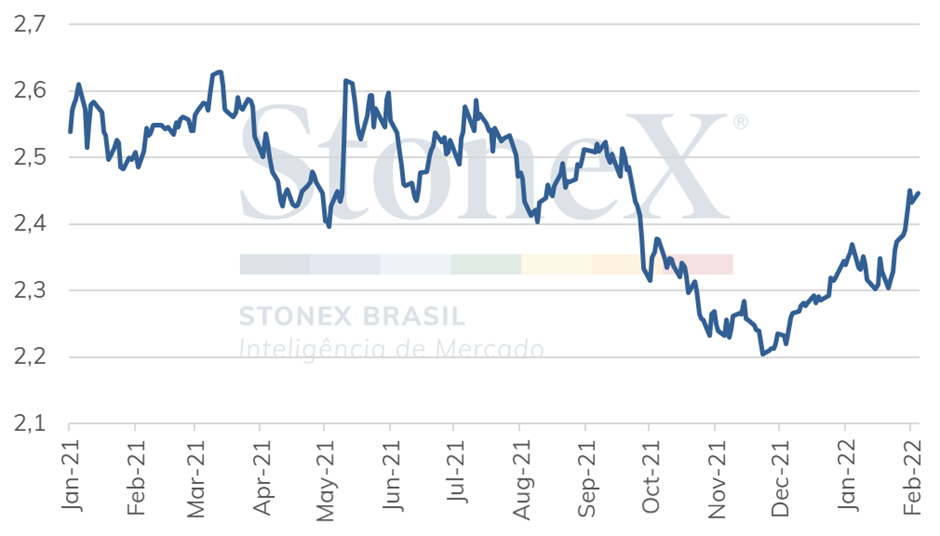
One of the most followed indicators is the ratio between the soybeans and corn prices on the CBOT, which would signal to the producer which crop is more profitable, possibly indicating area switching between the grains. The indicator represents the ratio between the two commodities prices and is always monitored when the planting decision is made from December to March. Historically, the ratio is observed between the November soybean contract and the December corn contract, representing the price of the crop entering the market after harvest. A higher ratio (above 2.35/2.4) would indicate a more advantageous soybean return than corn. On the other hand, a lower ratio would be favorable to expanding the cereal area. It is important to note that this ratio reference level may vary over the years due to production costs, productivity, etc. In a long historical series, it is observed that the ratios tend to oscillate around 2.5.
For most of 2021, the ratios were higher as soybean prices were supported by the prospect of limited stocks in the US. However, this scenario has changed since last September, with the US harvesting an excellent crop and the country's soybean exports trending lower. In addition, the corn balance sheet situation is also not quiet, supporting grain prices. As a result, the ratios have started to rise again, standing at around 2.4, with South American crop failures standing out. Therefore, this level would not offer much "advantage" to either commodity. Still, it should be pointed out that the current situation of soybean losses is more worrying since Brazil harvests most of its corn in the second crop. On the other hand, it is always good to remember that the North American producer has a tradition of growing corn and likes to plant this cereal, which ends up conferring a certain preference, even when the ratios are not favoring this choice.
Soybean-Corn Ratio on the CBOT (SX2/CZ2)
image 28574
Source: CME. Design: StoneX.
 
Besides the profitability factor, translated through the ratios, for the 2022/23 cycle, to make his decision, the farmer also needs to take into account the issue of production costs, especially fertilizers. For being a crop more dependent on fertilizers for good development, corn historically demands a higher expense for its production, a great disadvantage when the exchange ratios are at very degraded levels for farmers.
According to the USDA, fertilizers historically represent about 6% of soybean production costs. For corn, this representation rises to about 17%.
Over the last few months, fertilizer prices have been climbing steeply, approaching all-time highs earlier this year. However, regarding the competitiveness factor between corn and soybean today, nitrogen fertilizers should be the point of attention for the spring crop of the 2022/23 cycle in the United States. 
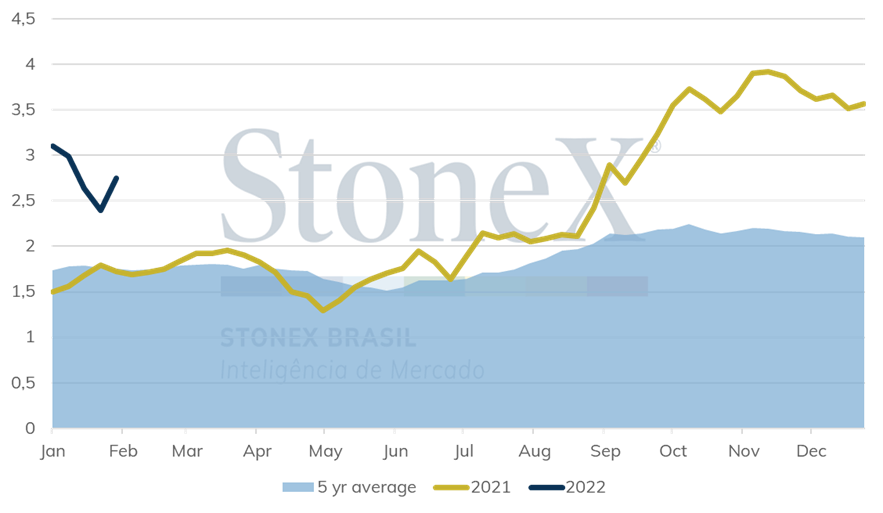
Nitrogen applications, in turn, are essential for seeding corn, unlike soybeans, which fix nitrogen naturally in the soil. Only in the second half of last year, the urea price indicator in the US Gulf region jumped 80%, currently priced at USD 590/ton, 56% more expensive than a year ago. It is worth noting that since the turn of the year, urea has been undergoing major corrections; in any case, the exchange ratios remain at very high levels and are bad for the farmer.
Urea-corn exchange ratio in the US (a ton of corn/ton of urea)
image 28575
Source: StoneX. Design: StoneX.
 
When looking at the P market, for example, important for soybean sowing, the situation is also of higher prices, but at a less accelerated magnitude than nitrogenous. For example, DAP in the US showed a 19% increase in the second half of 2021, priced at USD 738/ton CFR in the first week of this month. The farmer should thus find prices 33% higher compared to February/21, a less alarming situation than urea.
Considering the nutritional needs of each crop and the price behavior of fertilizers in recent months, there is an economic incentive to plant soybeans, at least from the production costs perspective. With the escalation of fertilizer prices last year much has been discussed on switching corn area for soybean in the next American crop. However, this decision depends on several other variables, such as the price of commodities themselves and each region's ratio and intrinsic cultural factors.
In any case, although discussions about the North American area will remain for quite some time, the situation of a world balance without much slack for both soybeans and corn should direct a planted area that has the potential to avoid major rationing on the supply side.
Considering the current situation, in which the shortfall in South America is of more concern for soybeans (which have the production extremely concentrated) than for corn, the US would need to plant about 90 million acres of soybeans and 91 million acres of corn to ease the problems in the south of the continent. This would mean an increase in area for the oilseed and a decrease for the grain compared to last year. In addition, it is necessary to assume that yields would remain within the historical average. According to the USDA, 93.4 million acres of corn and 87.2 million acres of soybean were sown in the country in the last cycle.

 
  • Grains & Oilseeds

The StoneX Group Inc. group of companies provides financial services worldwide through its subsidiaries, including physical commodities, securities, exchange-traded and over-the-counter derivatives, risk management, global payments and foreign exchange products in accordance with applicable law in the jurisdictions where services are provided. References to over-the-counter (“OTC”) products or swaps are made on behalf of StoneX Markets LLC (“SXM”), a member of the National Futures Association (“NFA”) and provisionally registered with the U.S. Commodity Futures Trading Commission (“CFTC”) as a swap dealer. SXM’s products are designed only for individuals or firms who qualify under CFTC rules as an ‘Eligible Contract Participant’ (“ECP”) and who have been accepted as customers of SXM. StoneX Financial Inc. (“SFI”) is a member of FINRA/NFA/SIPC and registered with the MSRB. SFI is registered with the U.S. Securities and Exchange Commission (“SEC”) as a Broker-Dealer and with the CFTC as a Futures Commission Merchant and Commodity Trading Adviser. References to securities trading are made on behalf of the BD Division of SFI and are intended only for an audience of institutional clients as defined by FINRA Rule 4512(c). References to exchange-traded futures and options are made on behalf of the FCM Division of SFI . StoneX is a trading name of StoneX Financial Ltd (“SFL”). SFL is registered in England and Wales, Company No. 5616586. SFL is authorized and regulated by the Financial Conduct Authority [FRN 446717] to provide to professional and eligible customers including: arrangement, execution and, where required, clearing derivative transactions in exchange traded futures and options. SFL is also authorised to engage in the arrangement and execution of transactions in certain OTC products, certain securities trading, precious metals trading and payment services to eligible customers. SFL is authorised & regulated by the Financial Conduct Authority under the Payment Services Regulations 2017 for the provision of payment services. SFL is a category 1 ring-dealing member of the London Metal Exchange. In addition SFL also engages in other physically delivered commodities business and other general business activities which are unregulated and not required to be authorised by the Financial Conduct Authority. StoneX Group Inc. acts as agent for SFL in New York with respect to its payments services business. StoneX APAC Pte. Ltd. acts as agent for SFL in Singapore with respect to its payments services business. ‘StoneX’ is the trade name used by StoneX Group Inc. and all its associated entities and subsidiaries.
 
Trading swaps and over-the-counter derivatives, exchange-traded derivatives and options and securities involves substantial risk and is not suitable for all investors. Past performance of any futures or option is not indicative of future success. Indicators are not a trading system and are not published as a specific trade recommendation. The information herein is not a recommendation to trade nor investment research or an offer to buy or sell any derivative or security. It does not take into account your particular investment objectives, financial situation or needs and does not create a binding obligation on any of the StoneX group of companies to enter into any transaction with you. You are advised to perform an independent investigation of any transaction to determine whether any transaction is suitable for you. No part of this material may be copied, photocopied or duplicated in any form by any means or redistributed without the prior written consent of StoneX Group Inc.
 
© 2026 StoneX Group Inc. All Rights Reserved.

Satellite view of Earth at night showing illuminated cities across Asia and the Middle East

Discover more insights

Our subscribers have access to comprehensive market analysis from StoneX spanning commodities, equities, currencies and more.

Related articles for Grains & Oilseeds

Perspective: Morning Commentary for August 7

August 7 – The U.S. economy unexpectedly lost 23k jobs in July, dramatically below market expectations of an 80k increase and marking the worst Non-Farm Payrolls print since February. Furthermore, May and June were both revised sharply downward, with combined revisions showing 103k fewer jobs than previously reported. Outside of the healthcare sector, which added 22k jobs in July, the losses were very broad-based. Government payrolls saw the largest decline, shedding 53k jobs in July, the largest seen since October 2025, while June was revised down to show a loss of 10k jobs as well. The private sector at least saw growth, adding 30k jobs in July, now matching the month prior after it was revised down from the 49k initially reported, and substantially missing forecasts of 78k jobs being added. This is a sharp reversal in course from the largely better than expected U.S. labor data seen earlier this week.

Mike Castle
Mike Castle
  • Grains & Oilseeds
  • Energy
  • Dairy
  • Renewable Fuels
  • Cocoa
  • Coffee
  • Cotton
  • Sugar
  • Meats & Livestock
  • Forest Products

Morning Grain Comments 8-7

Morning Grain Market Comments - Matt Zeller

Matt Zeller
Matt Zeller
  • Grains & Oilseeds

Perspective: Mid-Day Commentary for August 6

August 6 – Stocks remain quietly mixed at midday as both the S&P 500 and Dow Jones remain just below their fresh all-time highs put in yesterday. This is allowing the VIX to cool to a four-week low below the 15.4 mark, reflecting the collective sigh of relief in the market amid largely better than expected U.S. economic data today. The dollar remains quietly in the green in its relatively tight range this week, trading at 99.9 at the time of writing. Treasuries remain elevated but have cooled from their recent peaks, with 30-year yields trading at 5.189%, 10-year yields trading at 4.647%, and 2-year yields trading at 4.229% at midday. Crude oil also remains quietly in the green, with nearby WTI up 2.3% on the day trading near $76.80 and nearby Brent up 2.4% on the day trading near $81.40. The ags remain mixed, with the wheat complex now squarely in the red while corn and soybeans cling to small gains, and the livestock complex largely pushes lower.

Mike Castle
Mike Castle
  • Grains & Oilseeds
StoneX: We open markets

Our market expertise, advanced platforms, global reach, culture of full transparency and commitment to our clients’ success all set us apart in the financial marketplace.

Reach

With access to 40+ derivatives exchanges, 180+ foreign exchange markets, nearly every global securities marketplace and numerous bi-lateral liquidity venues, StoneX’s digital network and deep relationships can take clients anywhere they want to go.

Transparency

As a publicly traded company meeting the highest standards of regulatory compliance in the markets we serve, our financials and record of accomplishment are matters of public record. StoneX’s commitment to “doing the right thing over the easy thing” sets us apart in the industry and helps us build respect, client trust and new partnerships.

Expertise

From our proprietary Market Intelligence platform, to “boots on the ground” expertise from award-winning traders and professionals, we connect our clients directly to actionable insights they can use to make more informed decisions and achieve their goals in the global markets.