Last Friday (12), the USDA released its WASDE report, highly anticipated as it is the first in which yield revisions for the new US crop based on producer surveys occur for soybeans and corn. In addition, crops with different calendars, in general, also post revisions.
Soybean
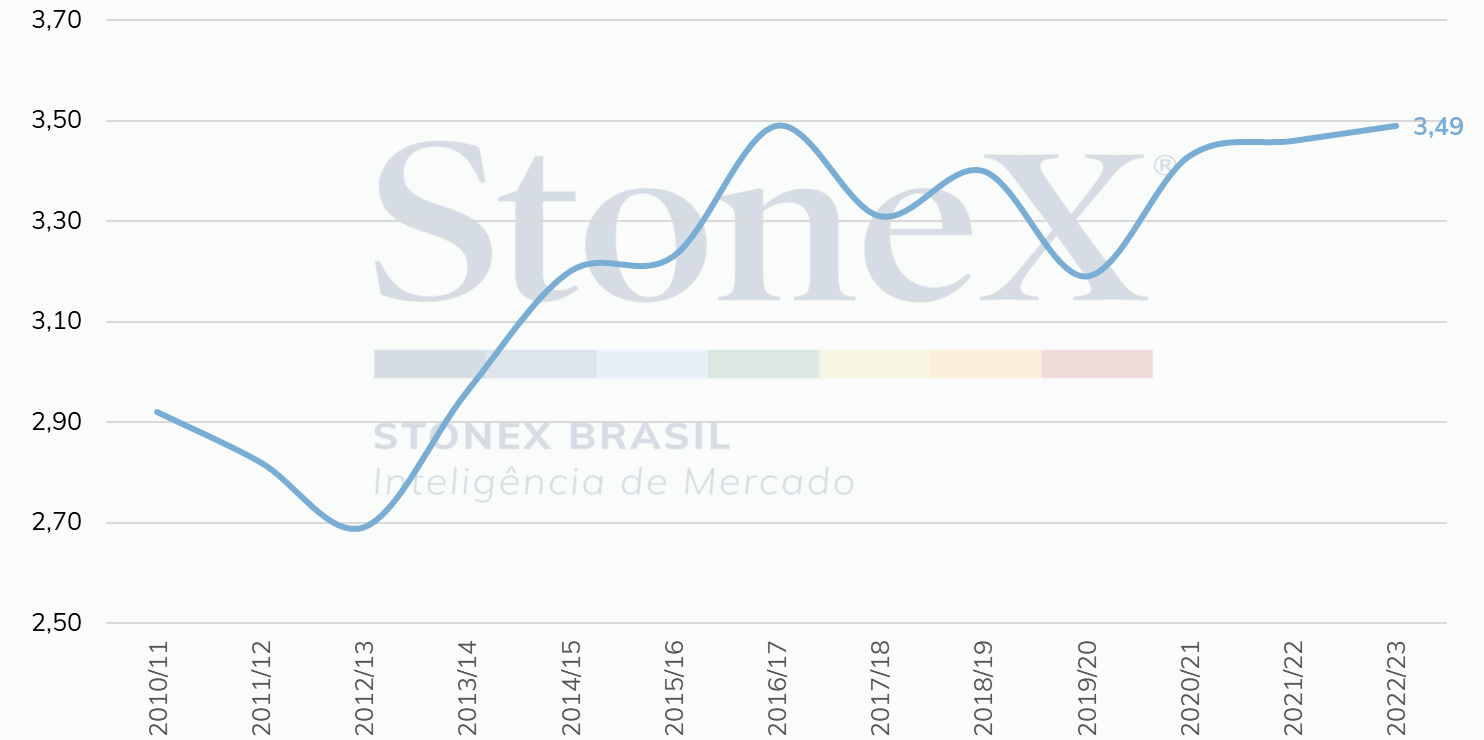
For soybeans, the USDA adjusted the North American yield 2022/23, but upwards, in the opposite direction of what the market expected, at 3.49 tonnes per hectare. This level would be a record, taking production to 123.3 million tonnes, the highest volume ever achieved by the country. However, it should be noted that there was a small downward revision in acreage due to planting delays, and the acreage figure released on June 30 did not fully capture the results of the states further north in the belt.
This outlook for the North American new crop was surprising, as the weather in the US has registered a drier and warmer pattern, especially in the west of the producing region. However, as August is very important for soybeans, as it concentrates the grain filling phase, the reports for the coming months should still bring changes.
Soybean yield - US (ton/ha)
Source: USDA. Design: StoneX.
Regarding the demand variables, the highlight was the small cut in exports of the US 2021/22 crop, which stood at 58.8 million tonnes, remembering that the cycle ends at the end of August.
There were no significant adjustments to the numbers of Brazil, Argentina and China.
The estimated world balance for the 2022/23 cycle shows production above consumption, ending stocks at 101.4 million tons.
Corn
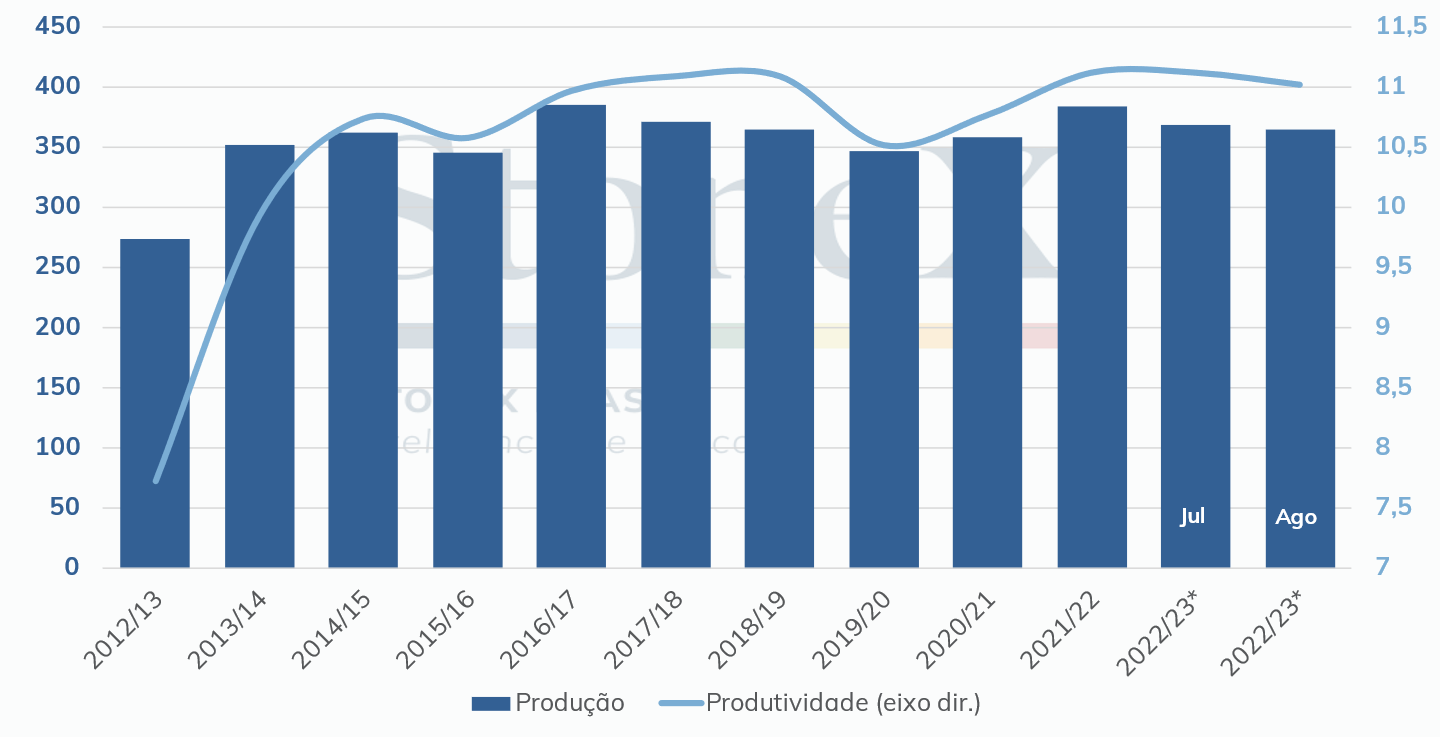
As with soybeans, the USDA also adjusted US corn yields. As a result, the yield of the 2022/23 crop was reduced from 11.11 ton/ha to 11.01 ton/ha, against the market average estimates of 11.04 ton/ha. In addition, due to the planting delay, the market was also expecting a revision in the US acreage. However, it did not change much, receiving a slight cut of 0.1% compared to the previous figure to 33.1 million hectares.
Thus, the US 2022/23 production fell by 1% compared to the July estimate, to 364.7 million tonnes, a figure that surprised the market since the average estimates pointed to production at 365.6 million tonnes, but in line with the estimate by StoneX earlier this month (364.5 million tonnes).
On the demand side, the Department has made adjustments for the current (21/22) and the next crop. Starting with the 21/22 crop, the USDA reduced domestic consumption by 0.5 million tonnes to 314.8 million, driven by the expectation of lower demand for ethanol production. Regarding the 22/23 crop, the reduction in demand for North American corn occurred both in the domestic and foreign markets. This time motivated by a perspective of a drop in the use for animal feed, domestic consumption was also reduced by 0.5 million tonnes to 308.6 million. On the other hand, exports were cut by 635,000 tonnes, to 60.3 million.
Corn yield (ton/ha) and production (MMT) - US
Source: USDA. Design: StoneX. *USDA estimate.
Amid these adjustments, ending stocks for the 22/23 crop fell about 5.6% from July to 35.3 million tonnes, below market average estimates of 35.6 million tonnes but above the 33.2 million tonnes estimated by StoneX.
Regarding the other players, we highlight the increase in the Ukrainian 22/23 production estimate from 25 million to 30 million tonnes, accompanied by a positive revision in exports, from 9 million to 12.5 million tonnes, and in Ukrainian domestic consumption, from 10.7 million to 11.7 million tonnes. Following the recently signed agreement to create a Ukrainian export corridor through the Black Sea, the flow of Ukrainian grain through Black Sea ports has resumed. However, the volume observed so far is still much lower than before the conflict. Still, as new vessels leave Ukrainian ports and there are no records of non-compliance with the agreement, optimism is growing about an increase in the supply of corn in the international market.
The USDA brought a drop in production in the European Union, from 68 million to 60 million tonnes. Europe has been going through a severe drought, a factor that motivated the cut mentioned. Amid the lower production, the Department expects imports to total 19 million tonnes in 2022/23, 3 million tonnes higher than the previous estimate.
As for the world balance, the ending stocks expected for the 2021/22 and 2022/23 crops dropped to 311.8 million and 306.7 million tonnes, numbers lower than the market's average estimate.
Wheat
As with soybean and corn, wheat also drew attention as production estimates were revised. In the US domestic market, the 2022/23 crop was slightly adjusted from 48.47 million to 48.52 million tonnes due to a yield increase to 47.50 bu/acre. However, the increase in the estimate for the volume produced fell short expectation of around 48.78 million tonnes. Even so, it is worth noting that it is higher than the previous crop at 44.79 million tonnes.
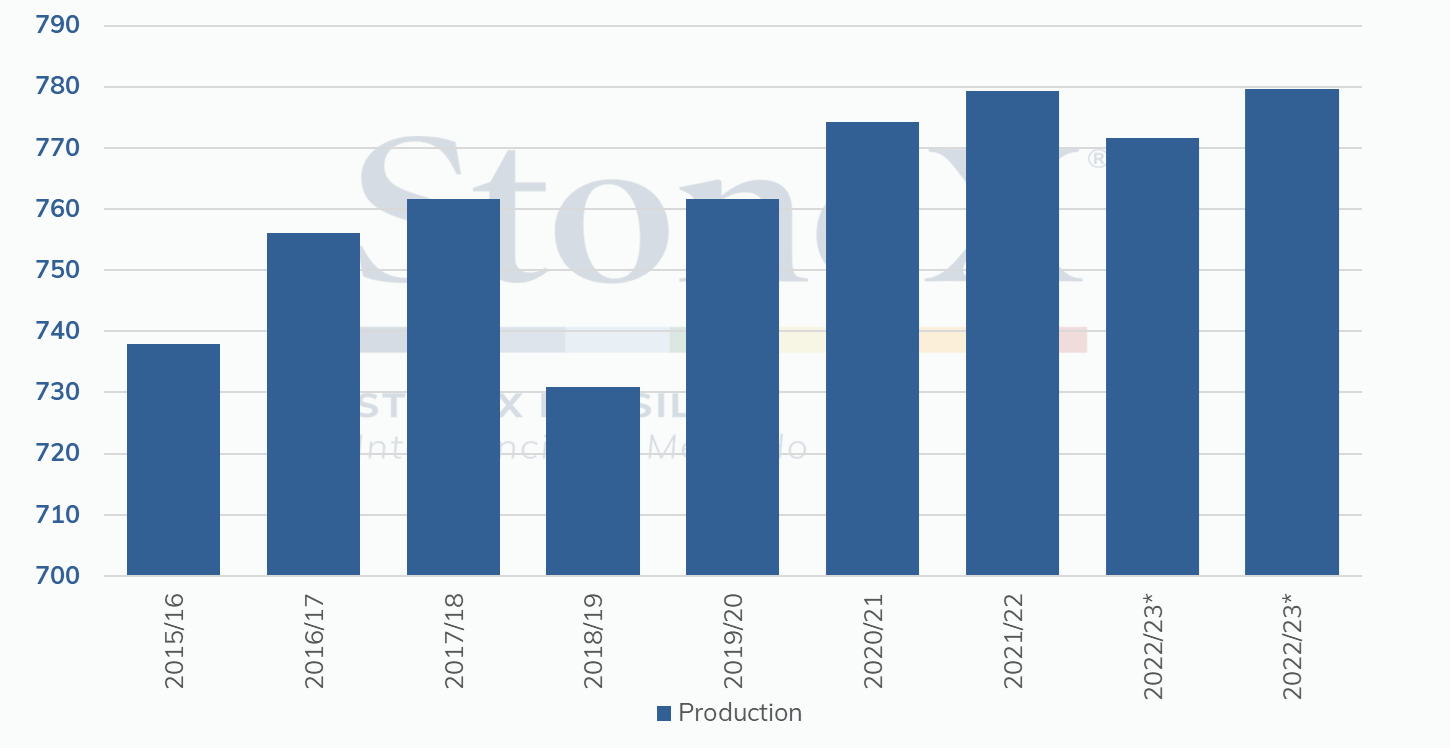
The world production increased from 771.64 million tonnes (July WASDE) to 779.60 million tonnes in the 2022/23 crop, looking more promising. Nevertheless, consumption continues to be higher than production, drawing attention to the trend of food prices at higher levels. As a result, consumption is expected at 788.60 million tonnes, 9 million tonnes higher than production. In addition, ending stocks dropped slightly, as well as the stock/use ratio.
In other players, it is possible to see a drop of 2 million tonnes in European Union production and 500,000 in Argentina's production. On the other hand, there was an increase of 1 million tonnes in Canada's production and 200,000 in Brazil.
More sharply, Russia's production in the 2022/23 crop increased by 6.5 million tonnes to 88 million tonnes, while China and Australia had increases of 3 million tonnes each, with their production standing at 33 million and 33 million tonnes.
World wheat production trend (MMT)
Source: USDA. Design: StoneX. *USDA estimate.
The USDA’s August WASDE created an unprecedented event for the cotton market on Friday (12). The report brought new projections for the US 2022/23 cycle with revisions that could be considered aggressive which boosted cotton futures to daily highs on Friday, with the report impacts still echoing around the market at the beginning of this week. In addition, the declines in world consumption have been slower than production, even with signs of global stagflation. Accordingly, global consumption stands at 25.9 million tonnes while production stands at around 25.5 million tonnes, a deficit that fueled bullish sentiment.
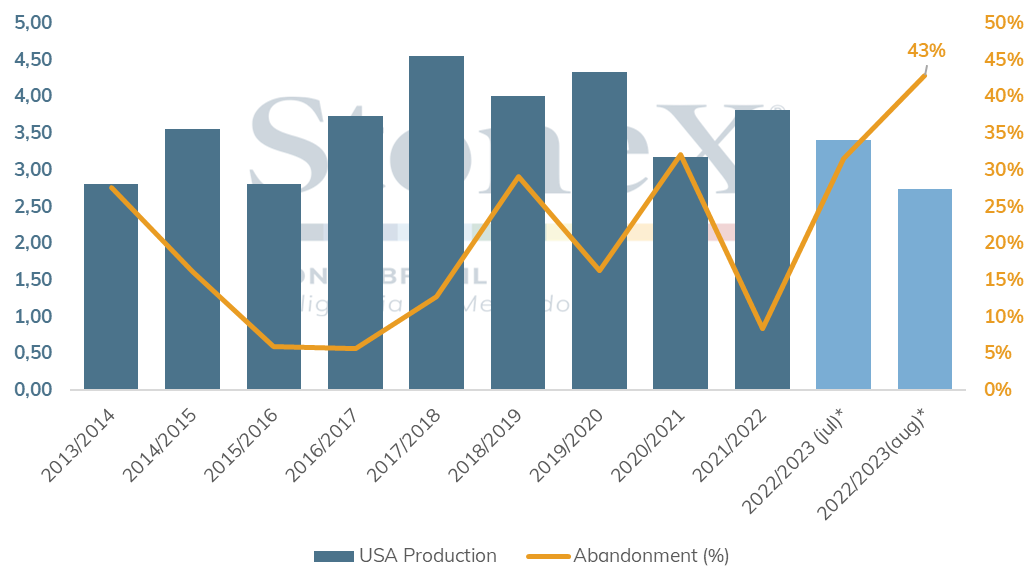
The US 2022/23 crop should be 28% lower than the previous one, with its worst result since 2009/10, producing only 2.7 million tonnes. Regarding the July report, the USDA cut 3 million bales to supply, a more intense adjustment than usual for the report and very aggressive than the market's expectations. This resulted in an 18% drop in exports (2.6 million tonnes) and one of the lowest ending stocks in the country's history, with only 1.8 million tonnes.
All this is a consequence of the exceptional drought that covered a large part of the country's cotton belt, especially Texas, responsible for 60% of the national supply. With the water stress, intensified by the high summer temperatures, the non-irrigated crops are producing very little, to the point of being abandoned by farmers. Thus, the country's abandonment rate has already reached 43% for the current cycle, in contrast to the 8% recorded in the previous crop (in Texas alone, this rate has already reached 68% of crops). Thus, even though the market had already anticipated the crop failure, WASDE surprised the market by showing that it would be more pronounced than previously predicted.
Considering the global balance, adjustments in the US crop led to the variations. Thus, production, ending stocks and export indicators reduced to almost the same extent as the US. Domestic consumption was also readjusted downwards in the main cotton importing countries, such as Bangladesh, Vietnam and Pakistan, but more timidly, a consequence of the slowdown in the world economy and the advance of inflation. China had a more significant cut in imports concerning the figure projected in July, a drop of 10%, but the internalized volume should still be higher than that recorded in 2021/22.
Cotton crop production (MMT) and abandonment rate (%) - US
Source: USDA. Design: StoneX.