

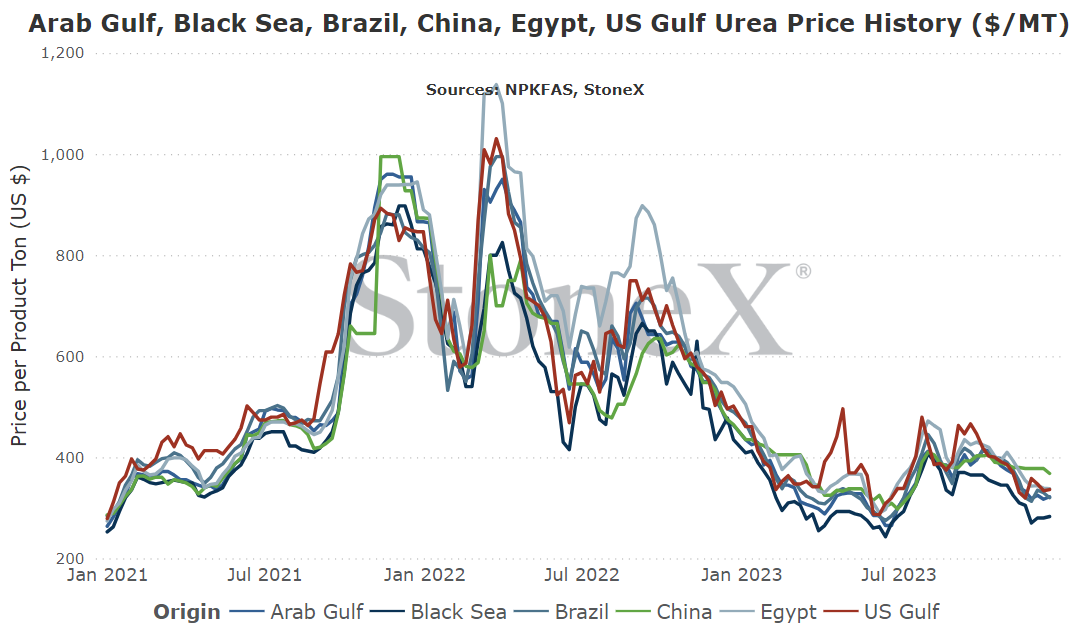
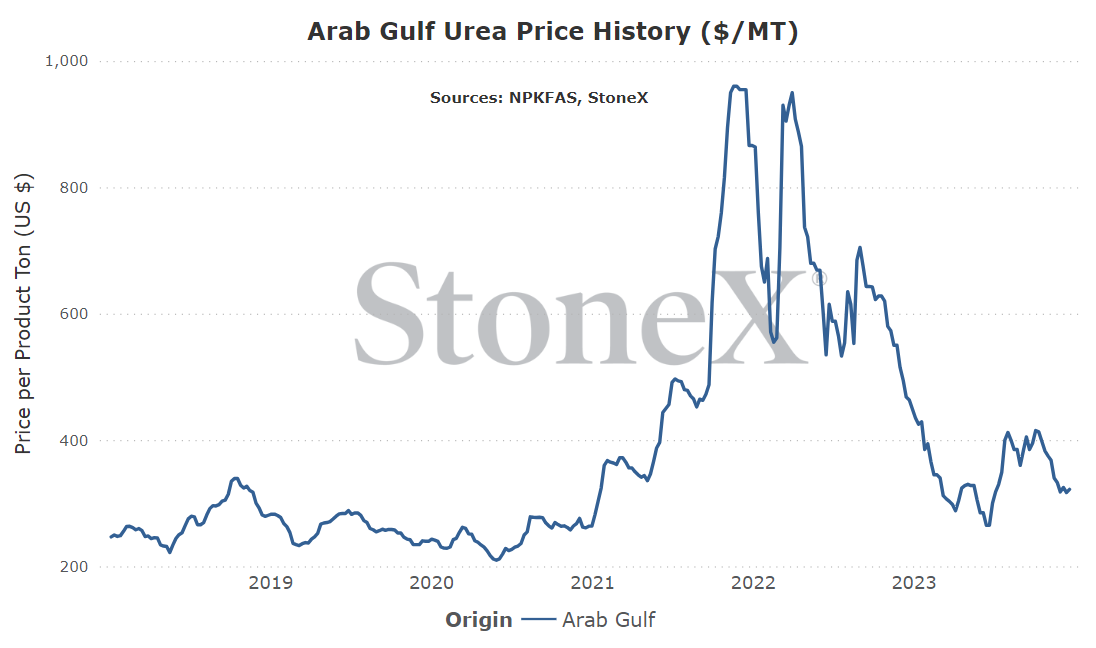
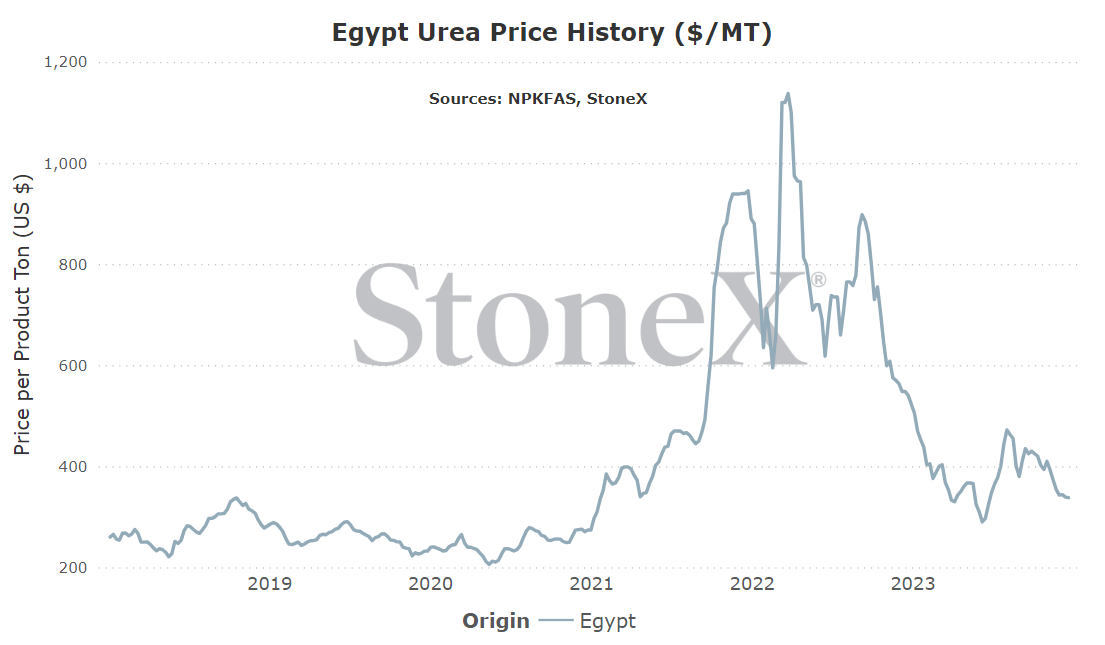
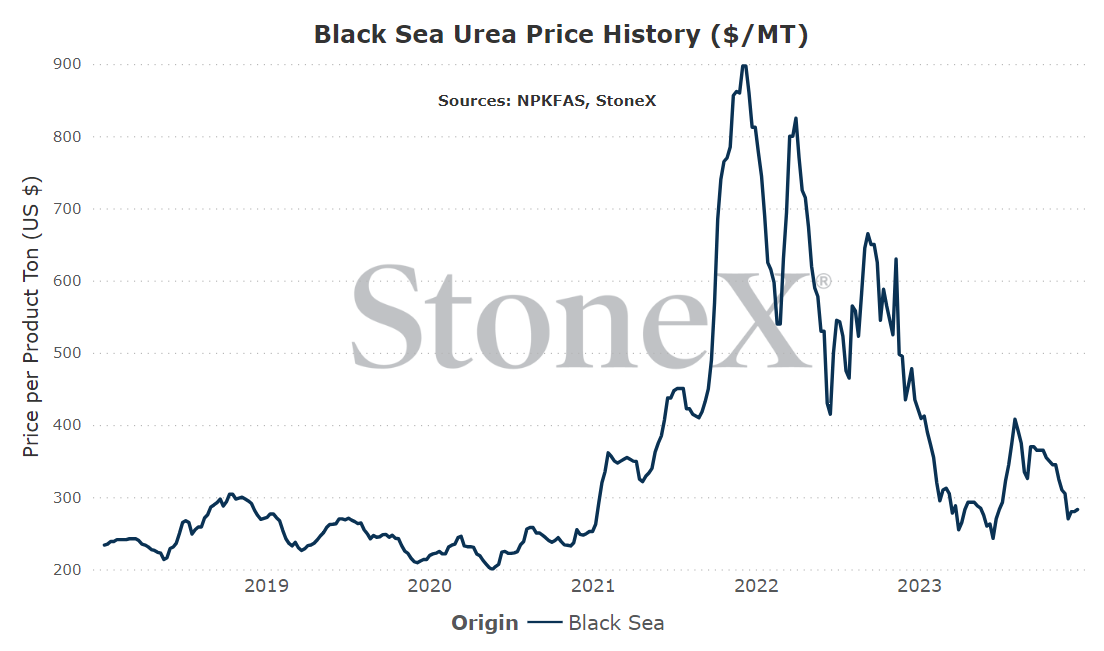
The intention of the below graphs are not to use to say "my price should be X based on this graph". These prices are derived from an FOB price point average. The intent is to show major global price movement trends. Your values will likely have significant basis difference (similar to your local grain price being different than the traded market price).
This graph is labeled as MT in USD currency.
While the fertilizer futures market is far from as liquid as its grain counterparts, it is still active and gives us an insight into what the market is thinking.
Please note that the values below can and will change daily. This is merely a look at where they are as of writing:
| NOLA Urea | Arab Gulf Urea | Egypt Urea | |
| January | $315 | $317.50 | $330.00 |
| February | $318 | $315.00 | - |
| March | $318.00 | - | - |
| April | $317.50 | - | - |
| May | $317.50 | - | - |
| June | $320.00 | - | - |
| July | $320.00 | - | - |
| August | $320.00 | - | - |
| September | $312.50 | - | - |
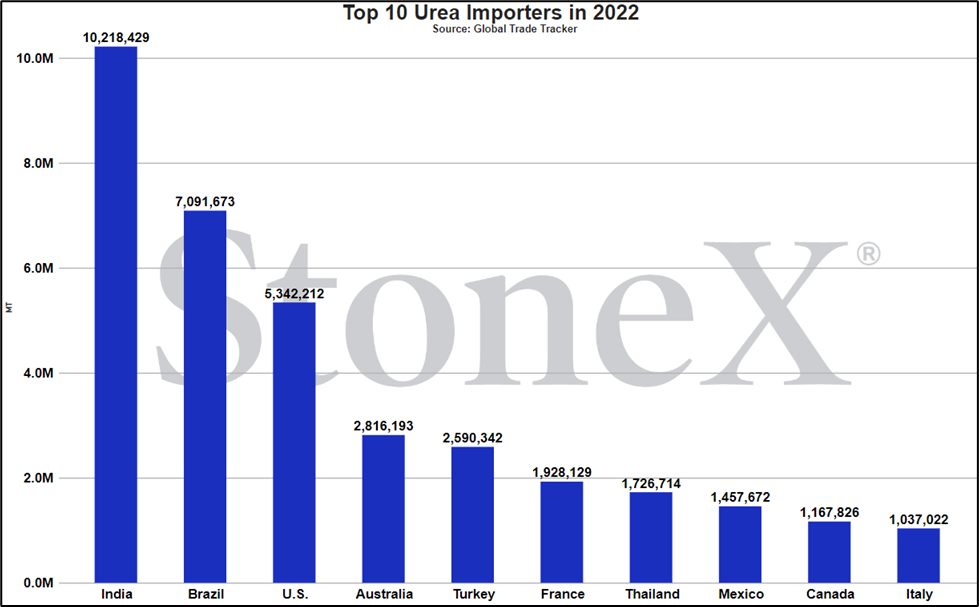
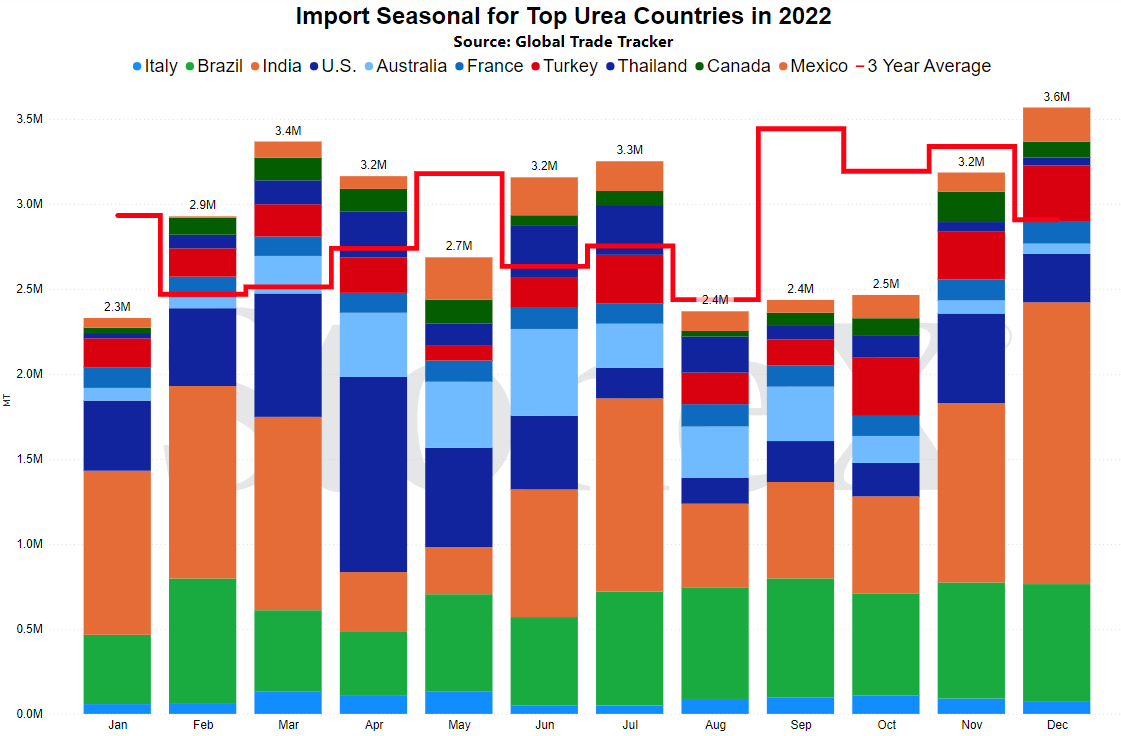
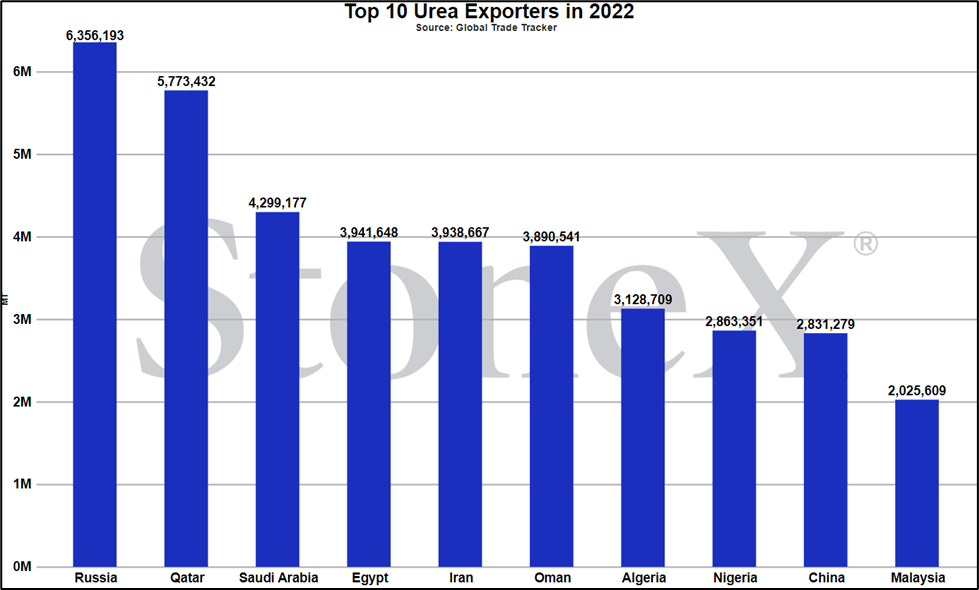
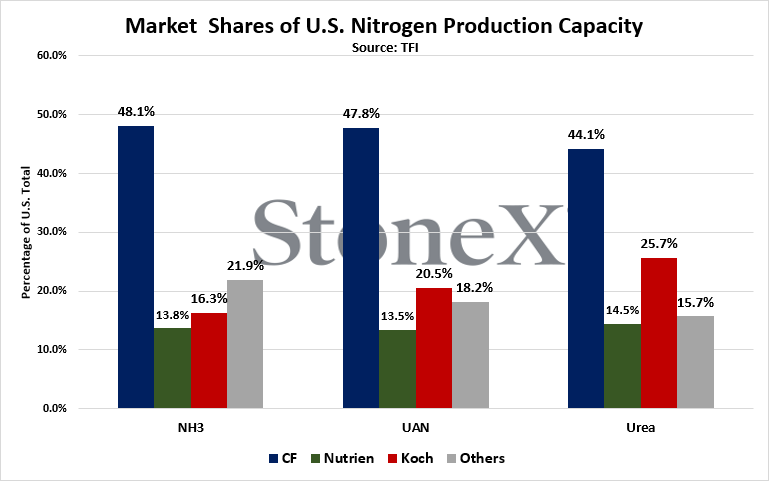
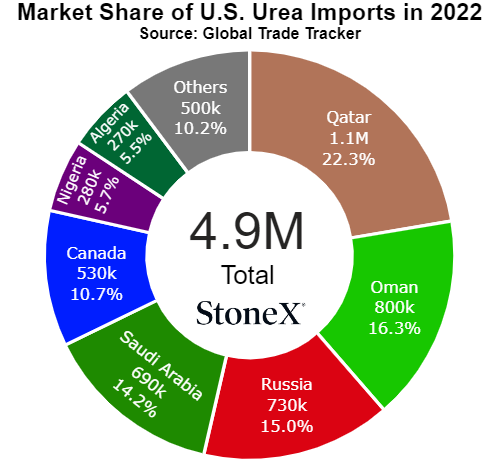
NOLA/New Orleans, Louisiana
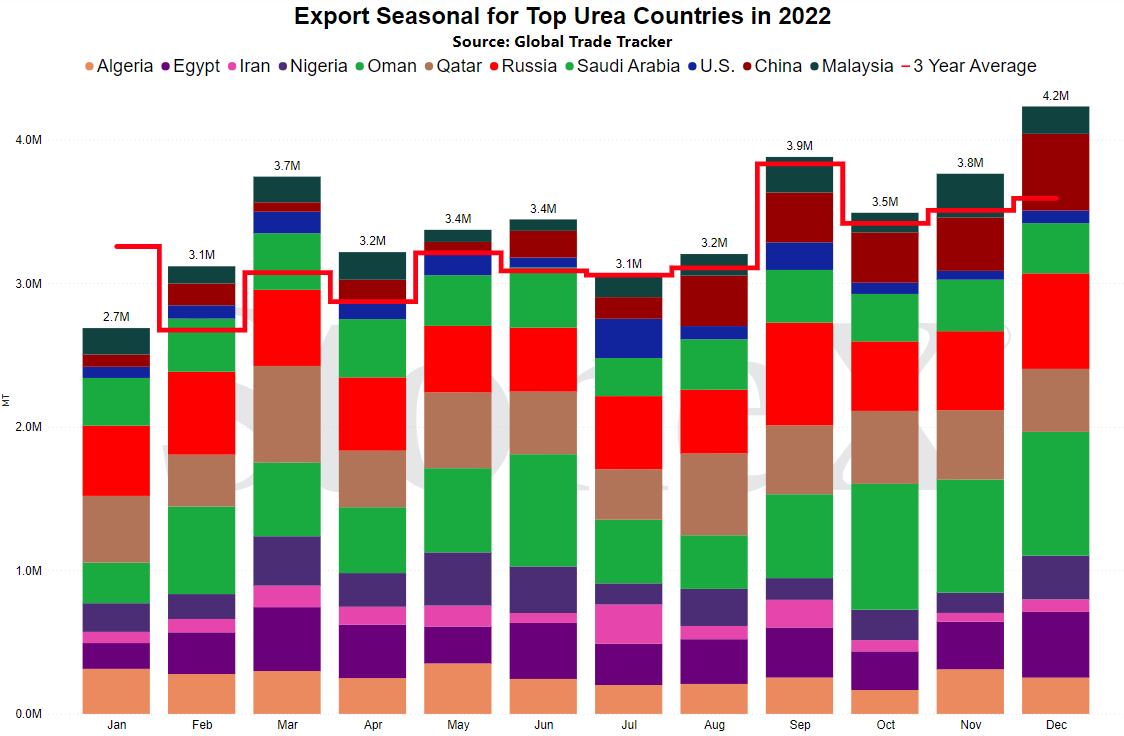
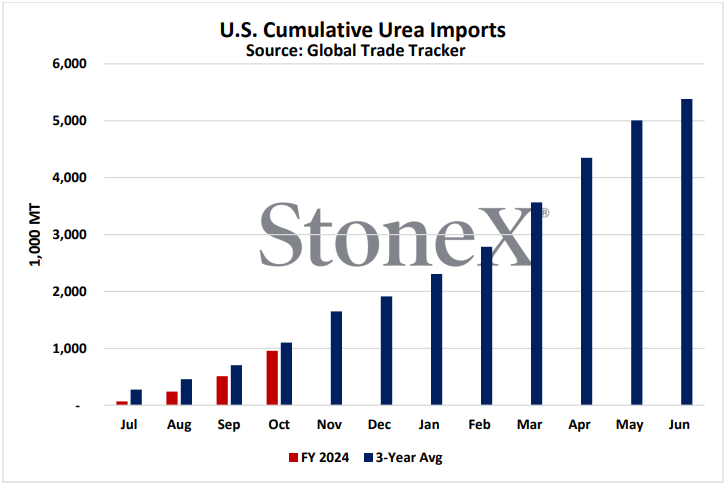
Number 3 global importer in 2022
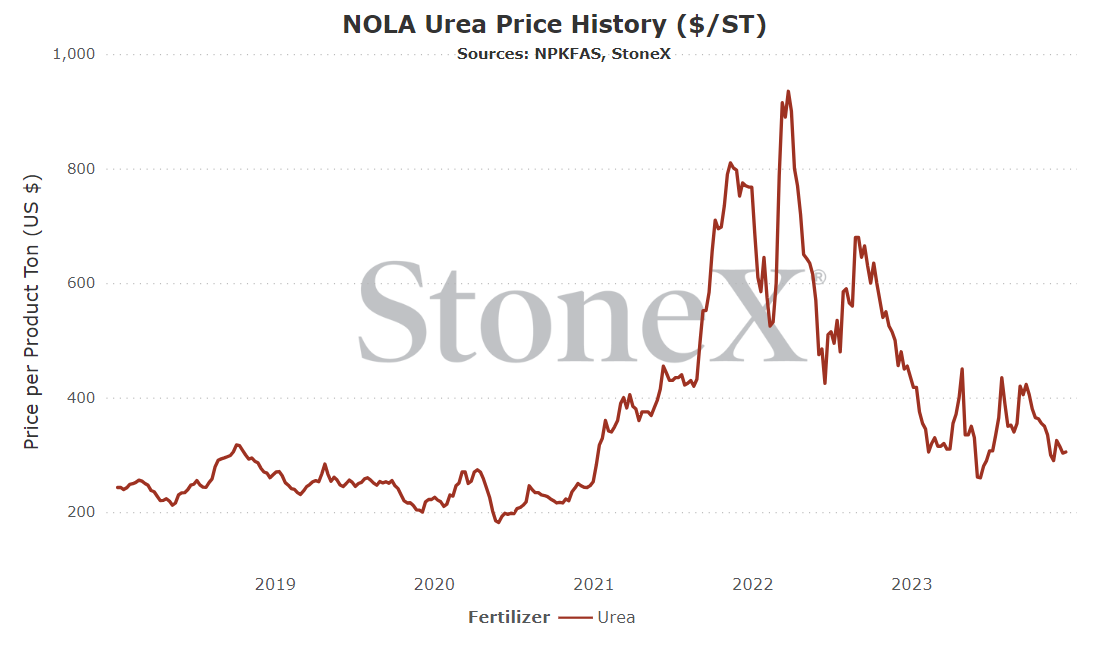
Price comparisons
Vs 30 days ago - +5% or approximately $15 higher
Vs 90 days ago - -28% or approximately $118 lower
Vs 6 months ago - +5% or approximately $15 higher
Vs 1 year ago - -33% or approximately $150 lower
U.S. Midwest Average
Vs 30 days ago - -16% or approximately $69 lower
Vs 90 days ago - -26% or approximately $124 lower
Vs 6 months ago - -24% or approximately $109 lower
Vs 1 year ago - -34% or approximately $185 lower
U.S. Southern Plains Average
Vs 30 days ago - -1% or approximately $5 lower
Vs 90 days ago - -27% or approximately $130 lower
Vs 6 months ago - -26% or approximately $123 lower
Vs 1 year ago - -33% or approximately $178 lower
U.S. Northern Plains Average
Vs 30 days ago - -10% or approximately $44 lower
Vs 90 days ago - -18% or approximately $86 lower
Vs 6 months ago - -15% or approximately $70 lower
Vs 1 year ago - -30% or approximately $163 lower
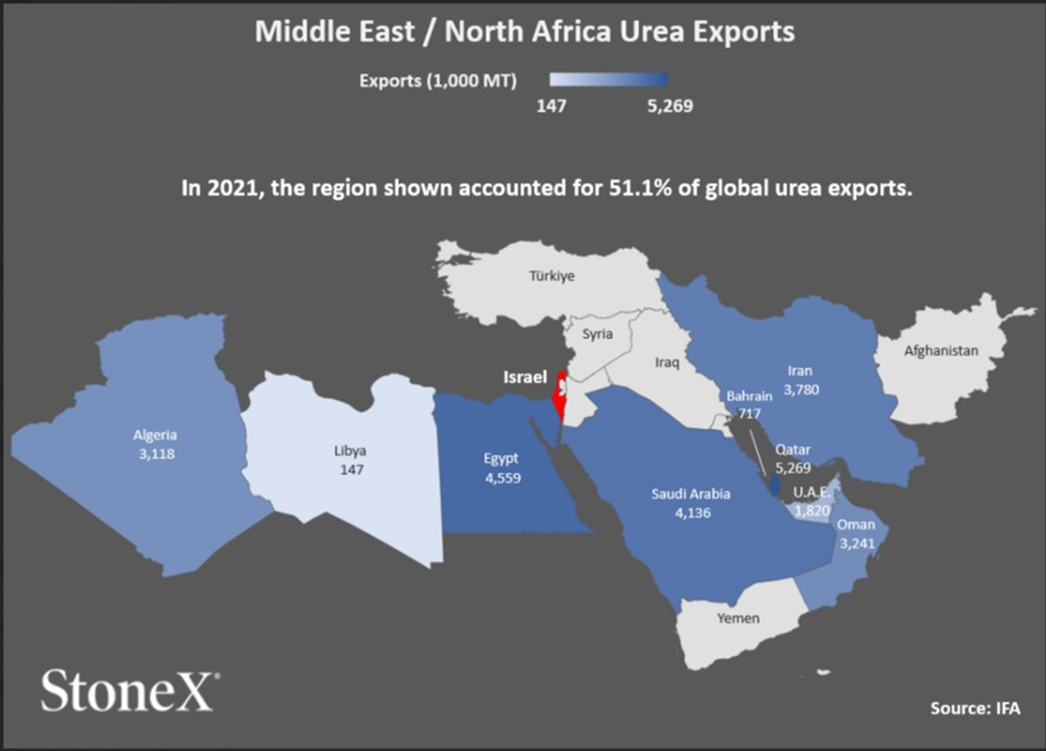
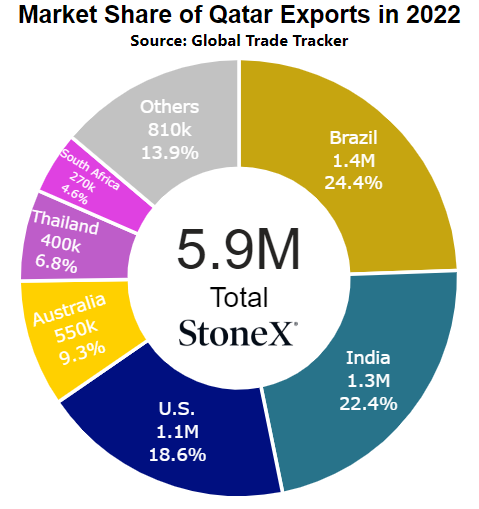
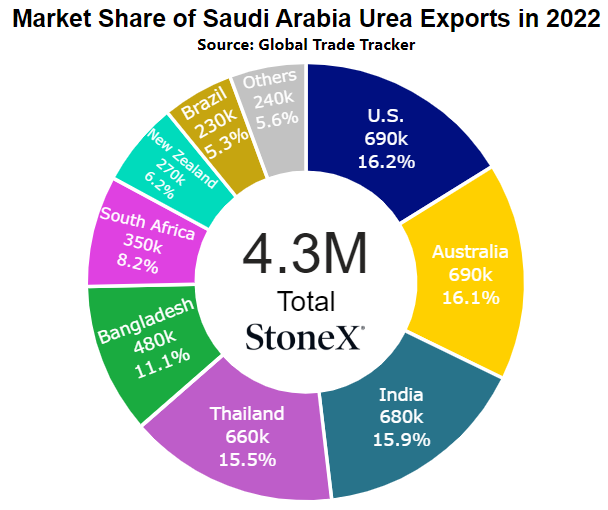
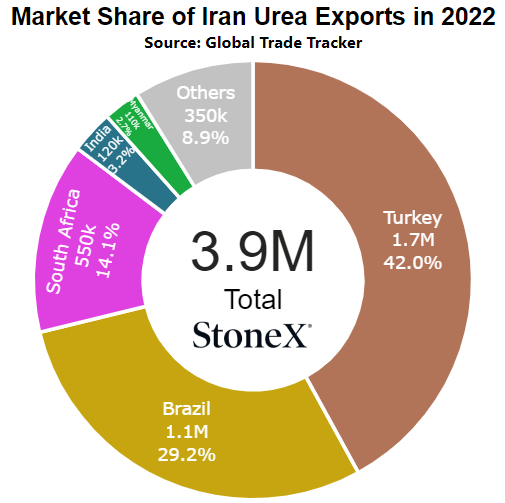
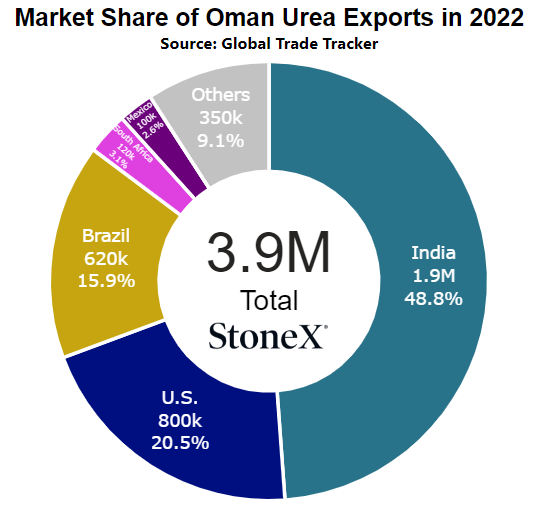
Middle East
Number 1 exporter (as a region, not as individual nations)
Vs 30 days ago - -3% or approximately $11 lower
Vs 90 days ago - -16% or approximately $63 lower
Vs 6 months ago - +22% or approximately $57 higher
Vs 1 year ago - -31% or approximately $142 lower
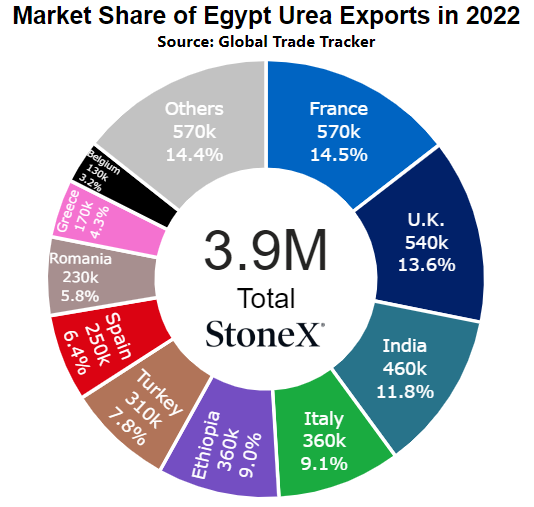
Egypt
Number 4 global exporter in 2022
Price comparisons
Vs 30 days ago - -4% or approximately $16 lower
Vs 90 days ago - -20% or approximately $87 lower
Vs 6 months ago - +4% or approximately $15 higher
Vs 1 year ago - -37% or approximately $202 lower
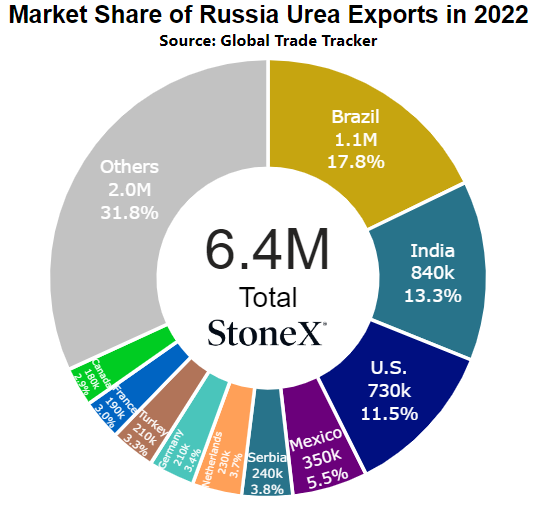
Black Sea
Number 1 global exporter in 2022
Price comparisons
Vs 30 days ago - -7% or approximately $23 lower
Vs 90 days ago - -23% or approximately $83 lower
Vs 6 months ago - +5% or approximately $13 higher
Vs 1 year ago - -35% or approximately $153 lower
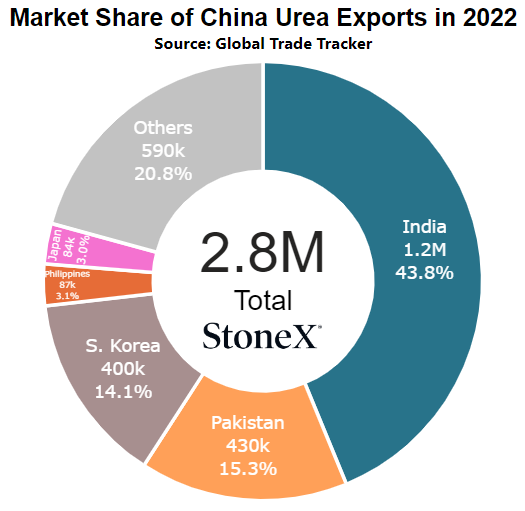
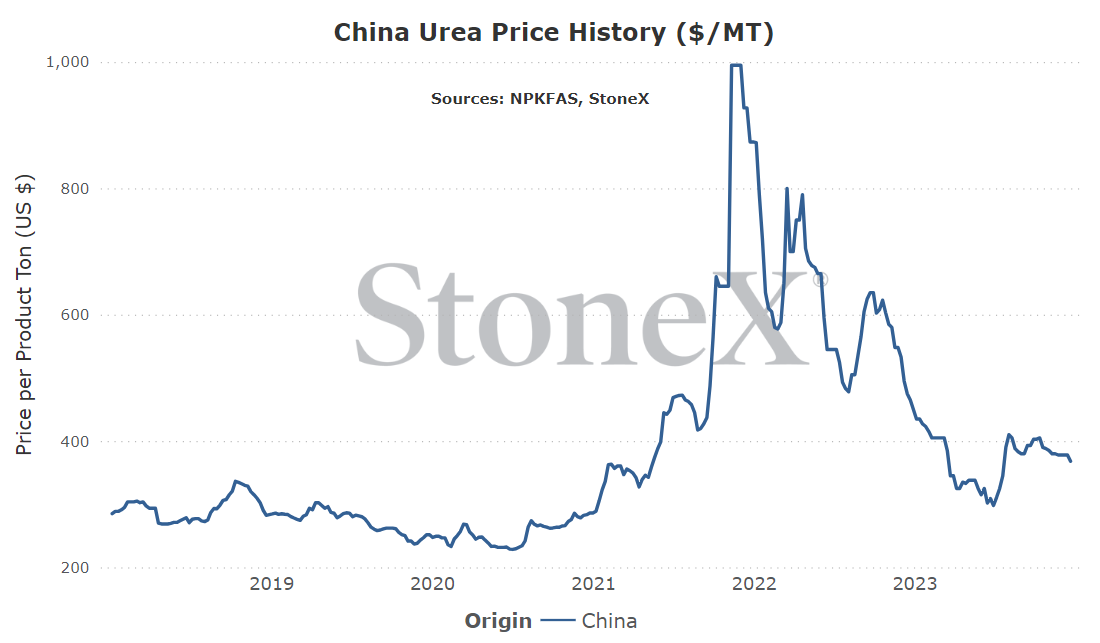
China
Number 9 global exporter in 2022
Price comparisons
Vs 30 days ago - -3% or approximately $10 lower
Vs 90 days ago - -6% or approximately $25 lower
Vs 6 months ago - +19% or approximately $59 higher
Vs 1 year ago - -21% or approximately $98 lower
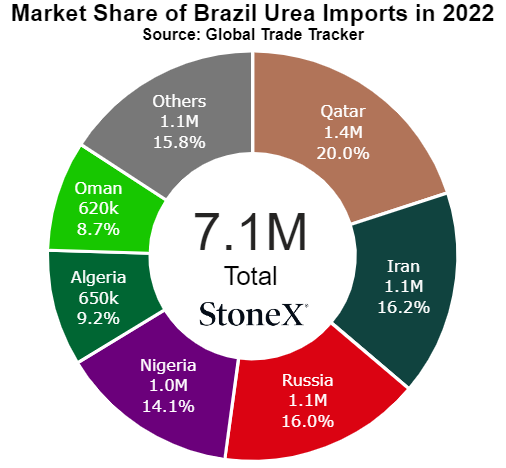
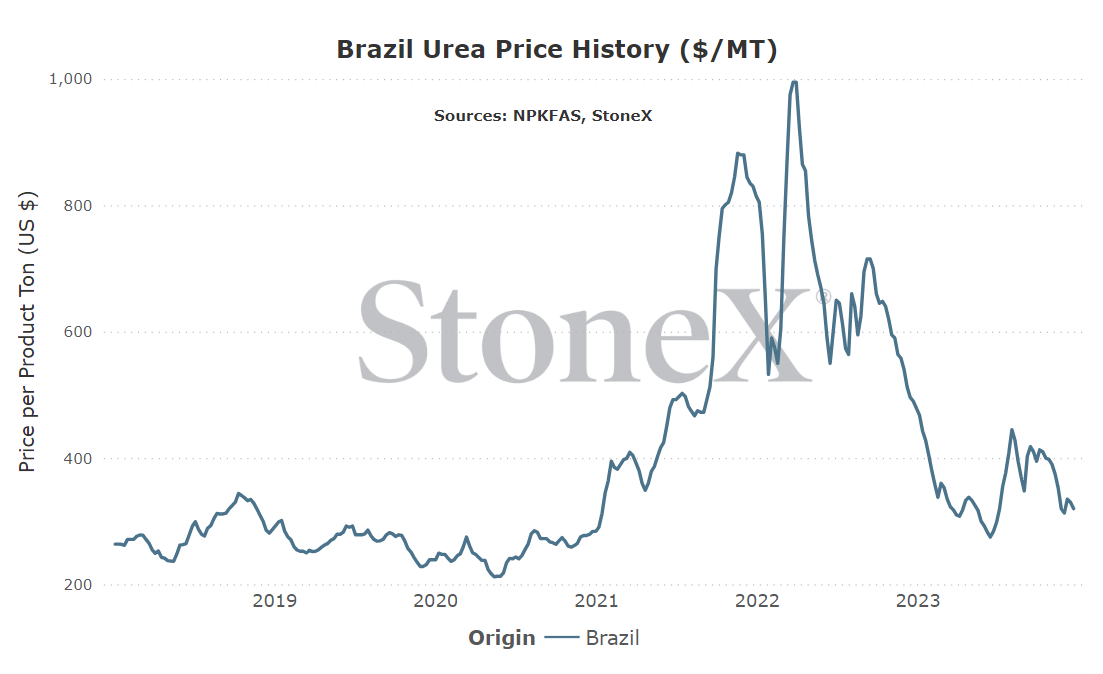
Brazil
Number 2 global importer in 2022
Price comparisons
Vs 30 days ago - unchanged vs last month
Vs 90 days ago - -22% or approximately $90 lower
Vs 6 months ago - +13% or approximately $37 higher
Vs 1 year ago - -35% or approximately $170 lower
- Middle East tension - I really, really do not want this to be a story. Unfortunately, Houthis continues to target Red Sea vessels with attack drones. Iran was linked to an attack on a vessel off the coast of India. Global production rates are obviously very important...but mean little if the market is unable to move the product. If these attacks escalate, at best vessel freights will climb and at worst will shut down. It is impossible to forecast Black Swan events...but this one is on the radar.
- Rebound in global demand - India surprised the world in stepping in just before Christmas weekend with a urea purchase tender. Now, if we see other global buyers step forward, manufacturers will have sales options...and typically that leads to higher price ideas. While we haven't seen a reaction yet, there is a lot of buying to be done before spring.
- China follows thru with export restriction plans - during "normal" times, China accounts for around 10% of global urea exports and based on announcements/reports, they will be cutting back exports from January 2024 thru March 2025 approximately 40% on average (typical 5MMT exported calendar year vs 4MMT proposed export allowance Jan '24 thru Mar '25). That would be a chunk of inventory missing from the global S&D.
- India goes ahead solo - in the bullish factors, I listed the world stepping in for competition with India which would drive prices higher. However, there are still a lot of tons in the marketplace looking for homes. In India's last purchase tender, there were 2M tons that we left in the market. Then think of all the production since that time. This doesn't feel like India can mop up global excess supply on its own. If the rest of the world stays out, prices probably continue to see pressure.
- China reverses course and exports heavily - never underestimate politics. Right now, the Chinese government is discussing/threatening export restrictions. However, domestic China can only hold so many tons and production rates continue to be heard solid. Low global values and full domestic storage could have the government turn a 180 and start allowing unexpected heavy exports. It wouldn't be the first time they have surprised us.
- European natural gas values fall, causing nitrogen production to restart - in the week's since Hamas's attack on Israel, the Dutch TTF market has fallen substantially. It topped out around $18MMbtu (for winter months) but has since dipped back into the $10 - $11MMbtu range. If gas values continue to drop, it is not out of the realm of possibility that offline production could restart. It will not be easy (old plants + winter temps + uncertain market outlook = tough restart decision), but it is possible.
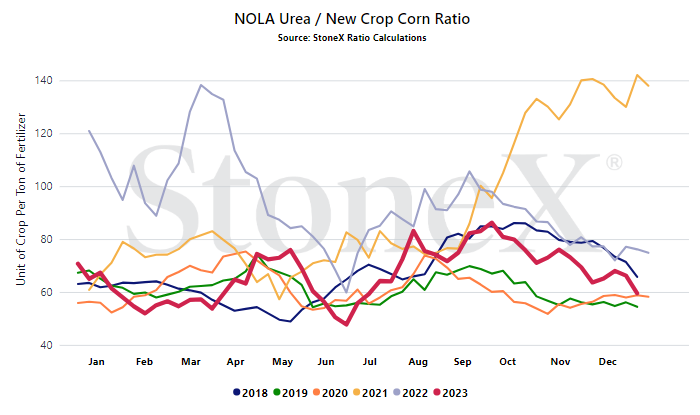
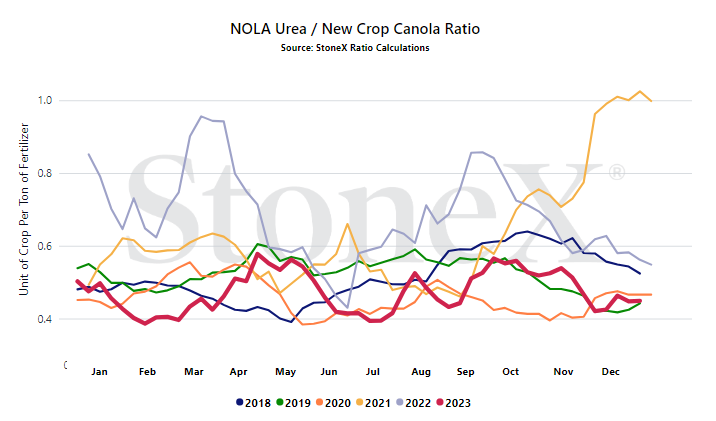
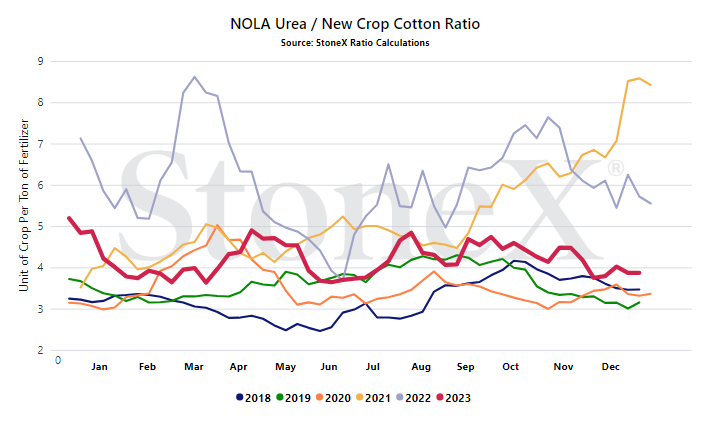
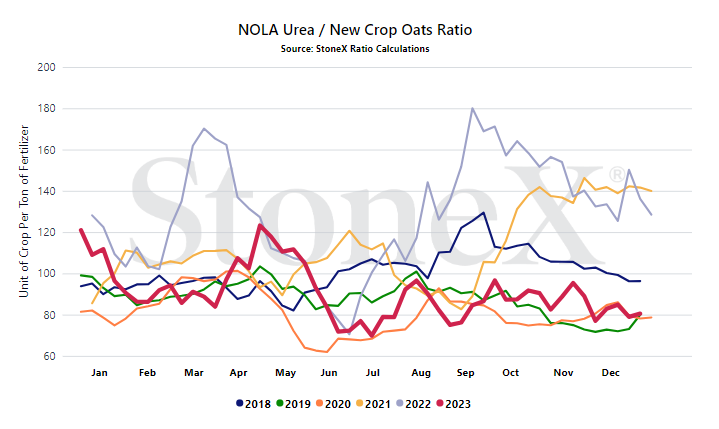
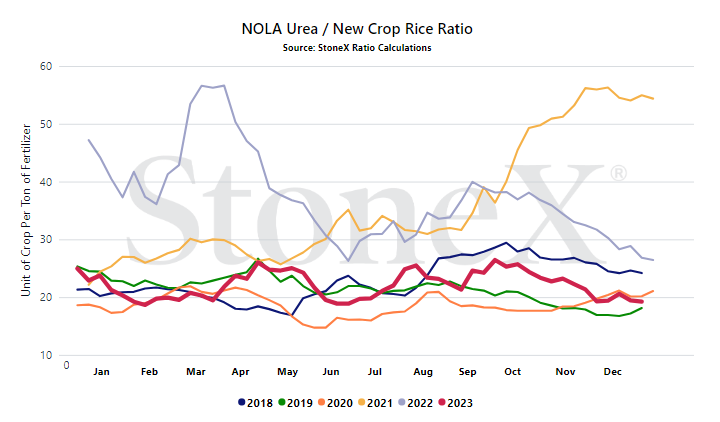
We believe that only looking at the flat price of either grains or fertilizer can be misleading:
- Only selling grain can hurt you if fertilizer prices rise substantially
- Only buying fertilizer can hurt you if grain prices fall
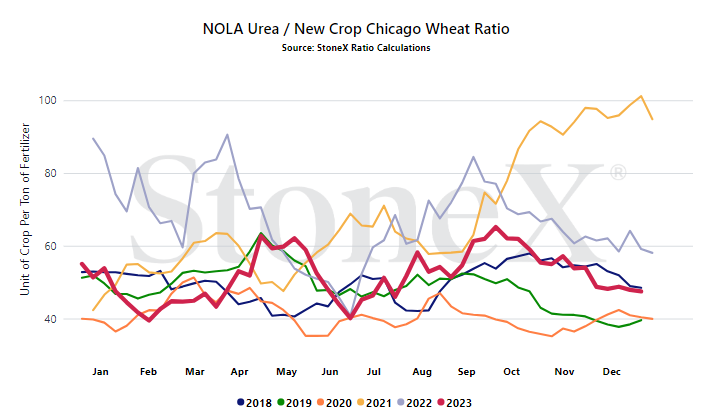
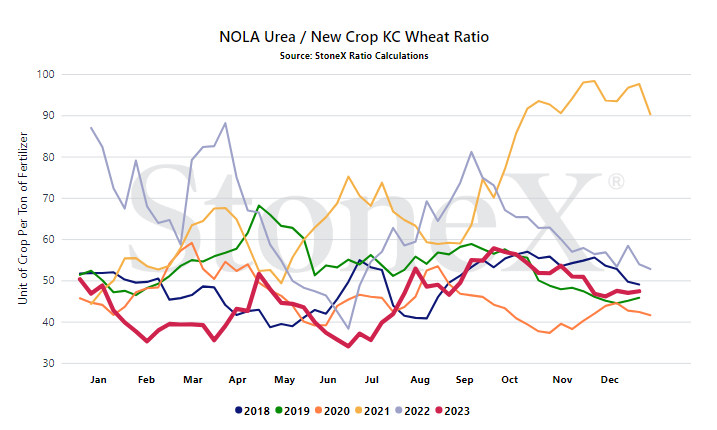
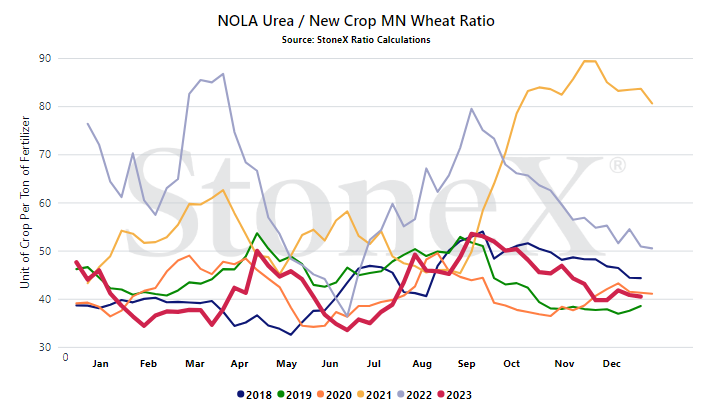
We look at the ratio "value" to get a better indication of where we are or how many bushels of X does it take to pay for 1 ton of fertilizer.
Would you rather:
- Spend 135 bushels to pay for 1 ton of urea
- Spend 55 bushels to pay for 1 ton of urea
When we compare the current ratio value against recent years, we start to see if we are high or low.
YOUR VALUES WILL LOOK DIFFERENT
This graph looks at the NOLA urea price vs the flat grain price. There are no logistics on either product. Your location will look different due to fertilizer logistical costs, grain basis, etc.
- Middle East tension - so far, the world has not responded as many believe it should in reaction/retaliation to vessel attacks. I continue to question how long that patience will last. Worst, I fear that these parties are merely testing the waters before going full scale. If you wake up one morning to a broad war breaking out, enjoy your morning coffee and breakfast...and then ponder a trip to your local retailer. Every morning I wake up and check the news for just such a story...I would suggest everyone consider doing the same.
- World reaction to India buying - so far, the reaction has been mute which makes sense. India picked a perfect time to step into the market with so many out on holiday (much fewer parties in the market means less reaction). Also, their shipment window is thru February 29th (writing Feb 29 is never going to feel "right") which is very wide. Today, I lean toward the world largely ignoring this and continuing to hold out for better pricing...but I've been wrong before.
- Chinese export plans - right now, we are proceeding with the anticipation that China is reducing exports by approximately 40% per month thru March 2025. If they change their mind and start exporting more heavily, it will be bearish. If they further restrict exports, it will be bullish.
- Today's values are still solid - if you didn't glance at the ratio charts above, I implore you to do so. For most crops, today's urea values are solid. I understand that they are historically high. However, so are most grain values. If you lock in today's urea pricing, sell next years grain against it and that ends up being your worst value for 2024, please call/e-mail/text and chew me out. I will take it with a smile on my face because that means you just had yourself one hell of a profitable year.
StoneX Ratio Calculation
The ratio calculation is derived from Bloomberg historical grains values as well as fertilizer values from StoneX, NPKFAS, and Argus.
The calculation is simply dividing the fertilizer price by each grain price.
All data was sourced from StoneX unless otherwise noted.
This material should be construed as market commentary, merely observing economic, political and/or market conditions, and not intended to refer to any particular trading strategy, promotional element or quality of service provided by the FCM Division of StoneX Financial Inc. (“SFI”), StoneX Financial (Canada) Inc. (“SFFC”) or StoneX Markets LLC (“SXM”). SFI, SFFC and SXM are not responsible for any redistribution of this material by third parties, or any trading decisions taken by persons not intended to view this material. Information contained herein was obtained from sources believed to be reliable, but is not guaranteed as to its accuracy. Contact designated personnel from SFI, SFFC or SXM for specific trading advice to meet your trading preferences. These materials represent the opinions and viewpoints of the author, and do not necessarily reflect the viewpoints and trading strategies employed by SFI, SFFC or SXM. The FCM Division of StoneX Financial Inc., a subsidiary of StoneX Group Inc., is a member of the National Futures Association (“NFA”) and registered with the U.S. Commodity Futures Trading Commission (“CFTC”) as a futures commission merchant and commodity trading advisor. StoneX Financial (Canada) Inc. is currently registered as a Futures Commission Merchant or equivalent in all provinces of Canada and is a member of the Investment Industry Regulatory Organization of Canada.




