

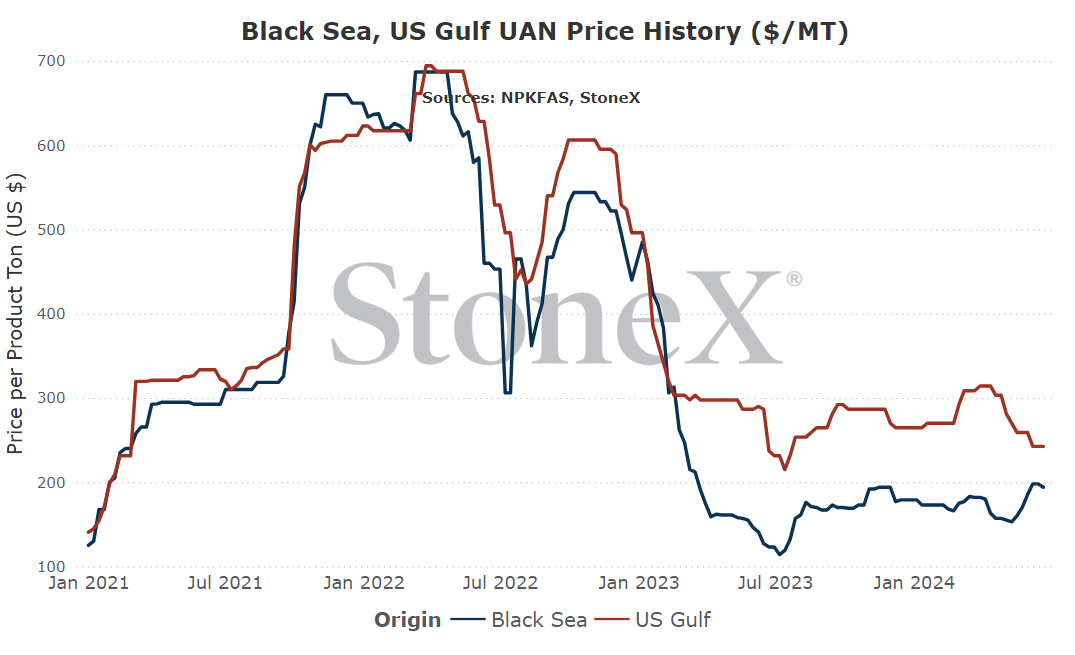
The intention of the below graphs are not to use to say "my price should be X based on this graph". These prices are derived from an FOB price point average. The intent is to show major global price movement trends. Your values will likely have significant basis difference (similar to your local grain price being different than the traded market price).
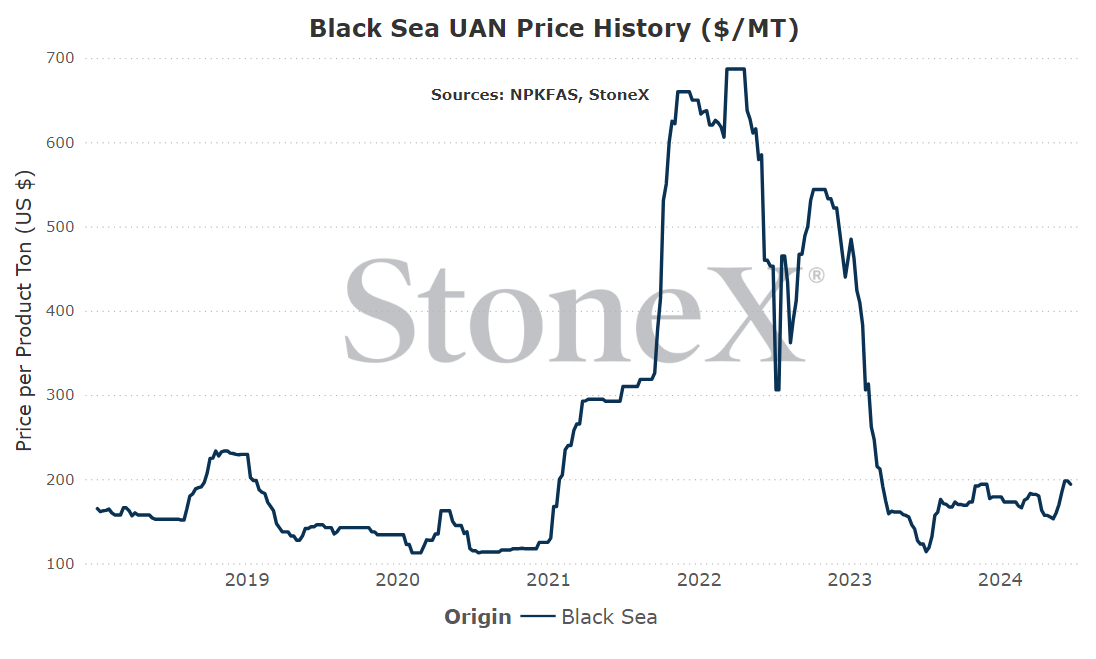
This graph is labeled as MT in USD currency.
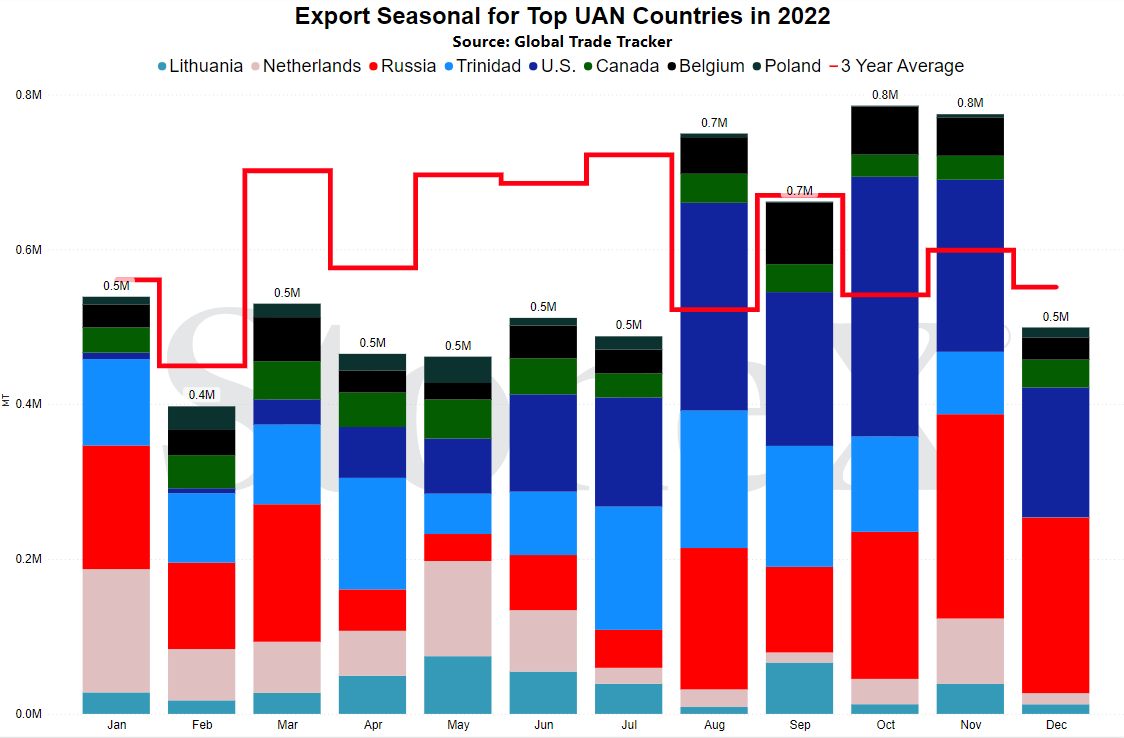
European production still suffering. Will it return?
European production outages due to high natural gas costs continue to dominate the global UAN marketplace. The hope has been that the remaining offline plants would return as global nitrogen values remained higher priced than expected and gas costs neared single digits.
Both happened...and yet European nitrogen production remains at around 75% of normal.
Will we see those remaining plants ever return?
Well, that is a firm maybe but not looking likely.
First, the political landscape of Europe is not exactly friendly to traditional farming approaches. As has been seen in the news over the last several months, European countries are trying to strong arm farmers into new, "progressive" approaches. That very much includes how they use fertilizer. Hard to believe that nitrogen manufacturing is any different. In that landscape, it isn't exactly exciting to plan a restart.
Second, gas inputs values remain higher than historic normal values and the outlook isn't improving. Russia continues to invade Ukraine and Europe continues to back off Russian business. The result is that European Dutch TTF values continue to trade in the $10 - $12/MMbtu price range which is double or more the historic norm. These lower values were helped immensely by two of the warmer winters on record which demolished demand and allowed values to fall. Do you risk the investment of spending the money to restart a facility in the expectation that a 3rd near record warm winter can be counted on?
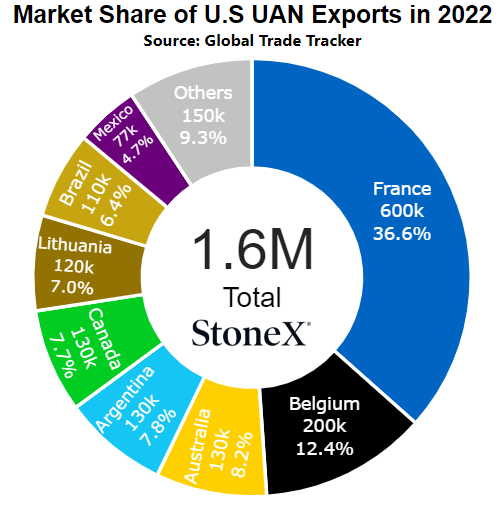
Third, new supply routes of UAN have been found from the U.S. It isn't as though European farmers have gone without. In the absence of domestic production, imports from the U.S. have helped to stem the shortfall of inventory. So if the outlook on production costs is cloudy as well as the price, and you can make up the difference by purchasing from the U.S., why risk a restart?
Fourth, these plants are older which means it is harder to restart and operate. Traditional nitrogen production is hard on facilities. That is why these plants go down all the time. The remaining plants might be looking at the age and wondering if the plant can be brought back online reliably.
Ultimately, our POV on European production returning to a full 100% normal rate is failing. I was pretty excited when Dutch values fell like they did but seeing it fall to the $7 - $8/MMbtu range and still not seeing a major change in production rate hurt.
I'll remain hopeful that they will return as that would help lower price ideas around the globe...but it is hard to keep hope going.
Trinidad gas issues hurts UAN production
Adding to the list of production shortfalls is Trinidad.
The future looks significantly better for Trinidad. Approvals were given to start accessing more gas rich territories in its waters. However, accessing and bringing reliable supplies will take time. In the meantime, supplies remain tight and that has been affecting nitrogen production rates.
Recently, gas curtailments hindered nitrogen production which included UAN. U.S. manufacturers have already been enjoying demand from Europe as a way of keeping domestic inventories tight. Having Trinidad go offline only raises that demand and keeps domestic supplies tighter.
Fortunately, these gas issues are seen as a short term situation. If all goes to plan, production and shipments of UAN should resume normally but this has pointed out how precarious UAN supplies from Trinidad can be...and just how quickly the global S&D can tighten.
Later than normal N.A. sidedress run impacted price ideas
In late March/early April, the UAN outlook was bleak. Inventories were extremely tight. Retailers were heard looking for physical supplies and were being told that it would be late April, if not May, before anything popped up. It just didn't seem practical/feasible to think the market would ease.
Then the rains started.
Planting quickly started to get pushed back as timely rains kept farmers from the fields. The focus was on planting progress and the impact on acreage/price/etc. However, another story was unfolding quietly. UAN was becoming more available.
The delay in planting mean that sidedress demand was already getting delayed. That meant more time for more tons to be produced. That meant more time for imports to arrive. That meant more time to move product from point A to point B.
It meant more time to prepare.
And that is how quickly the market can change. Had planting been "normal", it is very likely that UAN values would have held much higher for longer as the market continued to play catch up. Seeing prices fall mostly had to do with Mother Nature stepping in and having her say.
Grain prices take a hit...but how does UAN hold up?
Friday's USDA acreage report did little to help grain prices/farmer outlooks, as several grain prices fell on the follow. This report came on the heel of many summer fill UAN programs being released to the market place. Several of the programs were actually more aggressive than the values I am going to use. That said, the largest manufacturers program was a bit more stout and covers a wider territory. Before taking the below for gospel, I would advise talking to your retailer to find out where they sit.
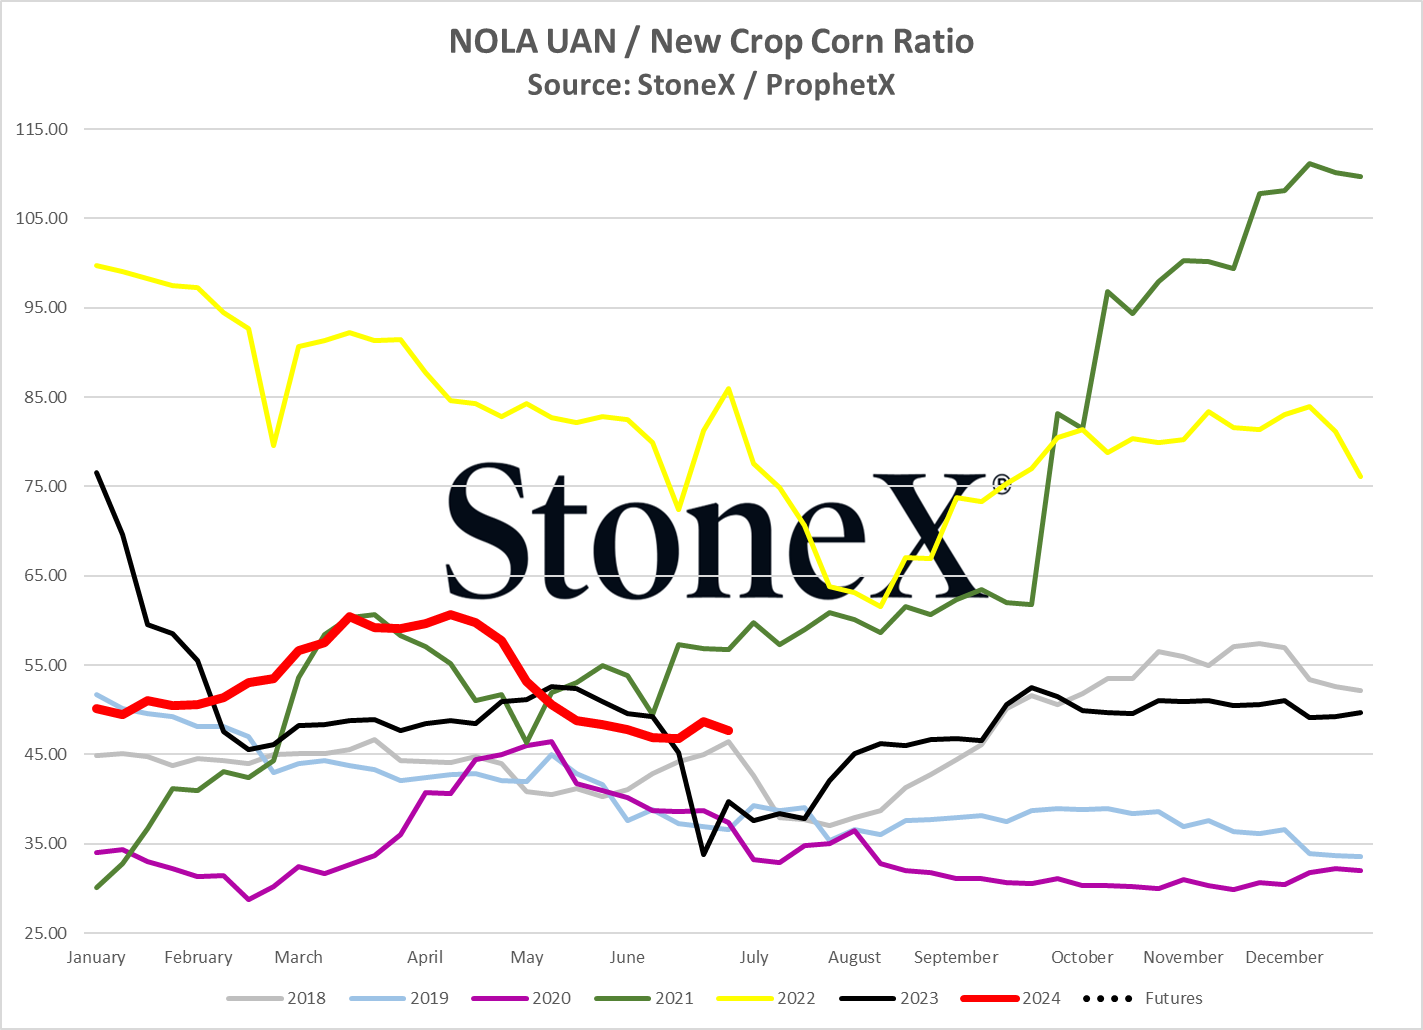
So, that said, the NOLA UAN netback price was largely agreed upon around $200 - $210 which depended on who you talked to and where they sat. Let's take the middle and see how that shapes up:
- NOLA UAN @ $205
- December 2025 corn @ $4.58
- Current ratio - 45
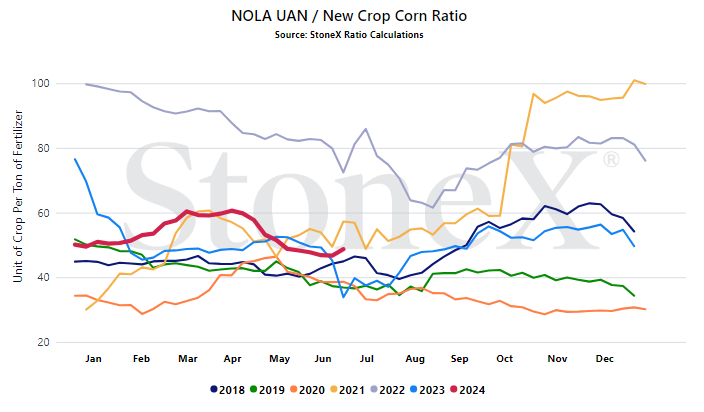
Without some history, it's impossible to say it is high or low. So take a glance at the chart below.
There have been worse summer ratio values. There have been better. Truthfully, I had held out hope that the price would fall into the 35 - 40 range. It would have meant UAN came out $15 - $25 lower than it did...but it also meant that corn values didn't dump Friday after the report. Grain prices falling is just a tough thing to get over.
Still, it is hard to see values down substantially from where they are today. Many of the folks I watch/listen to on the grain markets do not have optimistic things to say so it is hard to see that helping. We also know that the U.S. has a fantastic supply relief valve in Europe which means if manufacturers start to feel flush with unsold inventories, they will try to bump up export sales.
Again, please have this conversation with your supplier/retailer. Your numbers at home mean much more than this graph. This is the 50K foot level picture but your local number mean so much more.
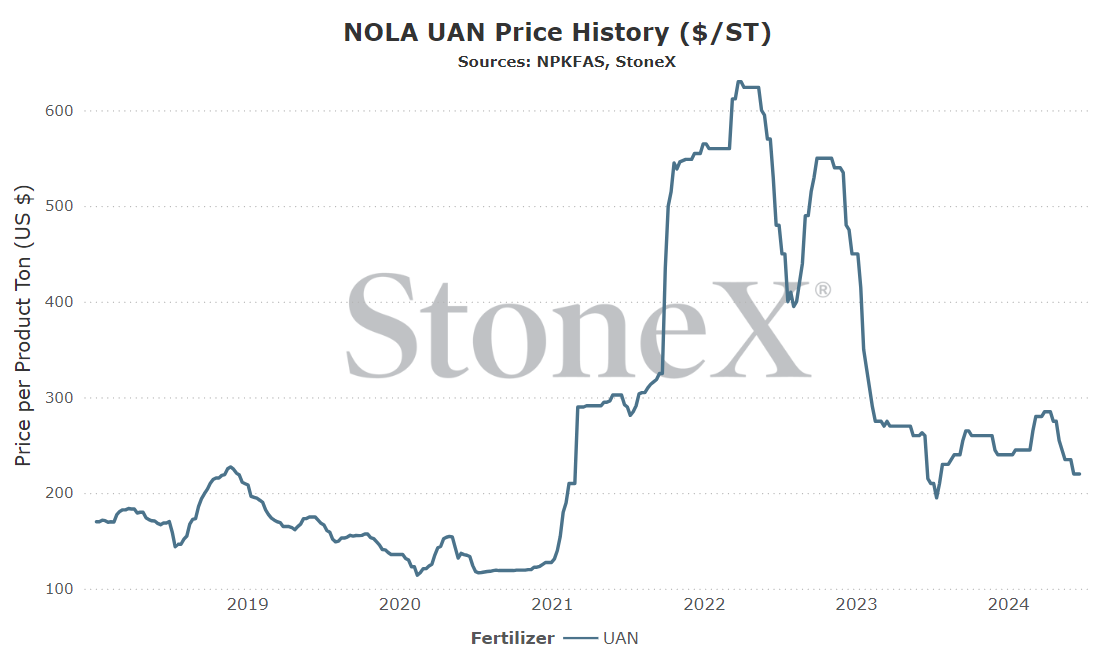
NOLA/New Orleans, Louisiana
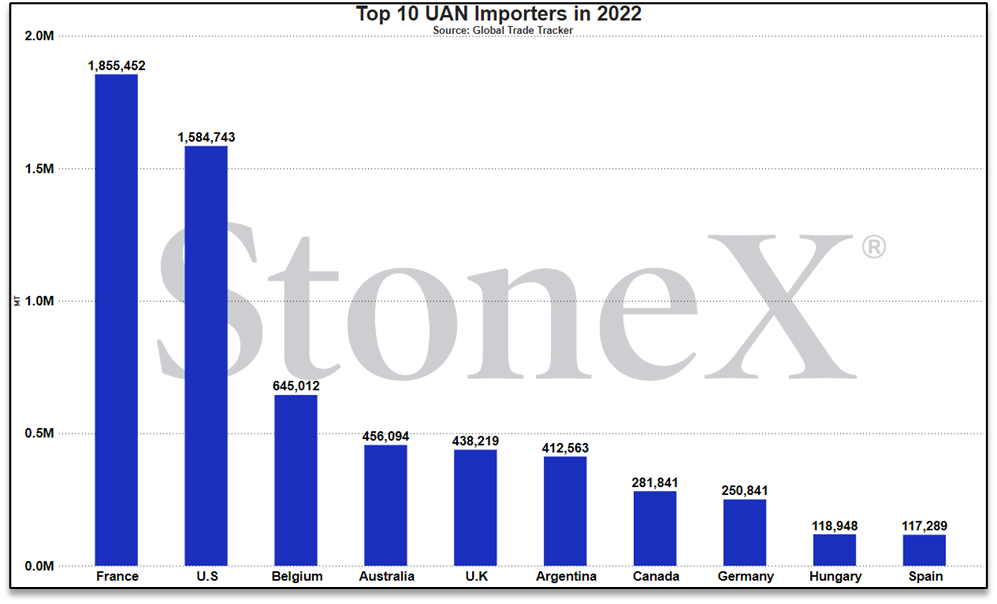
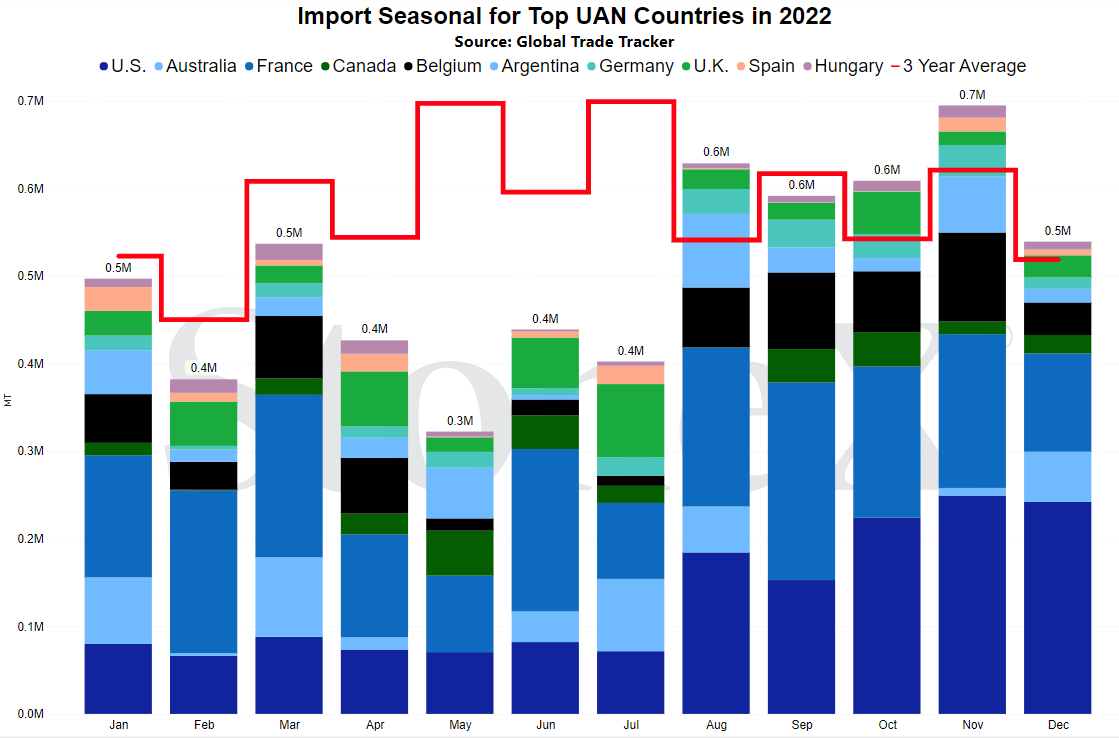
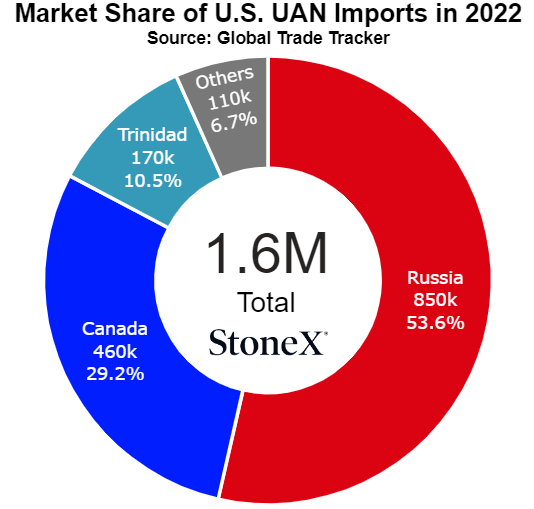
Number 2 global importer in 2022
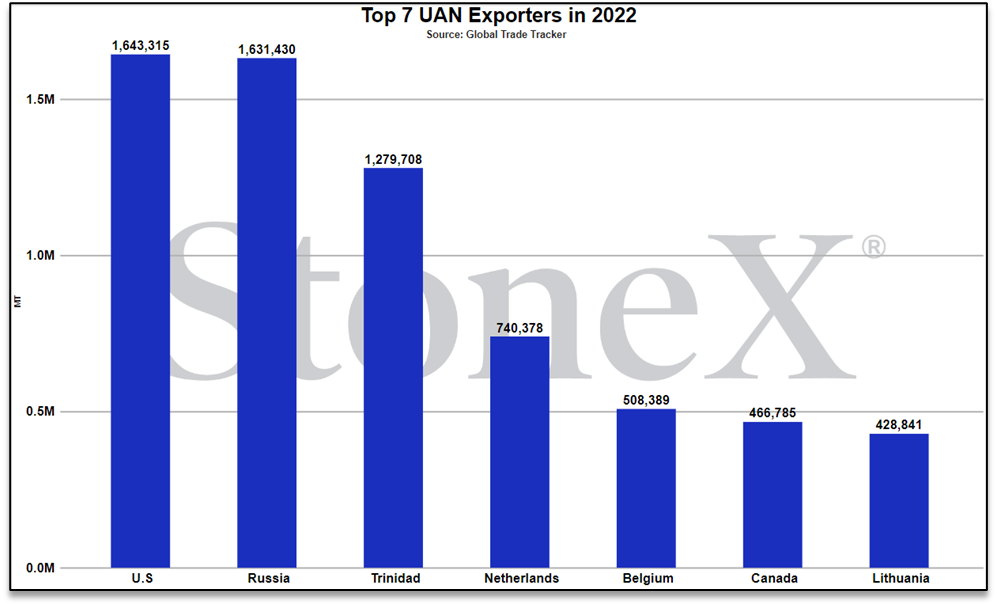
Number 1 global exporter in 2022
Price Comparisons
Vs 30 days ago - -6% or approximately $15 lower
Vs 90 days ago - -21% or approximately $60 lower
Vs 6 months ago - -8% or approximately $20 lower
Vs 1 year ago - 2% or approximately $5 higher
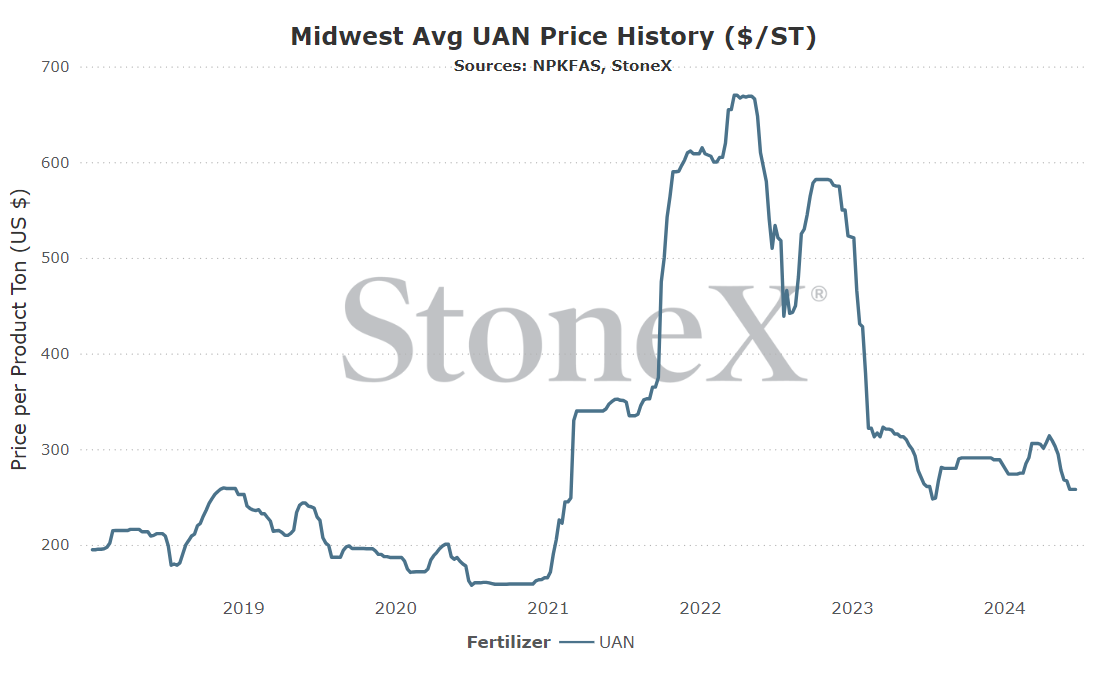
U.S. Midwest Average
Vs 30 days ago - -3% or approximately $9 lower
Vs 90 days ago - -16% or approximately $48 lower
Vs 6 months ago - -9% or approximately $25 lower
Vs 1 year ago - -2% or approximately $5 lower
Black Sea (Russia)
Number 2 global exporter in 2022
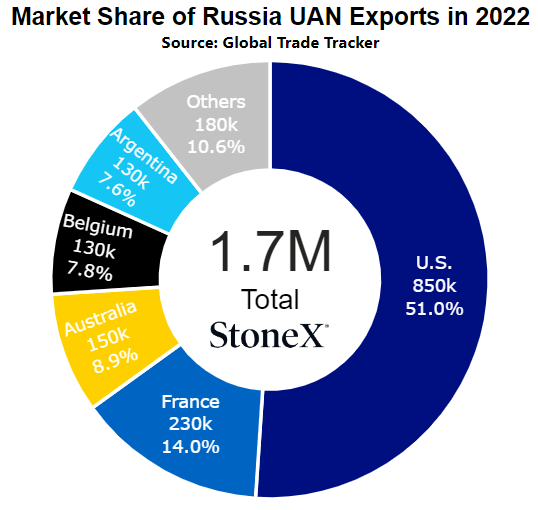
Price comparisons
Vs 30 days ago - 14% or approximately $24 higher
Vs 90 days ago - 6% or approximately $12 higher
Vs 6 months ago - 8% or approximately $15 higher
Vs 1 year ago - 58% or approximately $71 higher
- U.S. implements Russian import blocks – this would be huge for N.A. price ideas if it happened. Right now, Russian imports to the U.S. is helping to keep a lid on higher price ideas. For almost every ton that the U.S. exports, the same ton is imported. However, in 2021, an attempt was made to get the Department of Commerce to levy import duties against Russian UAN imports. It failed, but I'm guessing the idea has not died. If they were to try again or find another route that ultimately blocked imports from arriving, it is a whole new ballgame with higher pricing.
- Continued or larger production outages – Europe remains lower than historically normal. Trinidad is having issues. If that is all that happens, the UAN market should remain in decent shape. However, we have seen nitrogen production issues in Brazil, Egypt, etc. These have been more focused on urea but it highlights how quickly nitrogen production can be lost.
- European production restarts – hope is not a strategy but I sure hope for buyers that the rest of European offline production restarts. If that were to happen, and that is a big if at this point, it sets several things into motion. For starters, Europe no longer has to look to the world/U.S. to backfill lost supply. Second, U.S. manufacturers would lose their export relief valve which forces them to stay home and compete. Third, that competition between domestically produced tons and Russian imports (which likely wouldn't go away due to lack of destination options) would help lower price ideas.
- Grain prices continue to fall – again, I do not want this. I would rather see UAN prices down while grain values go up. Rarely in life do I get what I want. Ultimately, it already feels like UAN is toeing the buy line with grain prices falling like they have. If they were to dip lower, an already skeptical buyers market would fall further away pushing more unsold inventories back to the distributors/manufacturers. If that happens long enough, something will need to give.
We believe that only looking at the flat price of either grains or fertilizer can be misleading:
-
Only selling grain can hurt you if fertilizer prices rise substantially
-
Only buying fertilizer can hurt you if grain prices fall
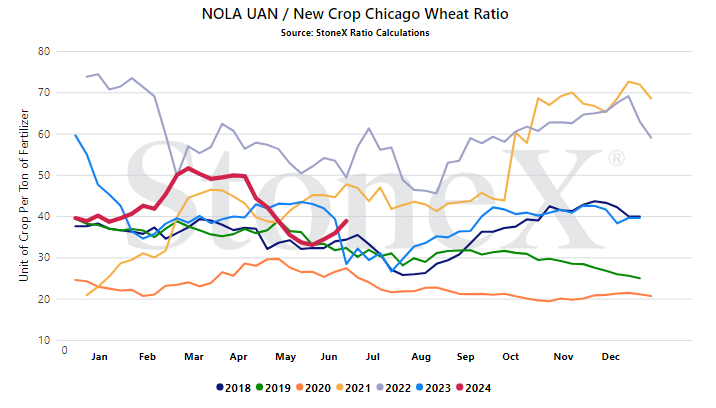
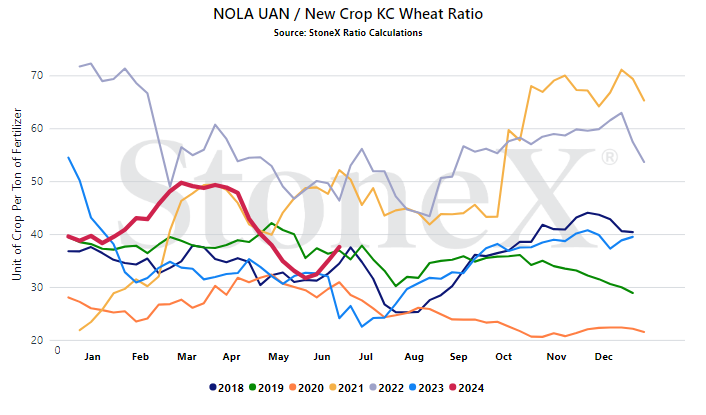
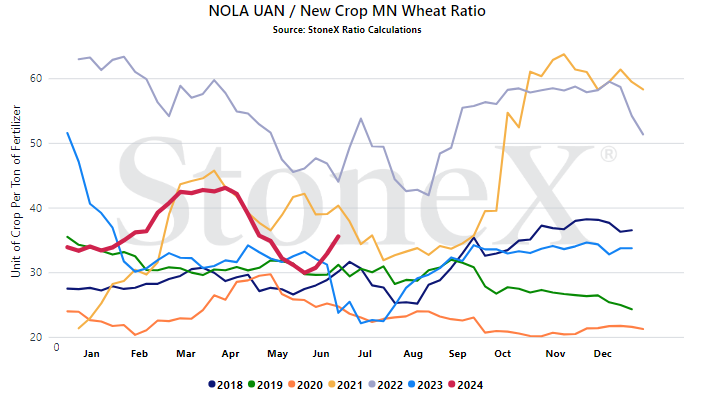
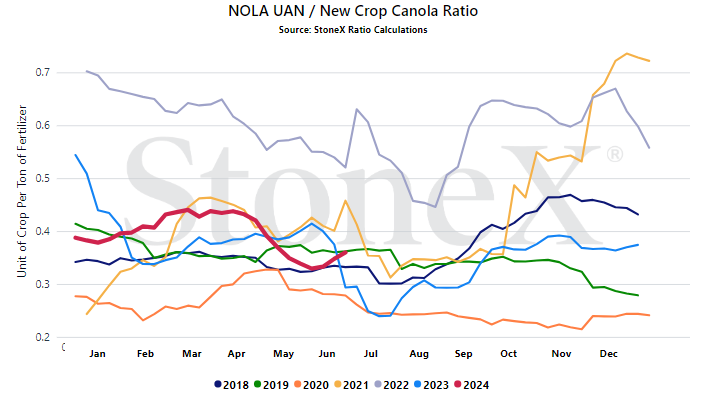
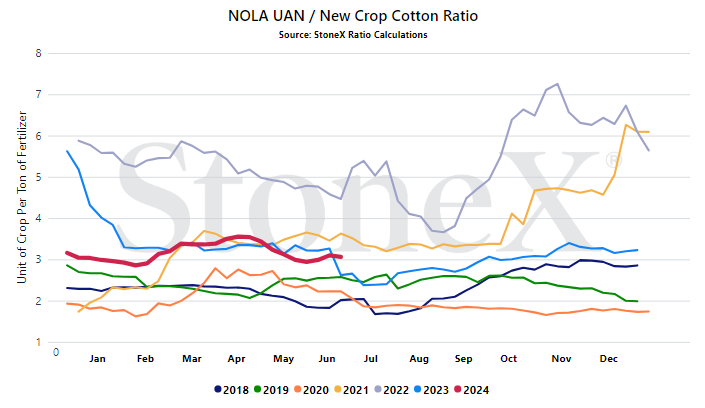
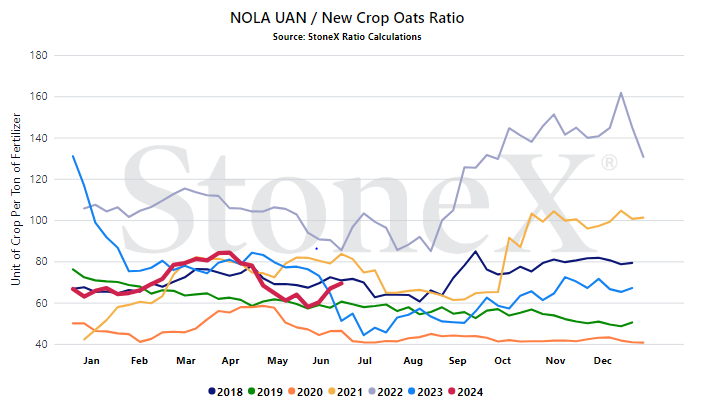
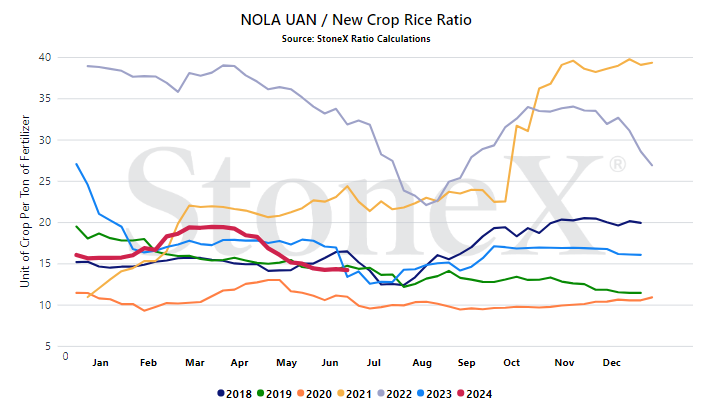
We look at the ratio "value" to get a better indication of where we are or how many bushels of X does it take to pay for 1 ton of fertilizer.
Would you rather:
-
Spend 100 bushels to pay for 1 ton of UAN
-
Spend 60 bushels to pay for 1 ton of UAN
When we compare the current ratio value against recent years, we start to see if we are high or low.
YOUR VALUES MAY LOOK DIFFERENT
This graph looks at the NOLA UAN price vs the flat grain price. There are no logistics on either product. Your location will look different due to fertilizer logistical costs, grain basis, etc.
- European production - European production coming online once again could completely submarine global UAN price ideas. If that production restarts, it pushes a lot of tons back to its origin, creating a lot more supply/competition/etc. However, the longer it remains offline (or gets worse), the tighter the globe gets on supplies. Europe represents almost a third of global capacity so their production rate matters.
- How buyers approach spring '25 needs with farm economics getting worse - it has been a bit since manufacturers have had to approach a marketplace where the end user (farmer) is in rough shape. Input costs are still high. Equipment is expensive. Don't get me started on land costs. Grain values stay low. All in all, farmers are in rough shape this year which means there will be very little excitement to buy early. That puts the onus on retailers who are in a similar situation in not wanting to get too far ahead. That pushes a lot of the pressure back to the manufacturer. The question becomes, how well can they handle this market change? Will they hold firm...or break under the pressure?
StoneX Ratio Calculation
The ratio calculation is derived from Bloomberg historical grains values as well as fertilizer values from StoneX, NPKFAS, and Argus.
The calculation is simply dividing the fertilizer price by each grain price.
All data was sourced from StoneX unless otherwise noted.




