

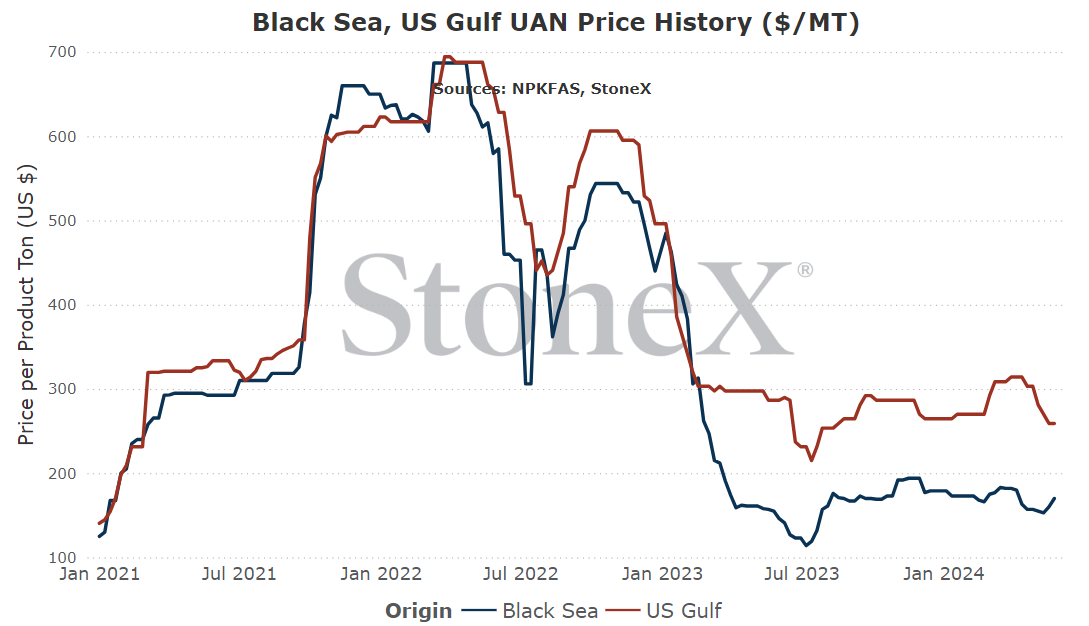
The intention of the below graphs are not to use to say "my price should be X based on this graph". These prices are derived from an FOB price point average. The intent is to show major global price movement trends. Your values will likely have significant basis difference (similar to your local grain price being different than the traded market price).
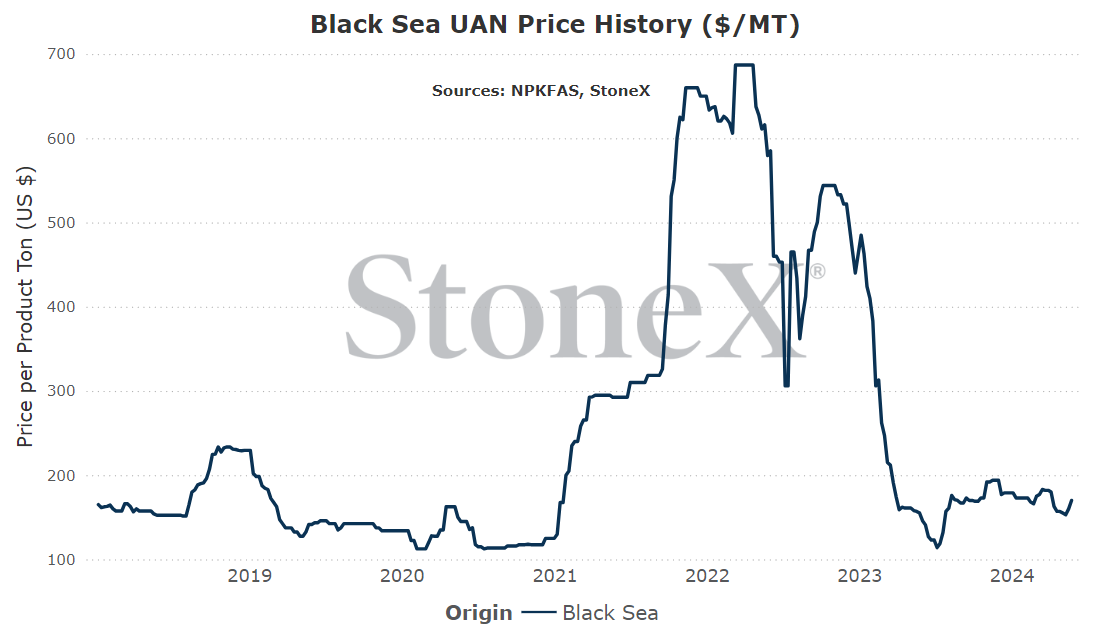
This graph is labeled as MT in USD currency.
Rising European Dutch TTF (natural gas) values dash hopes of nitrogen plant restarts
As of today, European nitrogen production remains cut by 25 - 35% of normal due to Dutch TTF/European natural gas values remaining high priced.
For backstory, Europe has historically been reliant on Russia for their natural gas supplies. However, in recent years, that supply was shut off. At first, it was the fight regarding Nordstream 2 pipeline that ultimately ended with a brazen attack in deeper ocean waters where repairs are very difficult. Any hope that negotiations would succeed were dashed. Hard to pump gas thru a pipe that has been destroyed...
Then, Europe learned just how reliant they were on Russia. Values quickly skyrocketed. Where historic norms were in the single digits, August 2022 saw futures rise to just over $103MMbtu. Needless to say, the majority of European based nitrogen turned off. It was simply too expensive to produce. Every ton made would be at a loss.
Fortunately, as open markets tend to do, a new normal was found. Other global natural gas supplies started to find their way to Europe and values started to fall. Eventually, that production rates climbed from the low of 25 - 35% of normal to the new plateau of 75%. Still short of normal but a huge gain.
Then, Dutch TTF values continued to fall and there was a rising hope that the remaining 25% would turn on again. That has not been the case.
It has been some time since we have heard of an offline production plant restarting. We can no longer use "plants are waiting for warmer temperatures" or "companies are waiting for demand to return". Both of those arguments have been put to the past with no change.
Now, we are seeing Dutch TTF values start to rise again. Certainly not to the previous high's, but they have breached double digits again and continue to trade around $10 - $11MMbtu, and it appears with little hope of going lower again.
To say that these plants will never come back is short sighted. A lot of money went into the building of the facilities as well as the maintenance. They hold a lot of jobs and support local ag industries so any decision to scrap the facilities would be met with a lot of local angst.
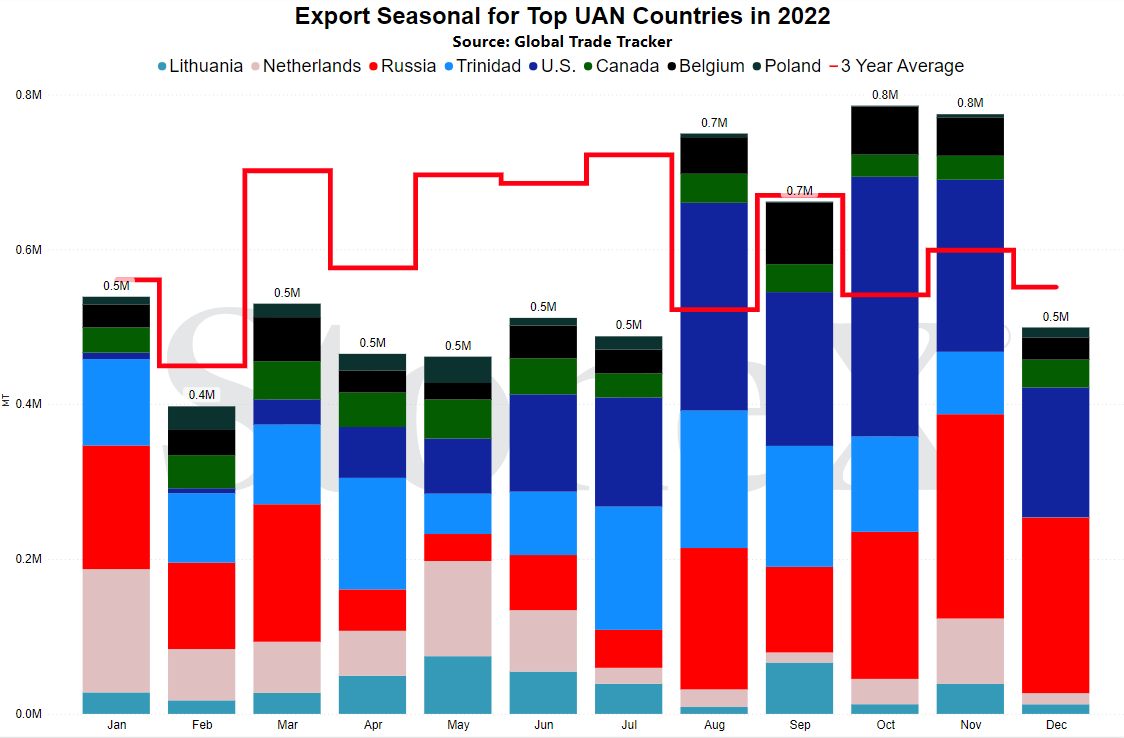
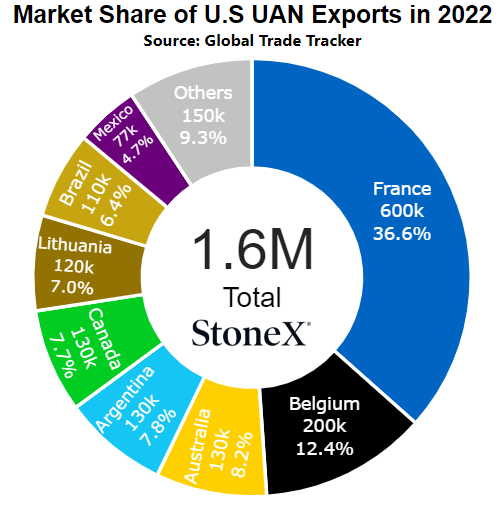
Now, what does this mean for global/domestic UAN markets? Europe represents nearly a third of all the UAN produced in the world. So losing a quarter of that is a big hit. In the absence of European production, we have seen N.A. manufacturers exporting UAN to Europe at a much higher rate that normal as it has provided a much better netback price than N.A. markets have. Assuming that Russia remains cut from sending UAN to Europe, this will continue until that offline production restarts. That means N.A. manufacturers have an "outlet valve" for any excess inventories they might produce which also gives a reason to keep price elevated. This seems to be a story that doesn't want to die.
N.A. Midwest values see pressure as planting delays on wet conditions
The biggest story this spring has been the delayed planting. Reports from all over have been that farmers are struggling to get planters in the fields with moisture coming thru every few days. A delay in planting means a delay in sidedress N application. That delay has caused Midwest values to start to creep lower.
Honestly, the story turnaround has been fascinating.
If we rewind back to late March, UAN inventories were almost non-existent. I talked to a lot of folks who told me they couldn't purchase March ship, were struggling to find April ship and were mostly being told it wouldn't be until May that adequate product was available. As a result, UAN values held firm as it watched urea prices tumble.
Then the rains started and the delays kicked in.
Suddenly, things started to loosen up for UAN. There is a rational reason behind it. A later planting meant a later sidedress demand run which gave the market the one thing it needed most: time.
Time to produce more product.
Time to bring in more imports.
Time to move that product into place.
Time, in this instance, worked for the buyer.
In the last month, values have dropped decently. We will see the crop planted and as a result, sidedress demand will pop up and likely support the market short term. But for now, we need to be somewhat thankful for the delay as it helped us to avoid a really tough period.
Should N.A. be worried about losing Russian imports?
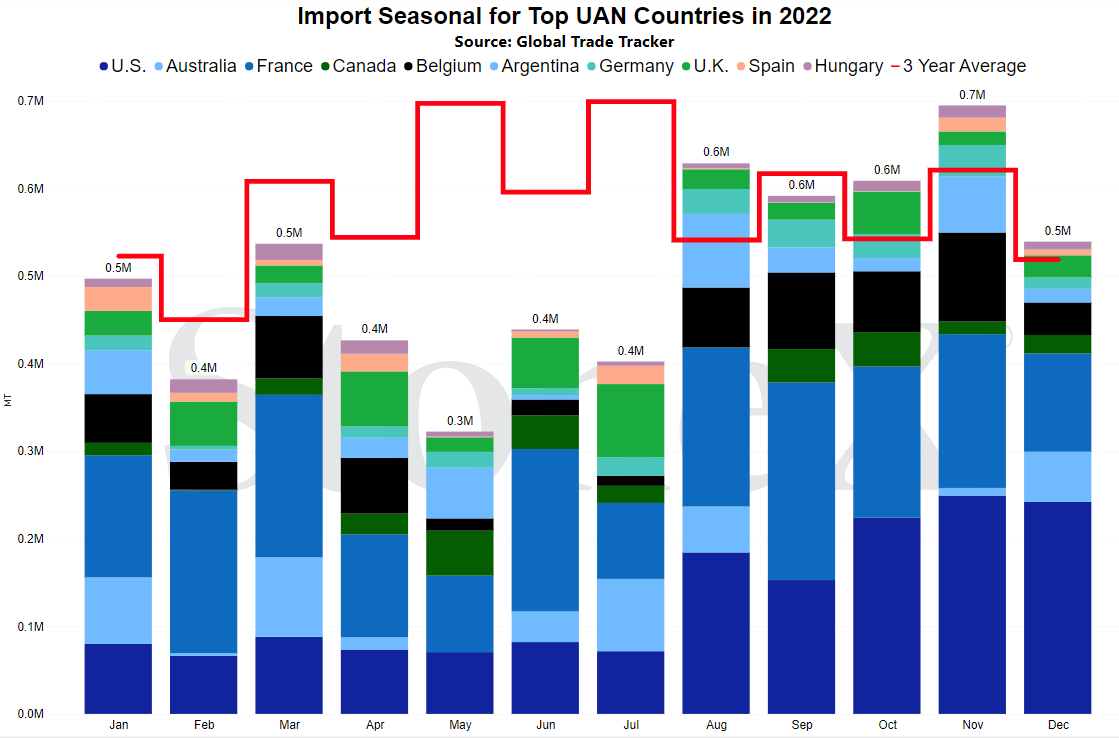
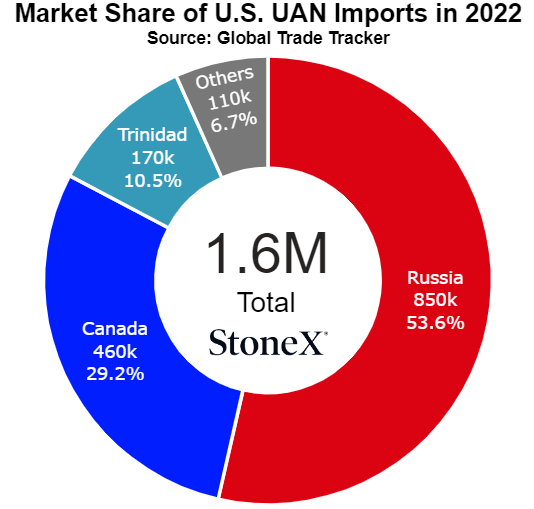
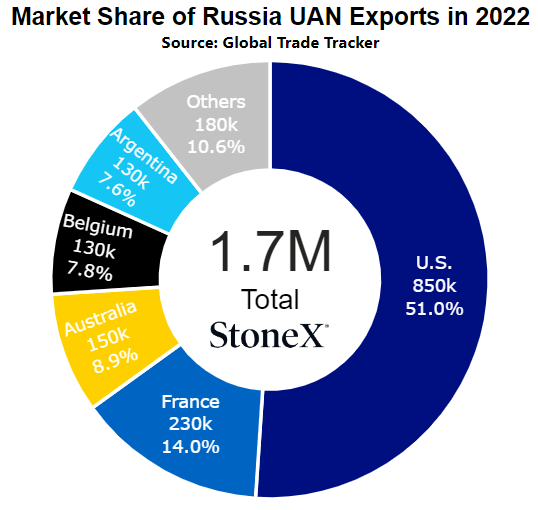
One of the things that has really helped keep the N.A. UAN market in control has been Russian import. While the Canadian government has blocked Russian imports, the U.S. never took that final step. As a result, Russia has shipped a lot of product to the U.S. marketplace which has been a huge help given that U.S. manufacturers have been shipping nearly the same amount of tons to Europe.
You heard me right. For almost every ton imported to the U.S., nearly the same number of tons are being exported.
Fertilizer Year 2024 Cumulative UAN Imports - 1.7M
Fertilizer Year 2024 Cumulative UAN Exports - 1.4M
So it makes sense that we should be very cautious and watchful for any attempt to block those imports.
...well, we may have heard the first salvo be fired. During earnings calls, one company made a rather interesting statement in regards to buying Russian UAN is akin to supporting their war on Ukraine. The reason this caught my attention so badly is that I think this is another attempt to block those tonnages.
Following the approval of phosphate counter vailing duty rates against Morocco and Russia, an attempt was made to do the same on Russian UAN. That attempt ultimately failed...but I do not think they ever let it go.
Making a comment such as that, from my perspective, is their way of taking another attempt to stop the flow. No doubt trying another counter vailing duty case is not likely. They take a lot of time, effort, PR, etc. for the company calling for it. Adding to that the fact that the case was already voted against. So rather than run that same road, it would be better/easier to take the political route. Try to connect Russian UAN to Russia's invasion and get D.C. to get involved. That way, it is a political judgement and not a manufacturing company trying to block competition.
So far, we have not heard anything further but this will be high on our radar's.
NOLA/New Orleans, Louisiana
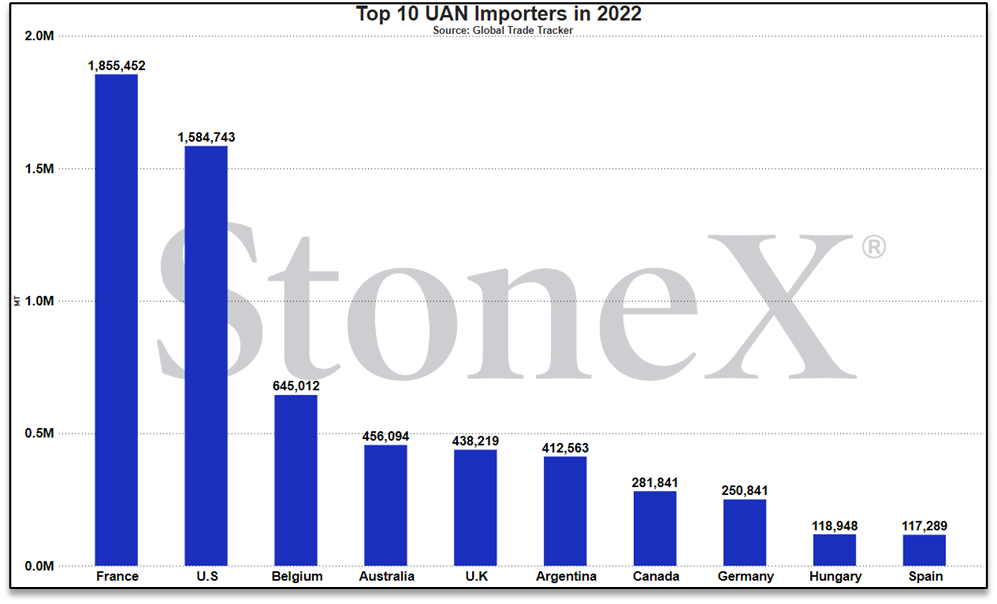
Number 2 global importer in 2022
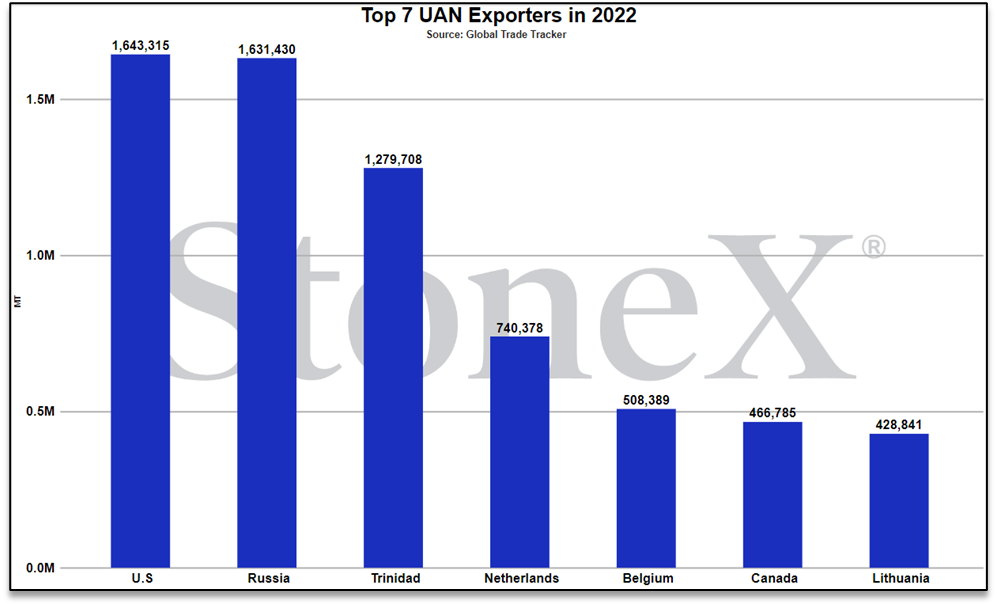
Number 1 global exporter in 2022
Price Comparisons
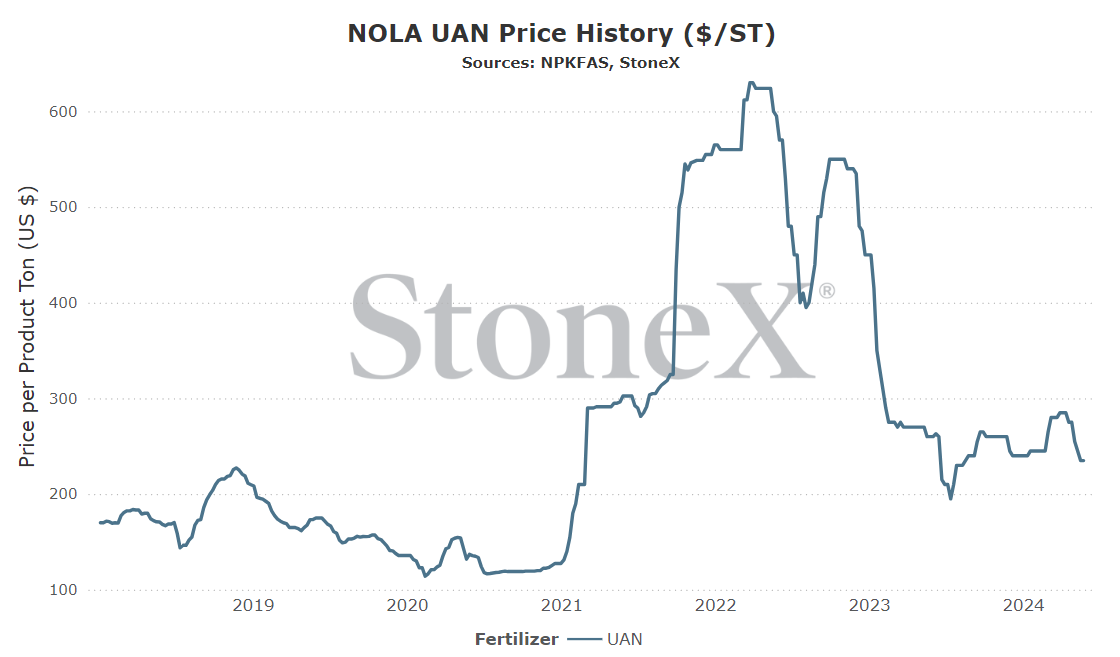
Vs 30 days ago - -15% or approximately $40 lower
Vs 90 days ago - -4% or approximately $10 lower
Vs 6 months ago - -10% or approximately $25 lower
Vs 1 year ago - -10% or approximately $25 lower
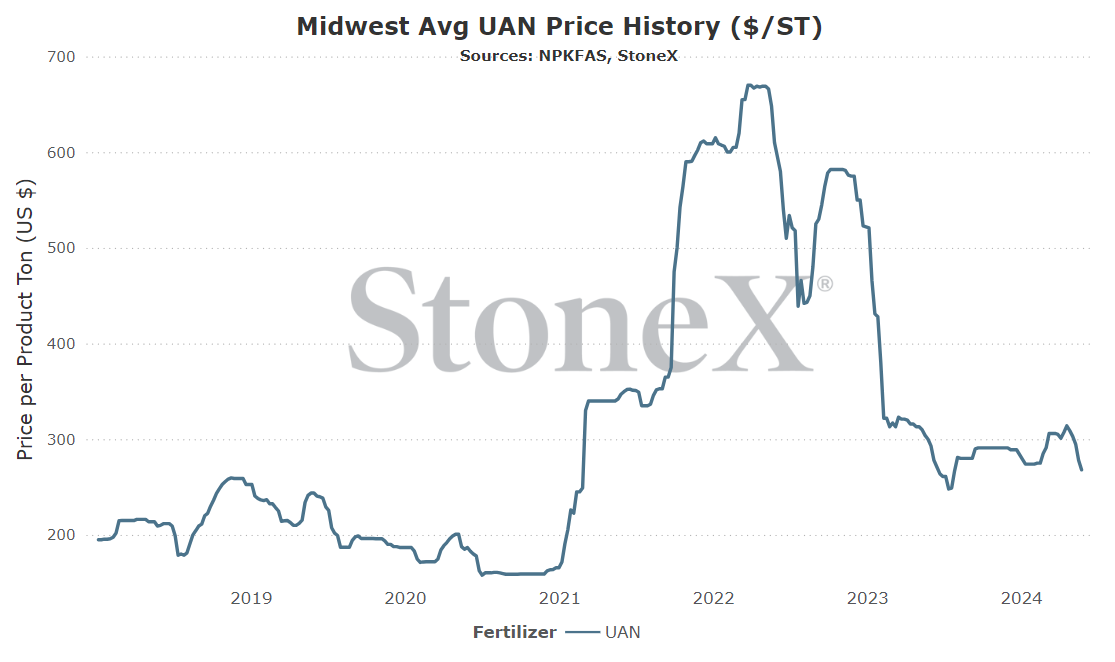
U.S. Midwest Average
Vs 30 days ago - -13% or approximately $42 lower
Vs 90 days ago - -6% or approximately $17 lower
Vs 6 months ago - -8% or approximately $23 lower
Vs 1 year ago - -11% or approximately $32 lower
Black Sea (Russia)
Number 2 global exporter in 2022
Price comparisons
Vs 30 days ago - +8% or approximately $13 higher
Vs 90 days ago - +3% or approximately $5 higher
Vs 6 months ago - -12% or approximately $24 lower
Vs 1 year ago - +10% or approximately $15 higher
- N.A. sidedress demand comes hot and heavy – planting being delayed has delayed N sidedress demand and allowed values to come under pressure. However, that also means that a lot of acres will be planted at the same time and thus, UAN demand will come in a much more condensed period. Perfectly reasonable to think that values could jump for a short time.
- Further European nitrogen plant stoppages – I really hope this does not happen but with Dutch TTF values creeping higher, we need to watch for it. If more European production goes offline, it is going to hurt the global UAN marketplace.
- U.S. starts to consider blocking Russia imports – again, this is another low likelihood situation but major enough to watch. I'm hoping this story does not gain any traction but if we start hearing more about it in reports/articles/D.C. discussions, we need to start getting nervous about prices moving higher.
- UAN relatively high priced vs urea – as we near sidedress season, we do need to consider the spread between urea and UAN. Now, I know that inland values are going to be much different than NOLA values which is what I watch. I also realize that it is far too late for many retailers/farmers to switch from one to the other. Might be late, but not impossible. UAN is on the high side of premiums vs urea. That markets need to make sure it doesn't get any more out of sync or risk some demand switching.
- Long, slow summer ahead – actually, for UAN, long summer/fall/winter is ahead! Basically, after this last push, there is a lot of calendar between today and next spring. Farmers are not in a great mood given that profitability is suffering vs the last few years. Retailers are going to be gun shy, knowing farmers will be skeptical. Lot more of the pressure will be on manufacturers to find a price that works to bring spring demand forward.
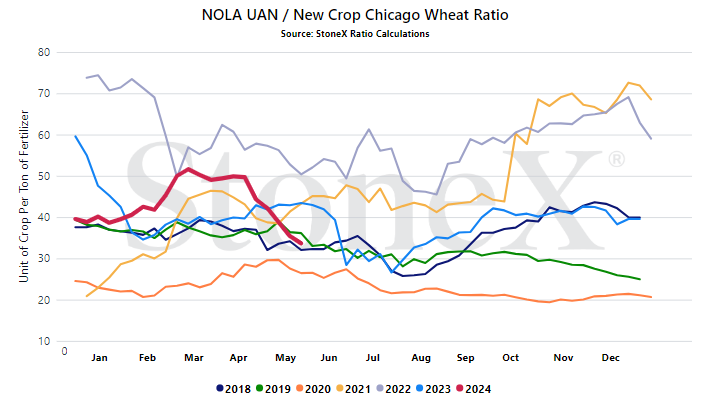
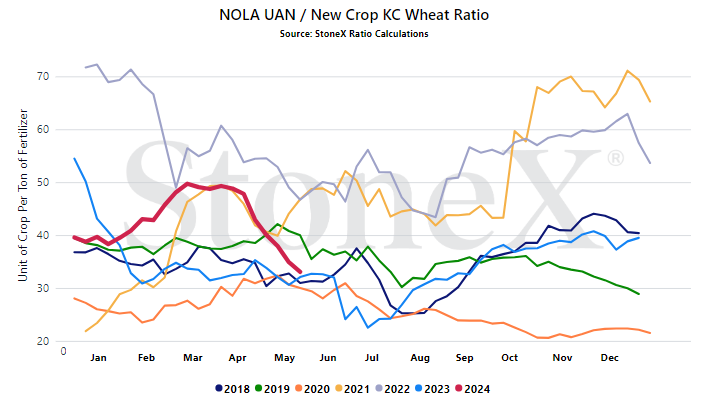
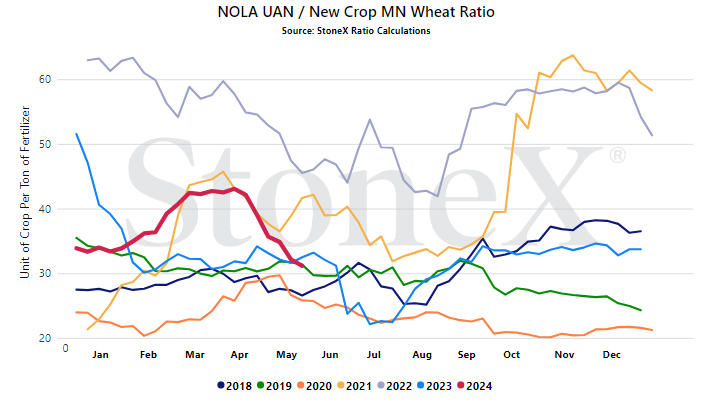
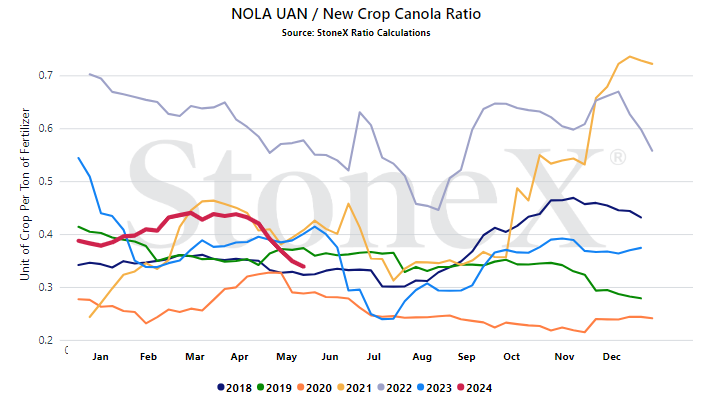
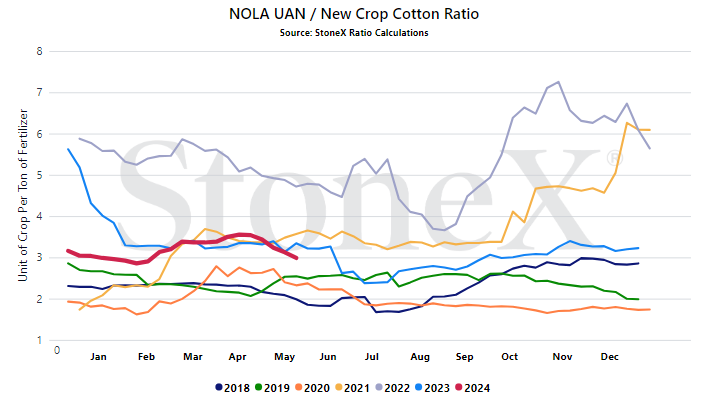
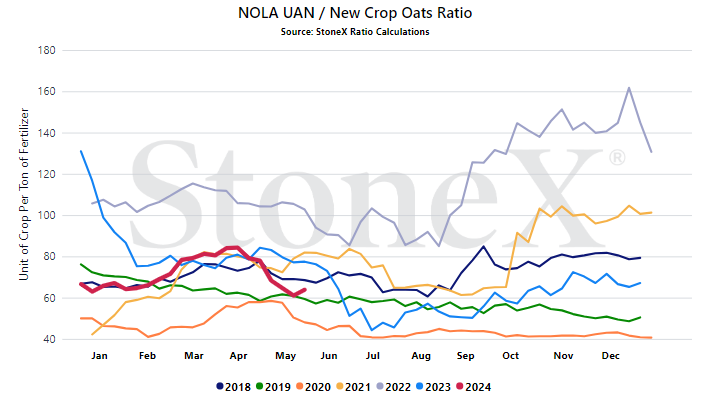
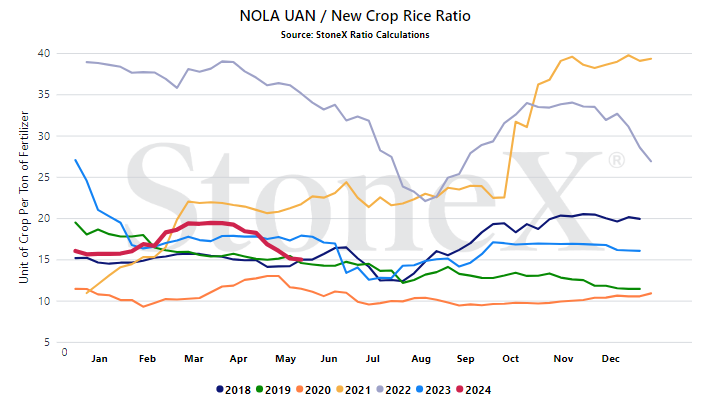
- UAN relatively high priced vs grains – similar to above, there just isn't much exciting about current UAN values. When compared against several of the grains (below), there is nothing screaming "buy me". It doesn't mean manufacturers are desperate to sell today...but that day could come sooner than we think.
We believe that only looking at the flat price of either grains or fertilizer can be misleading:
-
Only selling grain can hurt you if fertilizer prices rise substantially
-
Only buying fertilizer can hurt you if grain prices fall
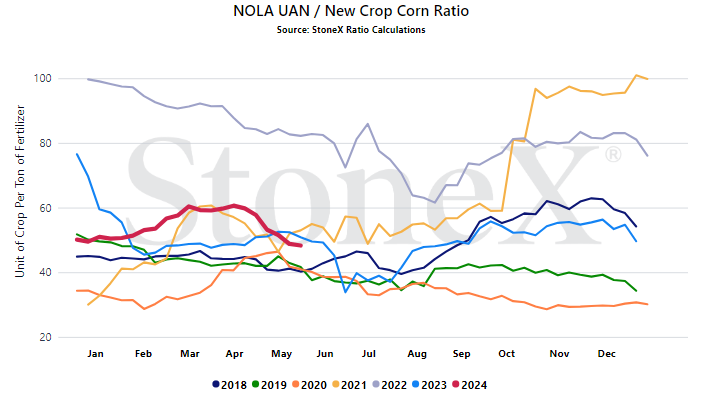
We look at the ratio "value" to get a better indication of where we are or how many bushels of X does it take to pay for 1 ton of fertilizer.
Would you rather:
-
Spend 100 bushels to pay for 1 ton of UAN
-
Spend 60 bushels to pay for 1 ton of UAN
When we compare the current ratio value against recent years, we start to see if we are high or low.
YOUR VALUES MAY LOOK DIFFERENT
This graph looks at the NOLA UAN price vs the flat grain price. There are no logistics on either product. Your location will look different due to fertilizer logistical costs, grain basis, etc.
- Planting progress / remaining nitrogen demand - the delay in planting has been frustrating to a lot of farmers who just want to get the seed in the ground and move on. However, it has also been frustrating for the UAN market which has had to wait even longer for demand to show up again. The longer the sidedress season delays, the more time given for the market to produce more/import more/move more product into place. Those are all issues that have weighed on price ideas as the competition has grown. If we get into a situation where corn acres start to get slashed because of the lateness, that is a whole other issue that will weigh on the market.
- Attempts by the U.S. to block Russian UAN imports - following the conclusion of the U.S. duty case against Morocco/Russia phosphate imports, an attempt was made to put similar duties on Russian UAN imports. That attempt ultimately failed...but I do not think they have given up. In recent earnings calls, it was mentioned that purchasing Russian fertilizers was an indirect way of supporting the Russian war on Ukraine. I'm afraid this will be the new attempt to block those imports. If successful, expect UAN inventories to get much tighter and move to a much more common premium vs urea.
StoneX Ratio Calculation
The ratio calculation is derived from Bloomberg historical grains values as well as fertilizer values from StoneX, NPKFAS, and Argus.
The calculation is simply dividing the fertilizer price by each grain price.
All data was sourced from StoneX unless otherwise noted.




